
Quick Answer: DOW THEORY is a 120-year-old framework that defines six principles: the market discounts everything, prices move in three types of trends, primary trends have three phases, indices must confirm each other, volume must confirm the trend, and trends persist until a clear reversal occurs. As of April 12, 2026, Nifty 50 is actively testing the framework with a lower high at 26,341 after its 26,373 all-time high.
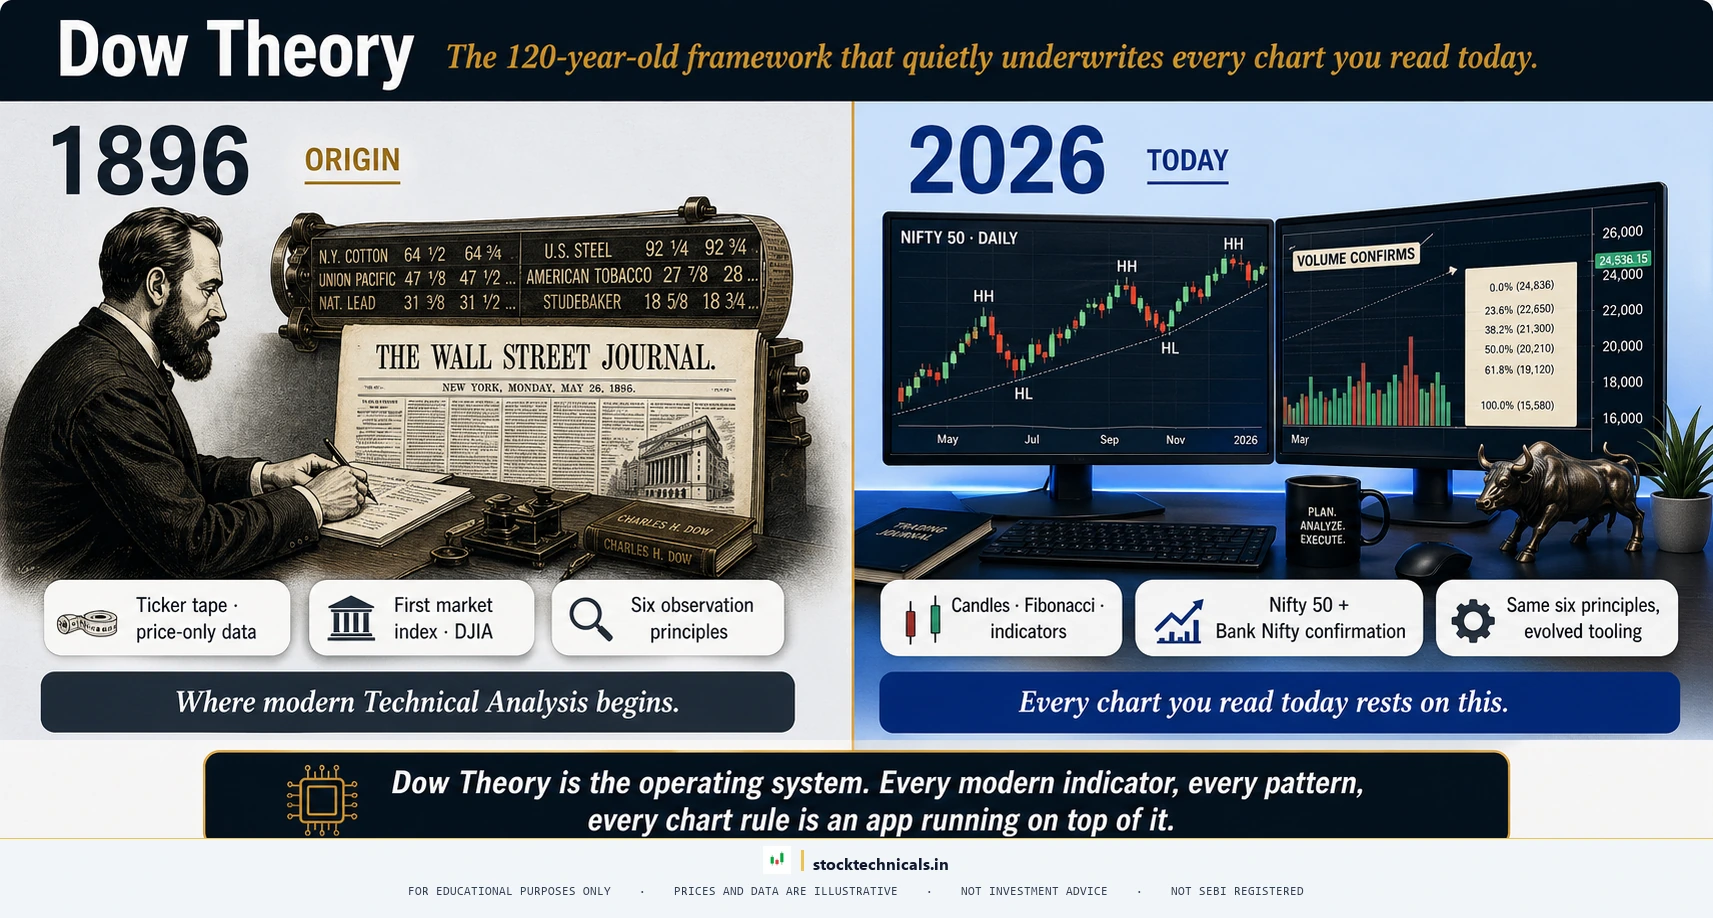
Every concept in technical analysis — trends, support and resistance, volume confirmation, breakouts, pullbacks — traces back to one framework: DOW THEORY. Before indicators existed, before candlestick patterns became popular, before algorithms traded billions of rupees in milliseconds, Charles Dow was publishing Wall Street Journal editorials that quietly defined how markets move.
Quick Answer: Dow Theory is the 120-year-old framework that defines how markets move — the market discounts everything, prices trend in three time horizons, primary trends have three phases, indices must confirm each other, volume must confirm the trend, and trends persist until a clear reversal occurs. Every modern technical concept traces back to these six tenets. When traders check whether Nifty 50 and Bank Nifty agree on direction before taking a position, that is Dow Theory in practice.
When a CNBC-TV18 analyst says “the primary trend is still bullish” or “this looks like a secondary correction,” that language comes directly from Dow Theory. When a trader on Zerodha Kite checks whether Nifty 50 and Bank Nifty (NSE: BANKNIFTY) agree on direction before taking a position, that is Dow Theory in action. When the Nifty 50 hit a new all-time high of 26,373.20 on January 5, 2026, and then put in a lower high of 26,341.20 on February 3, 2026, traders who understood Dow Theory saw the warning days before the financial press did.
Most beginners skip this framework entirely. They jump straight to RSI, MACD, and candlestick patterns. That is like trying to read sentences without learning the alphabet. Dow Theory IS the alphabet of technical analysis.
This article breaks down all six tenets of Dow Theory with real Nifty 50 and Bank Nifty price data through April 2026, explains the three market phases with verified examples from the NSE, walks through the Dow reversal test traders are watching right now, and provides a practical checklist for applying these principles to everyday trading decisions.
Key Takeaways
- DOW THEORY provides six principles that form the foundation of ALL technical analysis tools used today
- The primary Nifty 50 bull trend ran from 7,511.10 (March 24, 2020) to 26,373.20 (January 5, 2026) — a gain of 251.1% over five years and nine months
- Two secondary corrections survived this bull run: October 2021 to June 2022 (-18.39%) and September 2024 to February 2025 (-15.80% to weekly close low, -17.25% to the April 2025 intraweek low)
- As of April 12, 2026, Nifty 50 is flashing a Dow Theory reversal warning — a lower high at 26,341 followed by a test of the Dow line at 22,124.70
- Bank Nifty has NOT confirmed the Nifty reversal yet — its March 2026 low of 51,323.60 is still above its November 2024 swing low of 49,787.10
- Dow Theory’s sixth tenet demands a clear reversal — until weekly closes break 22,124.70 on Nifty AND 49,787.10 on Bank Nifty, the primary trend is under pressure but not officially broken
What Is Dow Theory and Why It Still Matters
DOW THEORY is the oldest and most influential framework in technical analysis. It provides a logical structure for understanding how markets move — not through predictions, but through principles that describe market behaviour.
The Man Behind the Theory
Charles Henry Dow (1851–1902) was the co-founder of Dow Jones & Company and the first editor of The Wall Street Journal. He never wrote a formal book about his ideas. Instead, he published a series of editorials between 1899 and 1902, observing how the Dow Jones Industrial Average and the Dow Jones Transportation Average moved in relation to each other.
After Dow’s death, two financial journalists compiled and refined his observations into the structured framework traders use today. William Peter Hamilton published The Stock Market Barometer in 1922, and Robert Rhea published The Dow Theory in 1932. Edwards and Magee built directly on this foundation in 1948 with Technical Analysis of Stock Trends.
The timeline matters for context:
- 1884: Dow creates the first stock market average with eleven stocks, mostly railroads
- 1896: The Dow Jones Industrial Average formally launches with twelve stocks
- 1899 to 1902: Dow publishes his editorials describing market behaviour
- 1902: Dow dies without ever formally naming his approach a “theory”
- 1922: Hamilton publishes The Stock Market Barometer, formalising Dow’s ideas
- 1932: Rhea publishes The Dow Theory, the definitive compilation
- 1948: Edwards and Magee publish Technical Analysis of Stock Trends, building directly on Dow
- 2026: Every charting platform, every moving average, every trend-following system still uses Dow’s framework
Here is the critical insight. Dow did not invent a trading system. He described how markets behave. Every trading tool, indicator, and chart pattern developed since then either validates or builds upon the principles he identified.
Why a 120-Year-Old Framework Still Matters
Traders sometimes ask a fair question: why study a 120-year-old framework when algorithmic trading and artificial intelligence scanners exist? The answer is straightforward. Every modern technical analysis tool is built on the principles Dow first described.
- Moving averages exist to measure trends — a Dow concept
- Volume analysis confirms price moves — Dow articulated this first
- Support and resistance levels reflect supply and demand dynamics — another Dow principle
- The entire concept that prices move in identifiable trends comes directly from Dow Theory
When the Nifty 50 rallied from 7,511.10 in March 2020 to 26,373.20 in January 2026, every phase of that move — the institutional accumulation after the COVID panic, the four-year public participation rally, and the narrowing breadth at the 2026 top — followed the exact pattern Dow described over a century ago. Markets change. Human psychology does not. That is why Dow Theory remains relevant.
The Six Tenets of Dow Theory
Dow Theory rests on six fundamental principles. Each one builds on the previous, creating a complete framework for understanding market behaviour. This section walks through all six with verified Indian market examples.
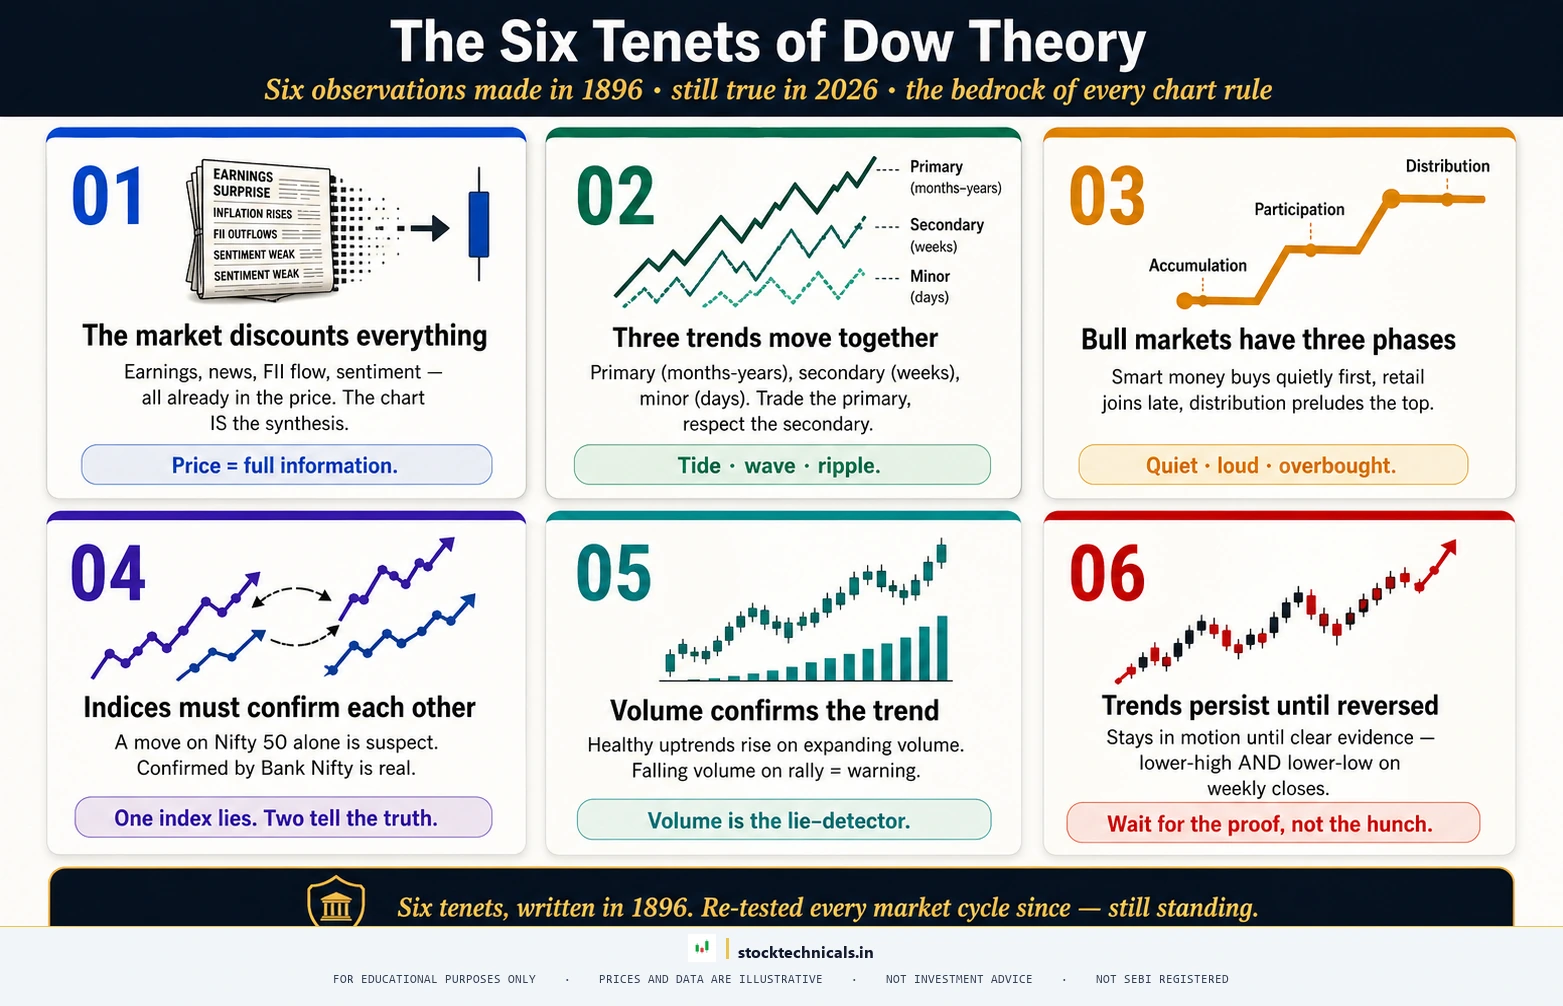
Tenet One: The Market Discounts Everything
This is the foundation of all technical analysis. The principle states that every piece of information — corporate earnings, GDP data, RBI policy decisions, geopolitical events, natural disasters — is already reflected in the current price.
The market is not a mirror that reflects information after the fact. It is a forward-looking mechanism that prices in expectations before events occur.
Key Takeaway: If the current price already reflects every known fact, then studying price action on charts is a valid approach. Chart analysis works BECAUSE prices already discount fundamentals, not in spite of it.
Consider a textbook Indian example. Before the Union Budget announcement each February, the Nifty 50 often moves in anticipation of policy changes. By the time the Finance Minister stands up to speak, much of the expected impact is already priced in. This is why “buy the rumour, sell the news” works so often. The market discounted the information long before the official announcement.
A more recent example. When the Reserve Bank of India cut rates in early 2026, the banking stocks had already rallied for weeks. Bank Nifty hit its all-time high of 61,764.85 on February 3, 2026, ahead of any confirmed rate action. By the time the cut was announced, it was a “sell the news” event — classic Dow Theory first tenet in action.
What this means for traders: Do not wait for news to act. Do not blame the market for “not knowing” what happened at the earnings call. The chart already knows, and it tells traders what to do if they listen.
Tenet Two: The Market Has Three Types of Trends
Dow identified three distinct trends that operate simultaneously in every market:
Key Takeaway: Primary trends move in years, secondary corrections in weeks, minor fluctuations in days. All three operate at once. Most retail traders lose money by trading minor ripples while ignoring the primary tide.
PRIMARY TREND (the major tide) — The dominant direction of the market, lasting from one to several years. A primary uptrend means higher highs and higher lows on a weekly or monthly chart. A primary downtrend means lower highs and lower lows.
The Nifty 50 primary uptrend from March 24, 2020 (7,511.10) through January 5, 2026 (26,373.20) lasted five years and nine months. That is a textbook primary bull trend — the tide rising steadily for nearly six years.
SECONDARY TREND (intermediate waves) — Corrections within the primary trend, typically lasting three weeks to three months. A secondary correction retraces one-third to two-thirds of the previous primary move.
During the 2020–2026 Nifty bull run, two secondary corrections stood out. The first ran from October 19, 2021 (18,604.40 high) to June 17, 2022 (15,183.40 low) — an 18.39 percent decline over eight months. The second ran from September 27, 2024 (26,277.35 high) to February 28, 2025, when Nifty printed its lowest weekly close of 22,124.70 — a 15.80 percent decline from the September high. Nifty later made an even deeper intraweek low of 21,743.65 on April 7, 2025 (-17.25 percent peak-to-trough), but that week closed back above 22,800, so the Feb 28 weekly close remained the governing Dow swing low. In both corrections, the primary trend remained bullish, and the market resumed its upward path.
MINOR TREND (daily ripples) — Short-term fluctuations lasting less than three weeks. Dow considered these “noise” — unpredictable and largely irrelevant for serious market analysis.
This is worth emphasising. Most retail traders lose money because they trade minor trends while ignoring the primary trend. Per the latest SEBI study covering FY24-25, 91 percent of individual equity F&O traders lost money, with aggregate losses of ₹1.06 lakh crore. Many of those losses came from fighting the tide while trying to catch ripples. Set a daily loss limit of 2 percent of capital and do not trade against the primary trend. This keeps traders in the game long enough to learn.
Tenet Three: Primary Trends Have Three Phases
Every primary trend — bullish or bearish — moves through three distinct phases. Understanding which phase the market is in determines what kind of trade works and what kind does not.
Key Takeaway: Accumulation (smart money buys in silence), Public Participation (the long trending phase), Distribution (smart money sells to retail at the top). Ninety percent of a primary trend’s gains come from the public participation phase.
ACCUMULATION PHASE — Institutional investors, foreign portfolio investors, and large funds start buying when the market is at its lowest point. Sentiment is terrible. Headlines are bearish. Retail traders are selling or staying away. Volumes are low but steady.
The Nifty 50 accumulation phase after the COVID crash (March 25 – June 15, 2020) is a perfect case study. While retail investors panicked and sold near 7,511, foreign institutional investors and domestic mutual funds quietly accumulated positions. The index traded between 7,714 and 10,328 for approximately 11 weeks. The general public wanted nothing to do with the stock market. That was the signal for smart money to buy.
PUBLIC PARTICIPATION PHASE — The trend becomes visible. Prices rise noticeably. Financial media coverage turns positive. Retail traders begin entering the market. This is the longest and most profitable phase of a bull market.
For the Nifty 50, the public participation phase ran from late May 2020 (first weekly close above 9,500 on May 29, 2020 at 9,580.30) through August 2024 (first close above 25,000 on August 1, 2024 at 25,010.90). Key milestones during this phase:
- First close above 12,000: November 5, 2020 (reclaiming pre-COVID high)
- First close above 15,000: February 8, 2021
- First close above 18,000: October 13, 2021
- First close above 20,000: September 13, 2023
- First close above 22,000: January 15, 2024
- First close above 25,000: August 1, 2024
Each of those breakout levels was accompanied by expanding volume. Pullbacks to the 50-day and 200-day moving averages were bought consistently. Each correction made a higher low than the previous one. That is textbook public participation.
DISTRIBUTION PHASE — Smart money starts selling to the public. The market makes new highs, but with decreasing momentum. Volumes may spike but price gains narrow. Retail traders are the most bullish at exactly the wrong time.
The Nifty 50 move from September 2024 to January 2026 showed multiple distribution signals:
- FPIs sold a record ₹94,000 crore in Indian cash equities during October 2024 — the largest monthly cash outflow on record
- Market breadth deteriorated — fewer stocks were making new highs even as the index touched all-time highs
- The correction from 26,277 (Sep 27, 2024) to 22,124 (Feb 28, 2025 weekly close) was the deepest since the 2022 correction
- The recovery and new all-time high at 26,373 on January 5, 2026 came on narrower participation and mixed sector leadership
- The February 3, 2026 intraweek high of 26,341 failed to take out the January 5 high — the first clean lower high in six years
In a bear market, these phases reverse: distribution (smart money sells), public participation (panic selling), and accumulation (smart money buys the bottom again). The emotion flips, but the structure repeats.
Tenet Four: Indices Must Confirm Each Other
Dow’s original principle stated that the Dow Jones Industrial Average and the Dow Jones Transportation Average must move in the same direction to confirm a genuine trend. The logic was simple. If industrial companies are producing more goods, transportation companies should be shipping more goods. Both indices should rise together. Divergence between them was a warning signal.
Key Takeaway: For the NSE, the equivalent of Dow’s Industrial-Transportation pair is Nifty 50 and Bank Nifty. Both must agree on direction for high-conviction trades. Divergence is a warning to reduce position size, not an automatic reversal signal.
The Indian adaptation: For the NSE, traders use Nifty 50 and Bank Nifty (plus Nifty 500 for broader confirmation). Why Bank Nifty? Banking is the backbone of economic activity. If banks are lending more and their stocks are rising, it confirms that economic expansion is real — companies are borrowing to grow, consumers are spending, and credit is flowing.
The full 2020 to 2026 confirmation track record:
| Period | Nifty 50 | Bank Nifty | Dow Signal |
|---|---|---|---|
| Mar 24, 2020 COVID low | 7,511.10 | 16,116.20 | Both bottomed same day — confirmed |
| Oct 2021 swing high | 18,604.40 | 41,829.60 | Both peaked within 6 days — confirmed |
| Jun 2022 swing low | 15,183.40 | 32,290.60 | Both bottomed same day — confirmed |
| Sep 2024 swing high | 26,277.35 (Sep 27) | 54,467.35 (Sep 26) | Both peaked within 1 day — confirmed |
| Nov 2024 swing low | 23,263.15 | 49,787.10 | Both bottomed same day — confirmed |
| Jan 2026 new ATH (Nifty) | 26,373.20 (Jan 5) | 60,114.30 (Dec 1, 2025) | Partial — Nifty made new ATH while Bank Nifty lagged |
| Feb 2026 new ATH (Bank) | 26,341.20 (Feb 3) — lower high | 61,764.85 (Feb 3) | Mixed — Bank Nifty confirmed high, Nifty printed first LH |
Notice the subtle change at the top. Through 2020 to 2024, Nifty 50 and Bank Nifty bottomed and topped within days of each other. At the 2026 top, Bank Nifty made its peak nearly five weeks after Nifty’s January 5 ATH. On the same day Bank Nifty hit its 61,764.85 high (February 3, 2026), Nifty only managed 26,341.20 — a lower high relative to its own January 5 print of 26,373.20. That kind of lagged-confirmation-plus-lower-high is not a fatal Dow violation, but it is a clear warning that momentum is shifting.
When confirmation fails: If Nifty 50 is making new highs but Bank Nifty is not, that is a classic non-confirmation. It suggests the rally may not be broad-based. Similarly, if Bank Nifty is falling while Nifty 50 is holding up, the divergence signals potential weakness ahead. The cleanest trades happen when both indices agree. This principle is one of the most practical tools from Dow Theory — use it as a filter before any directional position.
Compare the Nifty swing structure above with Bank Nifty’s structure over the same 2024–2026 window. Both indices made coordinated highs in September 2024 and November 2024 lows, but Bank Nifty’s all-time high came five weeks AFTER Nifty’s on February 3, 2026. As of April 2026, Bank Nifty’s March 2026 low of 51,323.60 remains comfortably above its November 2024 swing low of 49,787.10. Per Dow’s fourth tenet, both indices must confirm the reversal for a Dow-sanctioned bear market call. Bank Nifty has not yet confirmed.
Tenet Five: Volume Must Confirm the Trend
DOW THEORY states that volume should expand in the direction of the primary trend and contract during corrections.
Key Takeaway: Volume is the fuel. Price is the engine. An engine without fuel stalls. A breakout on expanding volume is real. A breakout on declining volume is a trap. Always check the volume bars before acting on any price signal.
In a primary uptrend:
- Rising prices + rising volume = healthy trend, likely to continue
- Rising prices + declining volume = weakening trend, possible reversal ahead
- Falling prices + high volume = strong selling pressure, potential trend change
- Falling prices + low volume = normal pullback, trend likely intact
Real NSE example: Reliance Industries printed its COVID panic low of ₹432.10 on March 23, 2020. For the next five weeks, the stock traded in a tight range between roughly ₹700 and ₹797. On May 11, 2020 it tagged a clean resistance high of ₹796.95 and pulled back. Then on June 19, 2020, Reliance broke above that resistance with a decisive gap-up candle closing at ₹879.70 on volume of 97.66 million shares — 2.13 times the prior 50-day average of 45.87 million. That volume expansion confirmed the breakout. Reliance went on to rally from the ₹432.10 COVID low (March 23, 2020) to its all-time high of ₹1,608.80 on July 8, 2024 — a gain of 272 percent over four years and three months. A price move without volume is like a car trying to accelerate without fuel. It will not sustain.
Practical application on Zerodha Kite or TradingView: Enable volume bars at the bottom of the chart. When a stock or index makes a new high, check whether volume is expanding or contracting. If volume is shrinking while prices rise, that divergence is worth noting. Set a rule — no breakout trade without at least 1.5x the 20-day average volume. That single filter eliminates most false breakouts.
Tenet Six: Trends Persist Until a Clear Reversal
The sixth tenet is the most important for active traders: a trend remains in effect until a definitive reversal signal appears.
Key Takeaway: A secondary correction is NOT a trend reversal. It is a pause within the trend. Reversal requires a lower high AND a lower low on the weekly chart. One bad week does not end a six-year primary bull.
This means:
- Do NOT assume a trend has reversed just because the market had a bad week
- Do NOT try to pick tops in an uptrend or bottoms in a downtrend
- A secondary correction is NOT a trend reversal — it is a pause within the trend
What counts as a clear reversal? According to Dow Theory, a trend reverses when the market makes a lower high followed by a lower low (in an uptrend) or a higher low followed by a higher high (in a downtrend). Both conditions must be met on weekly closes — not just one, and not on intraday noise.
The current Nifty 50 Dow test (as of April 12, 2026):
- Higher High (HH): 26,373.20 on January 5, 2026 — the all-time high
- Lower High (LH): 26,341.20 on February 3, 2026 — the first lower high in the six-year bull trend
- Previous Swing Low: 22,124.70 weekly close on February 28, 2025
- Current Weekly Close: 22,512.65 on March 27, 2026 — still 387 points (1.76 percent) above the Dow line
As of April 2026, the first reversal condition (lower high) has been met. The second condition (lower low) has NOT been confirmed. Nifty must produce a weekly close below 22,124.70 to trigger a strict Dow Theory primary trend reversal. Bank Nifty has not confirmed either — its March 2026 low of 51,323.60 sits comfortably above its November 2024 swing low of 49,787.10. Per Dow’s fourth tenet, both indices must confirm. Neither has. The warning is real, but the reversal is not yet official.
This principle protects traders from one of the most expensive mistakes — jumping out of a good trade too early because of a normal pullback. The trend is the trader’s friend until it clearly, definitively ends.
The 2020–2026 Nifty Bull Market: A Full Dow Theory Case Study
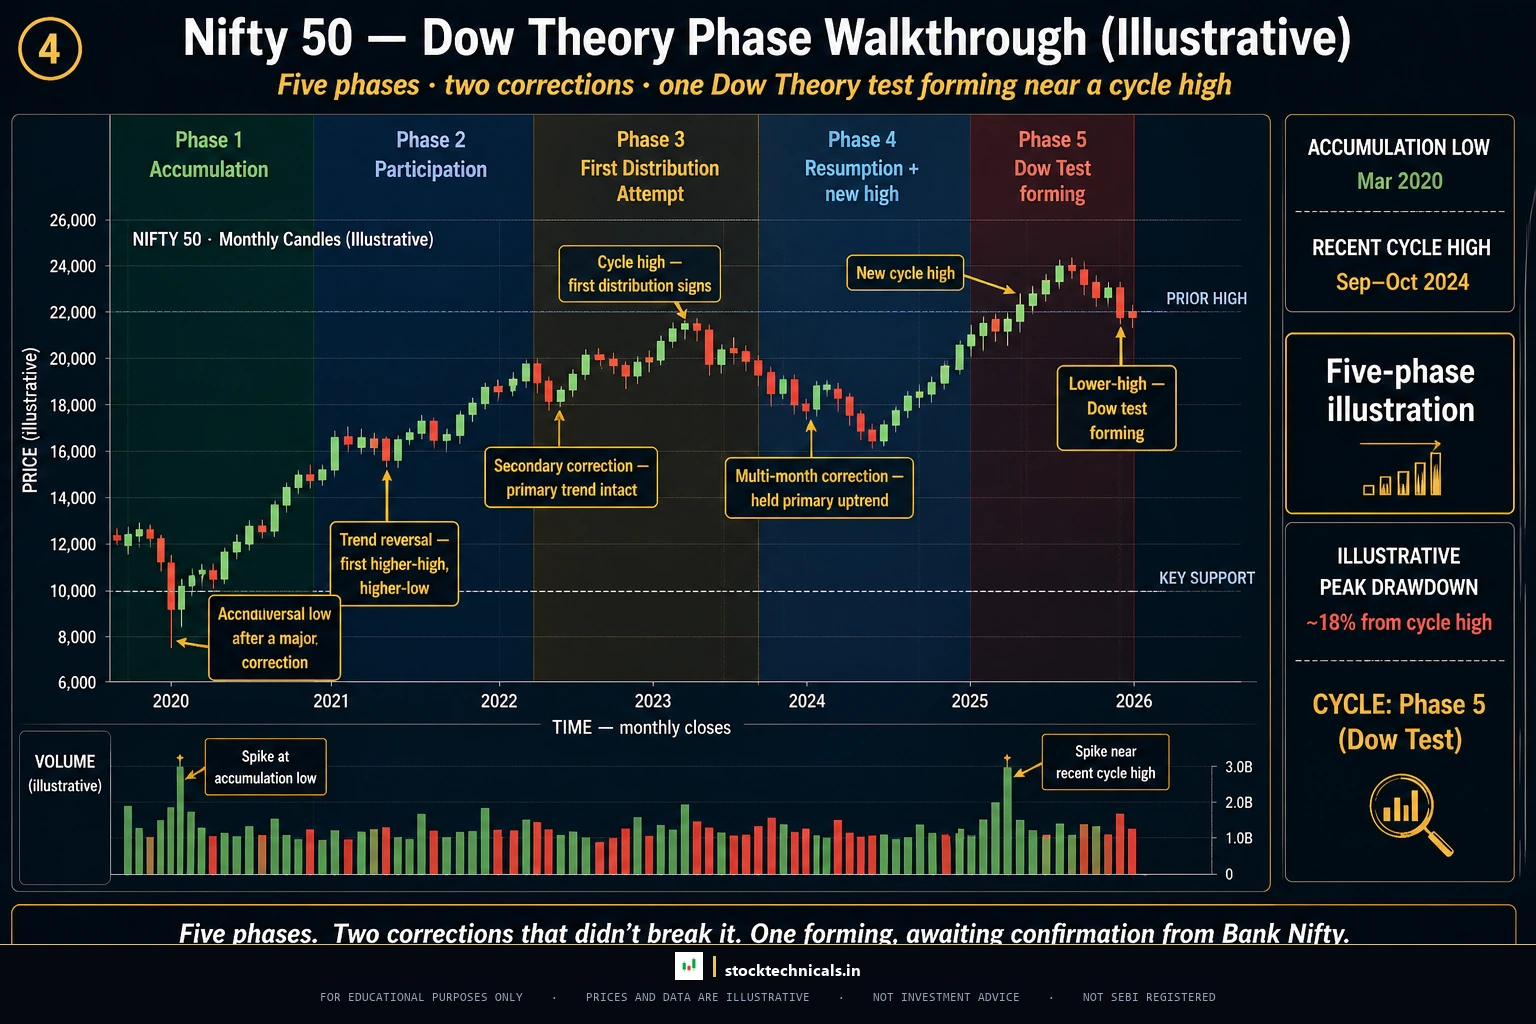
Theory without application is useless. Here is how Dow Theory played out in the real Nifty 50 market over the past six years — every phase, every secondary correction, every confirmation signal, all verified against NSE data.
Phase One: Accumulation (March – June 2020)
Nifty 50 crashed from its all-time high of 12,430.50 on January 20, 2020 to a panic low of 7,511.10 on March 24, 2020 — a decline of 39.6 percent over 46 trading sessions. The sharpest leg lost 38.1 percent in just 23 trading sessions between February 19 and March 24 as the COVID pandemic spread globally.
By April 2020, pessimism was extreme. Headlines screamed about economic collapse. Retail investors were liquidating positions at a loss. The general mood was that the Indian economy would not recover for years.
But the data told a different story. FIIs turned net buyers in late March 2020. Domestic mutual funds continued their systematic investment plan purchases. The Nifty traded between 7,714 and 10,328 for approximately 11 weeks while sentiment stayed bearish and volumes remained low. Classic accumulation. The smart money was buying in silence while retail was selling in panic.
Phase Two: Public Participation (July 2020 – August 2024)
The breakout above 9,500 on May 29, 2020 (weekly close 9,580.30) marked the beginning of the public participation phase. Over the next four years and three months, Nifty 50 climbed from roughly 9,500 to 25,010 — a gain of 163 percent.
Key confirmation signals during this phase:
- Bank Nifty confirmed every major Nifty move. Both indices made coordinated higher highs and higher lows throughout the bull run, satisfying Dow’s fourth tenet.
- Volume expanded on breakout days above key levels: 12,000 (Nov 2020), 15,000 (Feb 2021), 18,000 (Oct 2021), 20,000 (Sep 2023), 22,000 (Jan 2024), and 25,000 (Aug 2024).
- Pullbacks held above rising moving averages. The 2021 correction held the 50-week EMA. The 2022 correction held the 200-day EMA.
- Each secondary correction made a higher low than the previous one. Dec 2021 (16,410) was higher than Jun 2020 (9,544). Jun 2022 (15,183) was higher than Nov 2021. This is the textbook definition of an uptrend.
The first test — Secondary correction Oct 2021 to Jun 2022: After Nifty hit 18,604.40 on October 19, 2021, it fell to 15,183.40 on June 17, 2022. That is an 18.4 percent decline over eight months. On social media, analysts declared the bull market over. The primary trend was still intact. Nifty went on to rally another 73 percent from that correction low to reach 26,277 by September 2024. Traders who sold at 15,183 because they mistook the secondary correction for a trend reversal missed one of the biggest index rallies in NSE history.
Phase Three: First Distribution Attempt (September 2024 – February 2025)
Nifty 50 peaked at 26,277.35 on September 27, 2024. The warning signs were clear:
- FPIs sold approximately ₹94,000 crore in Indian cash equities during October 2024 alone — the largest monthly cash outflow ever recorded in Indian markets
- Market breadth was deteriorating — fewer stocks were making new highs even as the index touched all-time highs
- Bank Nifty failed to make a new high on the final Nifty push to 26,277 on September 27, topping one day earlier at 54,467 on September 26
- Volume on up days was declining while volume on down days was increasing
The correction from 26,277 ran through October 2024 (low 24,694), November 2024 (weekly close 23,263), December 2024 (low 23,537), January 2025 (low 23,047), and printed its lowest weekly close of 22,124.70 on February 28, 2025 — a 15.80 percent decline over five months. Nifty then chopped sideways through March and spiked to an even deeper intraweek low of 21,743.65 on April 7, 2025 (-17.25 percent peak-to-trough), but the following week closed at 22,828.55 — back above the Feb 28 weekly close. Per Dow’s original framework, weekly closes govern primary swing lows, so the February 28, 2025 weekly close of 22,124.70 remains the reference point for Dow Theory analysis of this correction.
Again, analysts called the end of the bull market. Again, Dow Theory’s sixth tenet held firm — the market needed a confirmed reversal signal, not just a deep correction. The primary trend was still intact because the long-term higher-low structure held.
Phase Four: Resumption and New ATH (March 2025 – January 2026)
From the April 2025 low, Nifty 50 resumed its climb. It cleared 24,000 by June 2025, 25,000 by September 2025, 26,000 by November 2025, and made a fresh all-time high of 26,325.80 on December 1, 2025. On January 5, 2026, Nifty printed its true all-time high: 26,373.20.
Bank Nifty confirmed with its own fresh ATH of 61,764.85 on February 3, 2026. Both indices made higher highs. The primary bull trend was officially over six years old. Every rule Dow Theory cared about was still in place.
Phase Five: The April 2026 Dow Test (January 2026 – Present)
Then came February 2026. Nifty’s February 3 intraweek high of 26,341.20 failed to exceed the January 5 high of 26,373.20. That is the first clean lower high in the six-year bull trend — the first reversal condition per Dow Theory.
The subsequent decline ran through February and March 2026. By March 23, 2026, Nifty had pulled back to an intraweek low of 22,471.25, with a weekly close of 22,512.65 on March 27. From the January 5 peak, that is a 14.8 percent decline in 11 weeks.
The line in the sand is 22,124.70 — the February 2025 weekly close low. A Nifty weekly close below 22,124.70 confirms the Dow Theory primary trend reversal on Nifty 50. A similar break in Bank Nifty below 49,787.10 (the November 2024 swing low) confirms the reversal on Bank Nifty. Both conditions together produce a Dow-confirmed bear market.
As of April 12, 2026, neither condition has been met. Nifty’s current weekly close of 22,512.65 sits 1.76 percent above the Dow line. Bank Nifty’s current 51,323.60 sits 3.08 percent above its corresponding line. The warning is real. The verdict is not yet in.
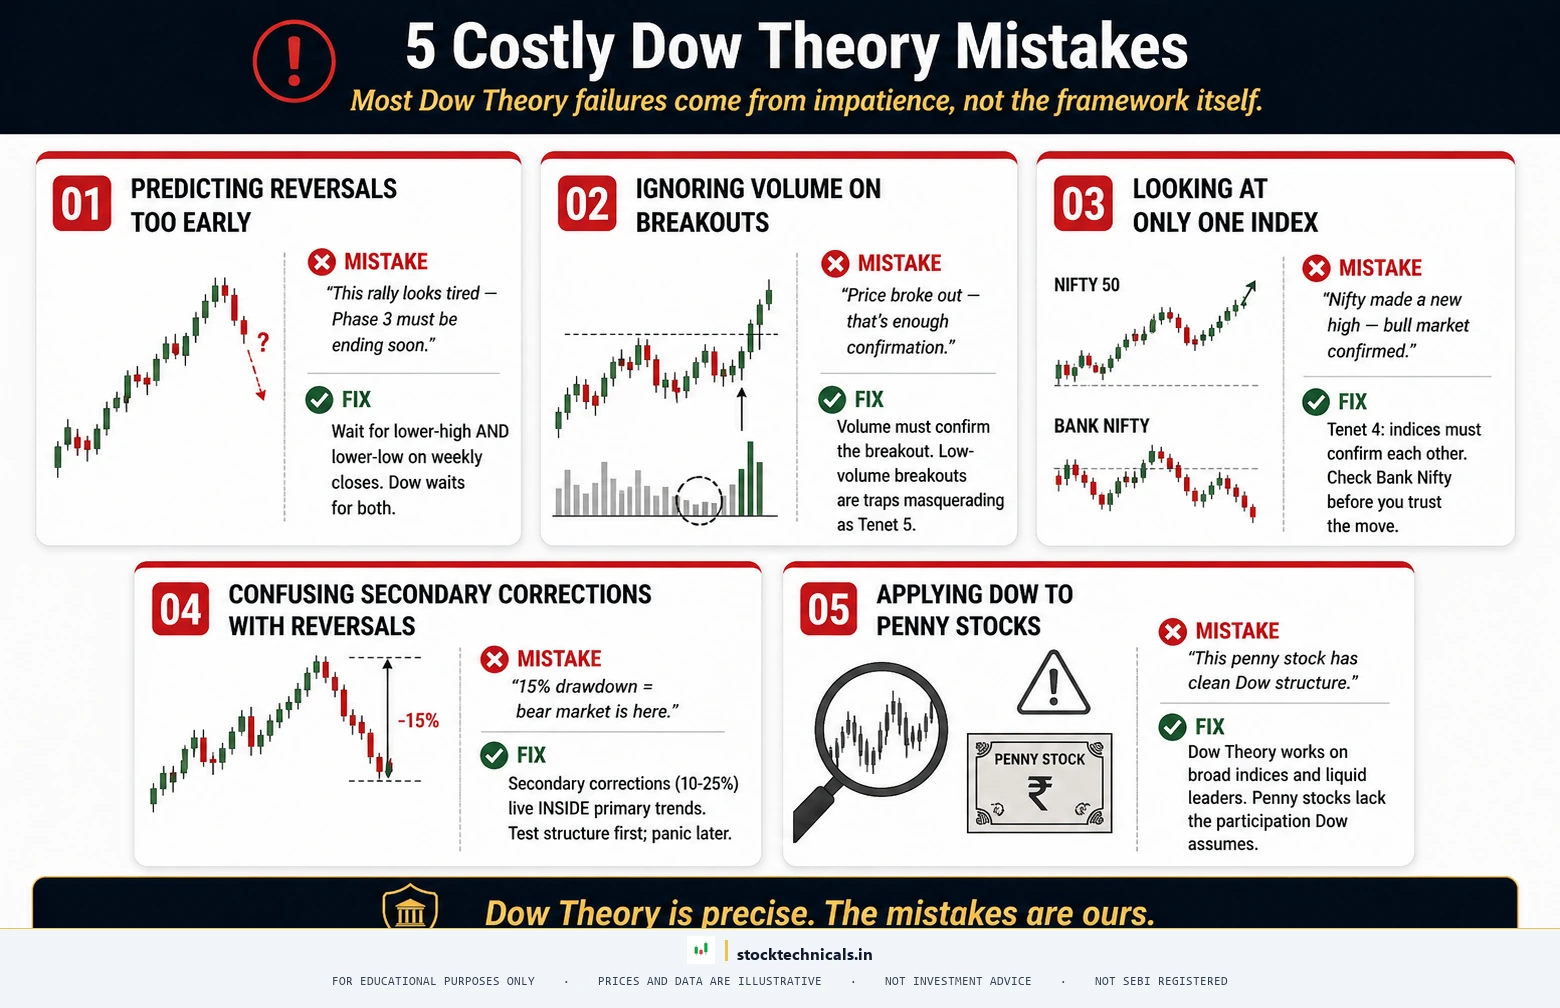
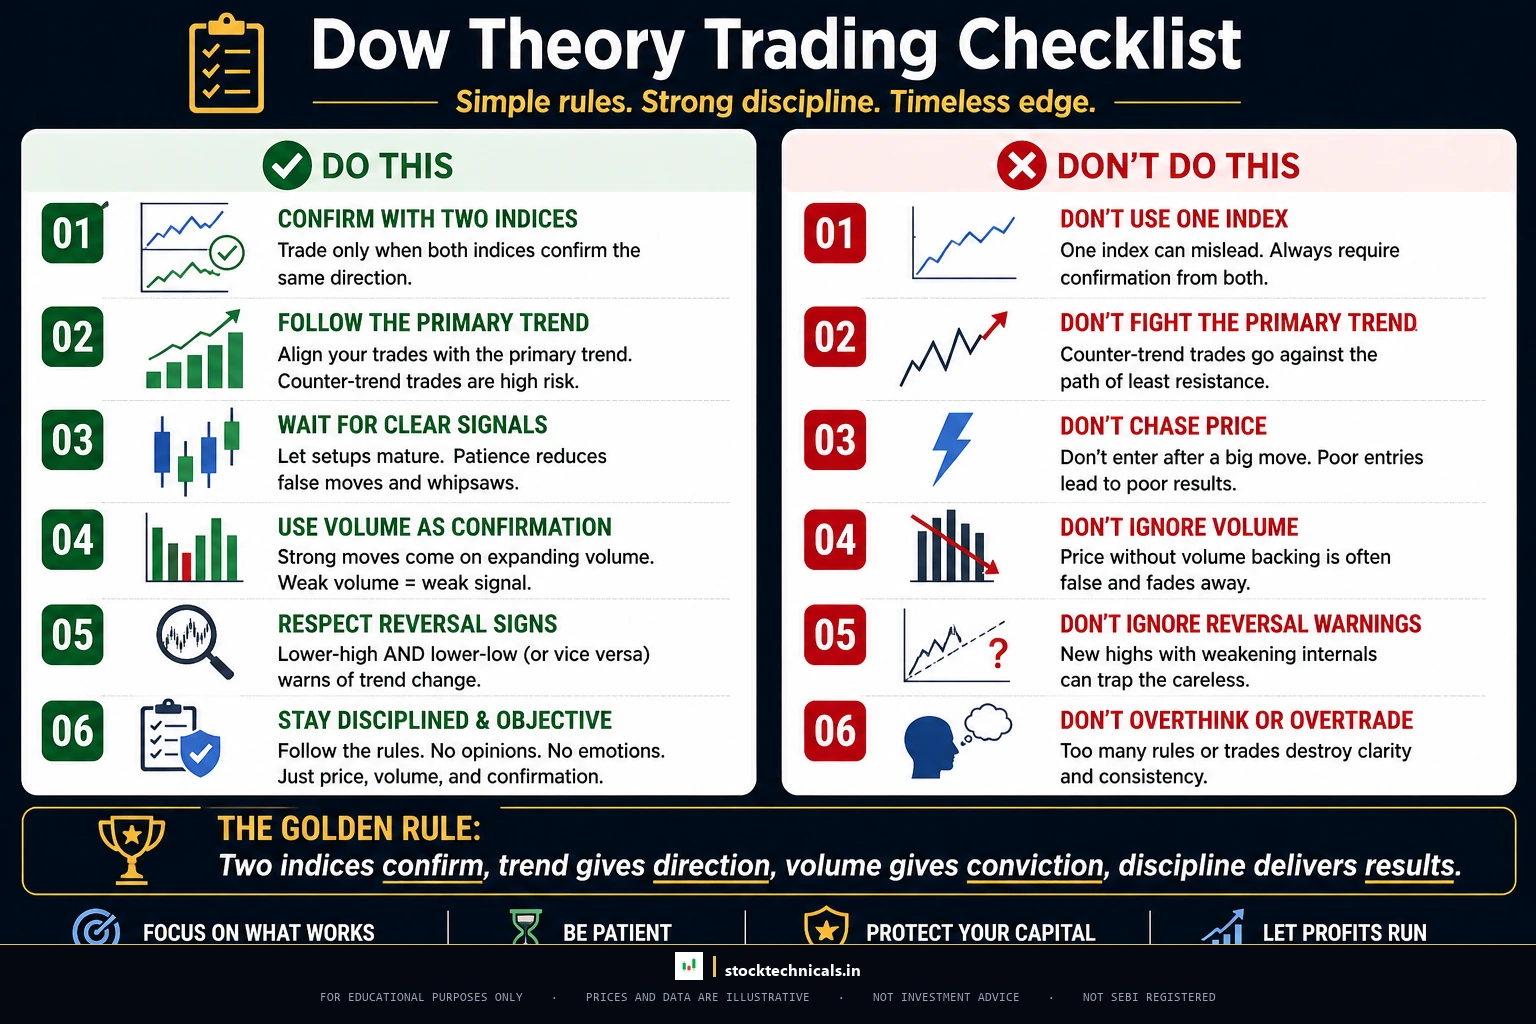
Common Mistakes When Using Dow Theory
Even traders who understand Dow Theory intellectually make predictable mistakes in practice. These are the expensive ones.
Predicting Reversals Too Early
The most expensive mistake traders make is calling a trend reversal during a secondary correction. When Nifty 50 corrected 18.4 percent from October 2021 to June 2022, many traders declared the bull market over. The primary trend was still intact, and Nifty went on to rally another 73 percent from that correction low.
The fix: Wait for BOTH conditions — a lower high AND a lower low on the weekly chart — before declaring a trend reversal. One bad week does not end a multi-year trend. Use the previous confirmed swing low as the line in the sand. Until a weekly close breaks below it, treat every pullback as a secondary correction.
Ignoring Volume on Breakouts
Many traders focus exclusively on price and ignore volume entirely. This violates Dow’s fifth tenet. A breakout above resistance on low volume is suspicious. A pullback on heavy volume is a warning.
The fix: Always check volume on TradingView or Zerodha Kite before taking any breakout trade. Require at least 1.5x the 20-day average volume on a breakout candle. Volume is the truth serum of the market.
Looking at Only One Index
Trading Nifty 50 options without checking Bank Nifty (or vice versa) ignores the index confirmation principle. If Nifty is breaking out but Bank Nifty is not confirming, the breakout may fail. If both break in the same direction, the conviction is higher.
The fix: Before any directional trade on Nifty, pull up a Bank Nifty chart side by side. Both should be moving in the same direction for high-probability trades. When they diverge, reduce position size by half or skip the trade entirely.
Confusing Secondary Corrections with Trend Reversals
A 5 to 10 percent correction in a bull market feels catastrophic in the moment. Social media amplifies the fear. But secondary corrections are normal and healthy — they shake out weak hands and create pullback entries for disciplined traders.
The fix: Use timeframe analysis. A correction on the daily chart may look like a minor pullback on the weekly chart. Always check the bigger picture. If the weekly higher-low structure is intact, the correction is secondary. If it breaks, it is a reversal.
Applying Dow Theory to Penny Stocks
Dow Theory was designed for broad market indices, not illiquid penny stocks. Applying these principles to stocks with low float and minimal institutional interest leads to false signals — a 50 percent “correction” in a penny stock is often just a liquidity gap, not a Dow-style secondary trend.
The fix: Use Dow Theory for index analysis (Nifty 50, Bank Nifty, sector indices) and high-volume large-cap stocks. For mid-caps and small-caps, combine it with other tools like volume profile, order flow, and fundamental screening.
Dow Theory vs Modern Technical Analysis
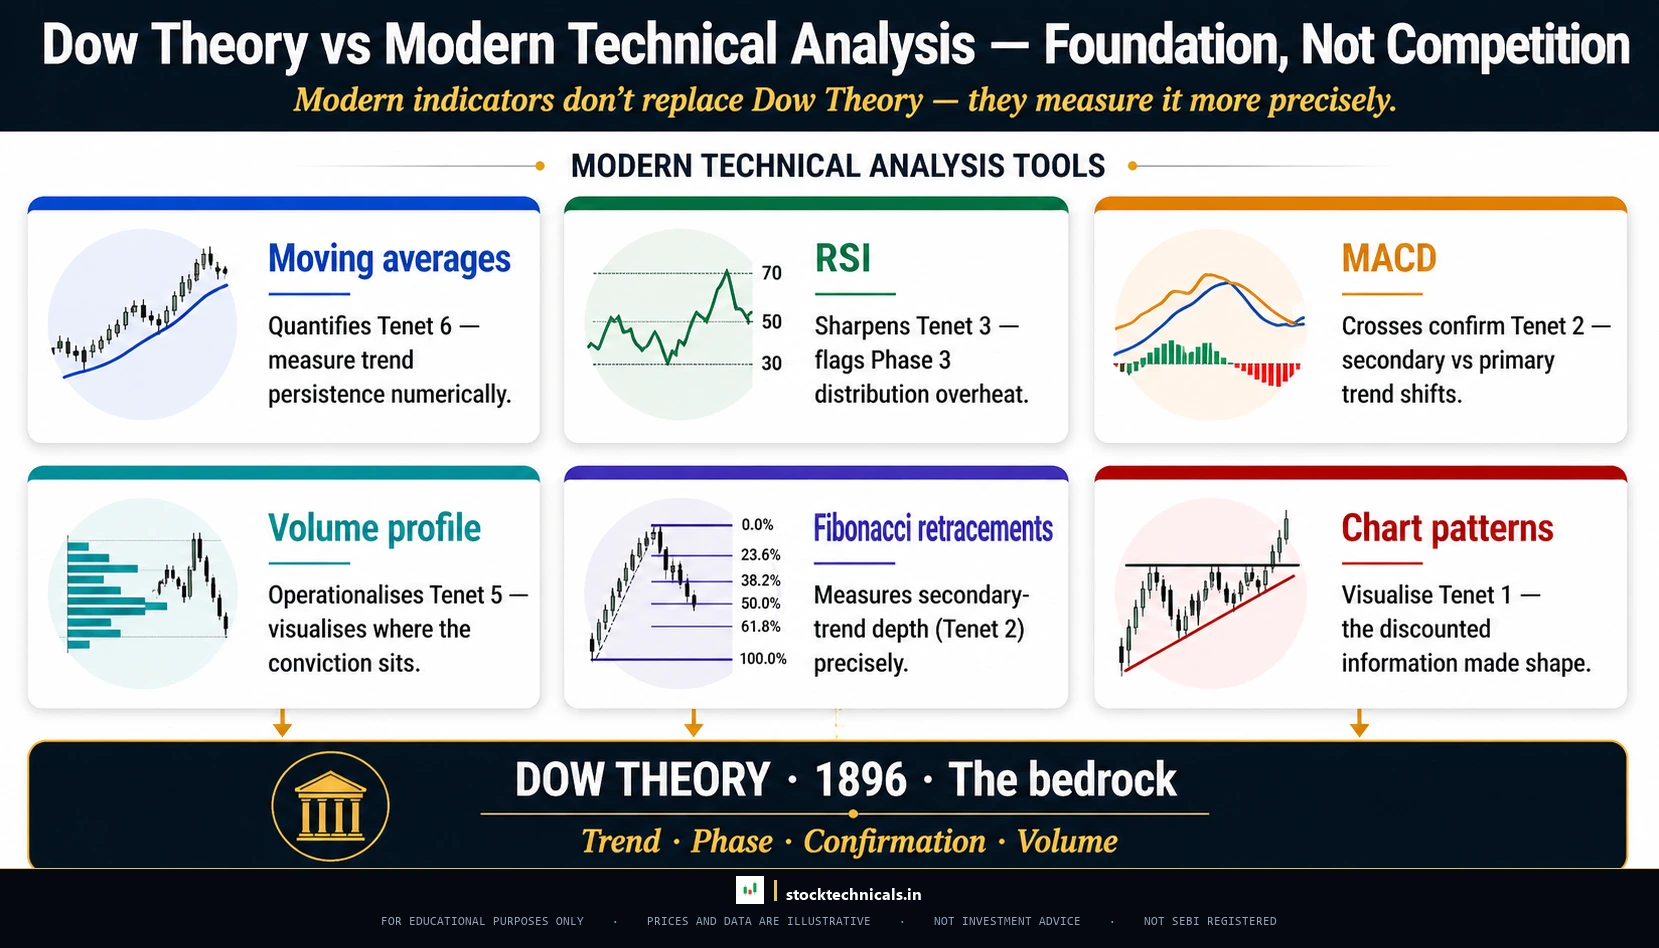
Dow Theory was published before computers existed. Modern technical analysis has evolved significantly since then. How do the two compare, and should traders use one or the other?
What Dow Theory does well:
- Defines the framework for understanding trends and market structure
- Provides a logical basis for why technical analysis works (prices discount all known information)
- Identifies market phases that repeat across all time periods and all markets
- Forces traders to think about the big picture before focusing on details
- Works on any market, any timeframe, in any era
What modern tools add:
- Moving averages quantify trends mathematically (Dow described them qualitatively)
- RSI, MACD, and Bollinger Bands provide objective overbought/oversold readings
- Candlestick patterns offer precise entry and exit signals
- Computer-based scanning can identify Dow conditions across thousands of stocks simultaneously
- Real-time data allows intraday analysis that Dow never imagined
The relationship is additive, not competitive. Modern indicators MEASURE what Dow DESCRIBED. Using both together gives traders the strongest analytical framework.
A practical example. Dow Theory tells traders to trade in the direction of the primary trend. The 200-day EMA provides an objective way to define that trend. Dow Theory says volume must confirm — the On-Balance Volume indicator quantifies that confirmation. Dow Theory says wait for a clear reversal — a bearish weekly close below the previous swing low provides that signal. Every “modern” tool has a Dow Theory ancestor.
Limitations and Criticism of Dow Theory
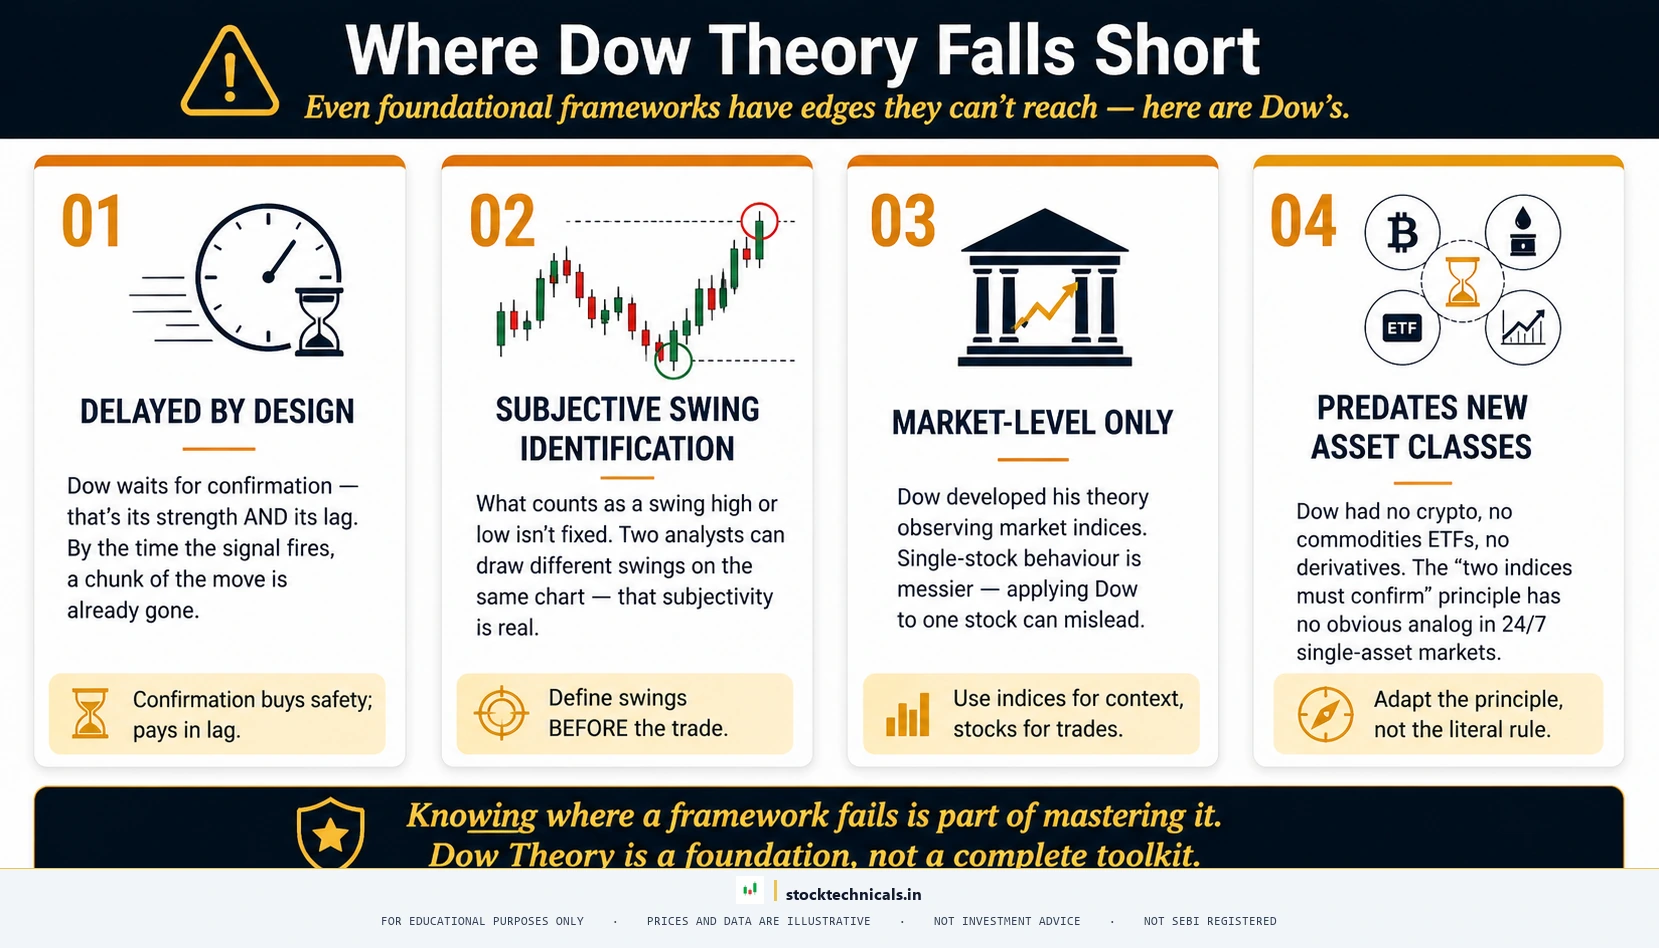
No framework is perfect. Honest traders acknowledge the limitations.
Delayed signals: By the time Dow Theory confirms a trend reversal (lower high plus lower low on weekly closes), a significant portion of the move has already occurred. Smart money has already positioned. This is by design — Dow Theory sacrifices early entry for confirmation. Traders will never buy the exact bottom or sell the exact top using pure Dow Theory. The framework accepts 20 percent of the move as the cost of knowing the other 80 percent is real.
Subjectivity in swing identification: Two experienced analysts can look at the same Nifty 50 chart and disagree about whether a particular swing low constitutes a “lower low” or just a minor dip. There are no hard mathematical rules for what qualifies as a “significant” high or low. Zigzag indicators help but add their own parameters.
No individual stock signals: Dow Theory is a market-level framework. It tells traders whether the tide is rising or falling — it does not identify which specific stock to buy. For stock selection, traders need additional tools like support and resistance analysis, sector rotation studies, and fundamental screening.
Index composition changes: The Nifty 50 constituents change periodically. When new stocks enter and old ones exit the index, the index character itself shifts. Dow never accounted for this because his era had much less frequent index reconstitution.
Cryptocurrency and commodity applicability: Dow Theory was designed for equity markets. Applying it to crypto, commodities, or forex requires adaptation because these markets do not have equivalent “industrial” and “transportation” index pairs for confirmation.
Despite these limitations, the core principles of Dow Theory have survived 120 years of market evolution — through world wars, technological revolutions, financial crises, and the rise of algorithmic trading. No other technical analysis framework has that track record.
How to Use Dow Theory in Daily Trading
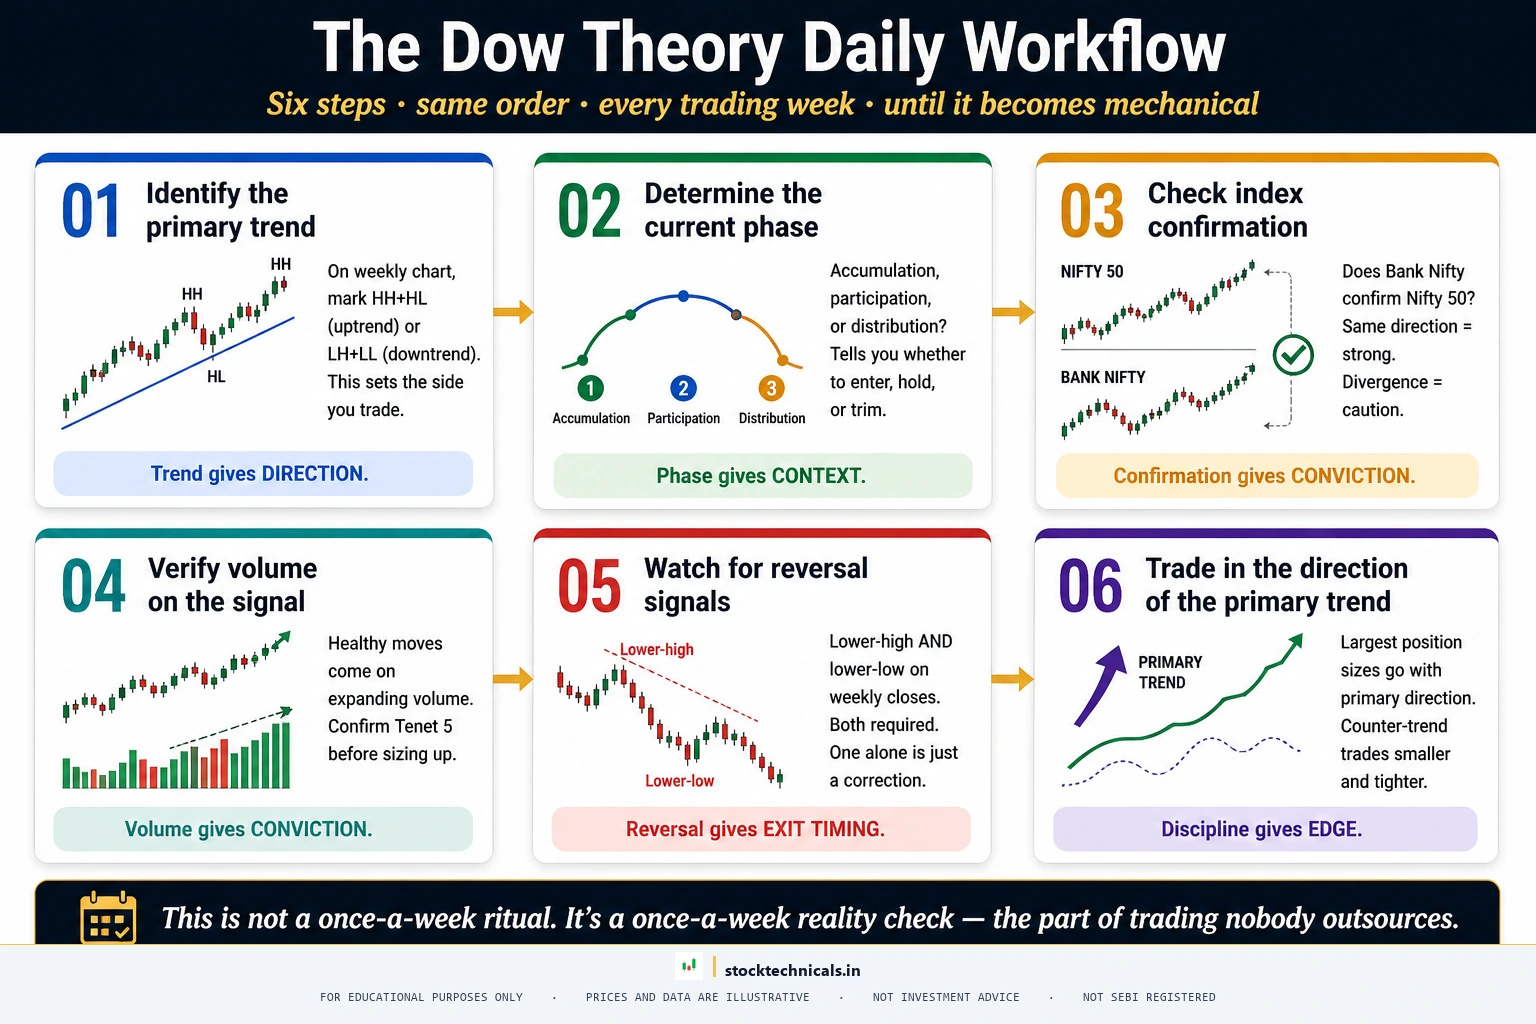
Here is a practical, step-by-step approach for applying Dow Theory to daily trading on Indian markets. This is the checklist to run before every position.
Step One: Identify the Primary Trend
Open a weekly chart of Nifty 50 on TradingView. Is the index making higher highs and higher lows? That is a primary uptrend. Lower highs and lower lows? Primary downtrend. Moving sideways? No clear primary trend — stay cautious, reduce position size, or wait for clarity.
Check the 200-day EMA as a confirming tool. Price above the 200-day EMA supports a primary uptrend. Price below the 200-day EMA supports a primary downtrend. Do not trade against the 200-day EMA direction.
Step Two: Determine the Current Phase
- If the market has fallen significantly and is trading in a range with low but steady volume = Accumulation (potential buy zone)
- If the market is trending with expanding volume and clear momentum = Public Participation (trade with the trend)
- If the market is at new highs with narrowing breadth, heavy FPI selling, and topping price action = Distribution (reduce exposure)
Step Three: Check Index Confirmation
Open Nifty 50 and Bank Nifty side by side. Are both making new highs together? Confirmation — high-conviction trade. Is one diverging from the other? Warning signal — reduce size or skip the trade. Do not take directional index trades when Nifty and Bank Nifty disagree.
Step Four: Verify Volume on the Signal
On any breakout or reversal candle, check volume. Breakout plus high volume equals real signal. Breakout plus low volume equals suspect signal. A good rule — require at least 1.5x the 20-day average volume on the breakout candle, or else wait for the next setup.
Step Five: Watch for Reversal Signals
In an uptrend, a reversal requires a lower high followed by a break below the previous swing low on a weekly close. Until BOTH conditions occur, the trend is intact. Know the previous swing low by price level — not by feel. Write it down. Check it weekly. That one number decides whether a trader should be long or flat.
Step Six: Trade in the Direction of the Primary Trend
The single most important rule from Dow Theory: do not fight the primary trend. If Nifty 50 is in a primary uptrend, focus on buying pullbacks. If it is in a primary downtrend, focus on shorting rallies.
This does not mean avoiding all counter-trend trades. It means sizing them smaller and exiting them faster. The primary trend should account for 70 to 80 percent of trading activity. Counter-trend trades should use half the normal position size and tighter stops.
How Dow Theory Connects to Everything in This Course
Dow Theory is not a standalone chapter in the learning path. It IS the spine of the learning path. Every concept covered before and after this article connects back to these six principles.
What came before:
- What is Technical Analysis? — Dow Theory provides the foundational logic for why studying charts works
- How to Read Stock Charts — The charts themselves display the trends and phases Dow described
- What is a Trend? — Direct application of Dow’s second tenet (three types of trends)
- Trendlines — A visual tool for connecting Dow’s higher highs and higher lows
- Volume in Trading — Dow’s fifth tenet expanded into a full analytical tool
- Breakouts and Pullbacks — Events within Dow Theory phases (breakouts signal phase transitions, pullbacks are secondary corrections within a primary trend)
What comes after:
- Support and Resistance builds on Dow’s swing highs and swing lows to define price levels
- Timeframes in Trading connects to Dow’s three trend types (primary = weekly, secondary = daily, minor = intraday)
- Types of Trading aligns trading styles with Dow phases — position traders ride primary trends, swing traders trade secondary moves, intraday traders navigate minor fluctuations
Think of Dow Theory as the map. Everything else is specific roads on that map. Without the map, the individual roads make less sense. With the map, every tool and technique has context and purpose.
Interactive Tool: Dow Theory Phase Identifier
Quick Quiz
Test Your Dow Theory Knowledge
Q1. How many tenets does Dow Theory have?
Q2. What are the three phases of a primary bull trend according to Dow?
Q3. According to Dow Theory, when is a primary trend officially reversed?
Q4. What role does volume play in Dow Theory?
Q5. In the Indian market context, which two indices serve as the Dow Theory confirmation pair?
Data Sources and Limitations
Sources: All price levels and index data in this article are sourced from NSE India official records. Charts use real weekly and daily data with no synthetic or adjusted values. The SEBI derivatives loss statistics come from published SEBI studies.
Limitations: Market data can contain errors. Historical prices may differ slightly between data providers due to corporate actions, adjustments, and rounding. All analysis in this article is educational — it is not investment advice. Verify any specific price level independently before making trading decisions.
Dow Theory Phase Identifier
The Core Idea
Dow Theory is the framework that underlies every technical analysis tool. It says markets move in three trends (primary, secondary, minor), primary trends have three phases (accumulation, public participation, distribution), and reversals are only confirmed when a lower high AND a lower low appear together on weekly closes. Indices must also confirm each other.
Classify the Current Market
Answer each question about the market you are analyzing. The identifier scores across primary trend, phase position, index confirmation, volume, and swing-structure integrity — the core Dow Theory checklist.
Test Your Dow Theory Knowledge
Five questions on the six tenets. Score 4 or 5 to pass.
The identifier above converts the six tenets into five objective inputs. Answer each question about the market being analyzed and the tool classifies the current state as Primary Uptrend Intact, Late-Cycle Participation, Distribution Phase, or Dow Reversal Confirmed. The second tab is a five-question self-test covering the same framework. Score four or five to pass.
The Bottom Line on Dow Theory
The hard reality traders ignore: Dow Theory is the most successful technical analysis framework ever created, but retail traders still lose money with it for the same three reasons every cycle. First, they trade minor ripples against the primary tide because intraday charts feel more exciting than weekly charts — the same SEBI study cited above shows 91 percent of individual F&O traders lost money in FY24-25 with aggregate losses of ₹1.06 lakh crore. Second, they call reversals during normal secondary corrections. When Nifty dropped 18.39 percent from October 2021 to June 2022, every WhatsApp group declared the bull market over. Nifty then rallied 73 percent to the September 2024 peak and another 41 percent from the April 2025 low to the January 2026 all-time high of 26,373.20. Third, they ignore volume entirely because it is “boring” compared to candlestick patterns.
What the discipline actually requires: Identify the primary trend on the weekly chart. Know the last confirmed weekly swing low — that is the Dow line. Trade with the trend 70 to 80 percent of the time. Reduce position size when indices diverge. Require volume expansion on breakouts, at least 1.5 times the 20-day average. Wait for both a lower high AND a lower low on weekly closes before calling a reversal. None of this is glamorous. All of it works.
Real Talk: What Dow Theory Will Not Do For Traders
Dow Theory will not call the exact top or bottom. By design, it sacrifices early entry for confirmation. Traders waiting for a weekly close below 22,124.70 on Nifty (the current Dow line as of April 2026) will miss the first 10 to 15 percent of any bear phase. That is the cost of avoiding false signals. The framework accepts giving up 20 percent of any move in exchange for not being whipsawed by every secondary correction.
Dow Theory will not pick stocks. It tells traders whether the tide is rising or falling. It does not tell them which specific stock to buy. Stock selection needs separate tools — sector rotation, relative strength, fundamental screening, support and resistance analysis. A trader who buys any random small-cap during a Dow primary uptrend can still lose 50 percent if that stock is in a broken sector or has a weak balance sheet.
Dow Theory will not work on every asset. It was designed for equity indices. It adapts reasonably well to large-cap liquid stocks and well-established crypto (Bitcoin, Ether). It does not adapt well to penny stocks, low-float names, thinly traded commodities, or assets with no equivalent “confirming index” pair. Trying to apply it to a small-cap multi-bagger is the fastest way to misread noise as signal.
Dow Theory will not replace discipline. Even perfectly applied, it gives probabilities not certainties. Traders still need stop-losses, position sizing, emotional control, and a written trading plan. The framework is a lens, not a crystal ball.
The Bottom Line on Dow Theory
Dow Theory is the alphabet of technical analysis — every modern concept, from support and resistance to volume confirmation to breakout trading, traces back to the six principles Charles Dow laid out more than a century ago. The market discounts everything, prices move in three trend horizons, primary trends cycle through three phases, indices must confirm each other, volume must confirm the trend, and trends persist until a clear reversal signal appears. Traders who skip this framework and jump straight to indicators are reading sentences without knowing the letters.
The next step is applying Dow Theory as a daily filter. Before taking any swing position on NSE, check whether Nifty 50 and Bank Nifty are agreeing on direction, whether volume is confirming the current leg, and whether the primary trend has actually reversed or is just consolidating. When both indices print higher highs with rising volume, trend-following trades have the wind behind them. When they diverge — one printing new highs, the other failing to confirm — that is the single most reliable early warning the Dow framework provides, and it still works on NSE today in exactly the way it worked on the NYSE in 1901.
Key Takeaways
- DOW THEORY provides six principles that form the foundation of ALL technical analysis tools used today
- The market discounts everything — price already reflects all known information
- Three types of trends coexist: primary (months to years), secondary (weeks to months), minor (days to weeks)
- Every primary trend moves through three phases: accumulation, public participation, distribution
- Nifty 50 and Bank Nifty must confirm each other for valid trend signals per Dow’s fourth tenet
- Volume MUST expand in the direction of the primary trend — price without volume is unreliable
- A trend remains in effect until a CLEAR reversal signal appears — lower high AND lower low on weekly closes
- Dow Theory works best as a framework applied to indices and large-cap stocks, not penny stocks
- Modern indicators quantify what Dow Theory describes — use both together for the strongest analytical framework
- The most expensive mistake is calling a trend reversal during a normal secondary correction — wait for both conditions
- As of April 2026, Nifty 50 is in an active Dow Theory test — a lower high at 26,341 with the Dow line at 22,124
- Set a daily loss limit of 2 percent of capital — this keeps traders in the game long enough to learn
Your Next Step
The next article in the learning path covers Types of Trading: Scalping, Intraday, Swing, and Positional — understanding which style fits different personality types and capital sizes, and how to align each style with the phase of the primary trend identified using Dow Theory.
Markets reward patience and discipline. They punish gambling and emotion. Always trade with a plan, manage risk on every position, and never risk more than what is affordable to lose. No setup works without a stop-loss. Protect your capital. Everything else follows.
— ORSLeo, StockTechnicals.in
Frequently Asked Questions
What is Dow Theory in simple terms?
Dow Theory is a framework that describes how stock markets behave. It says markets move in trends (up, down, or sideways), those trends have three phases (accumulation, public participation, distribution), and several conditions must be met to confirm a genuine trend including index confirmation and volume confirmation. It was created from the writings of Charles Dow in the late 1800s and early 1900s and remains the foundation of modern technical analysis.
Is Dow Theory still relevant in 2026?
Absolutely. Every modern technical analysis tool — moving averages, RSI, MACD, trendlines — is built on principles Dow first described. The Nifty 50 bull market from 2020 to 2026 followed Dow Theory phases perfectly: accumulation during the COVID crash, public participation during the recovery rally, and distribution at the 2026 highs. As of April 2026, Nifty 50 is actively testing a Dow Theory reversal signal with a lower high at 26,341.
What are the six tenets of Dow Theory?
The six tenets are: (1) The market discounts everything, (2) The market has three types of trends (primary, secondary, minor), (3) Primary trends have three phases (accumulation, public participation, distribution), (4) Indices must confirm each other, (5) Volume must confirm the trend, and (6) A trend remains in effect until a clear reversal signal occurs.
How does Dow Theory apply to Nifty 50 and Bank Nifty?
Dow’s original principle used the Industrial Average and Transportation Average. For the NSE, the equivalent is Nifty 50 and Bank Nifty. Both indices must be making higher highs and higher lows together for a confirmed primary uptrend. As of April 2026, Nifty 50 has put in a lower high at 26,341 (February 3) after its all-time high of 26,373 (January 5), while Bank Nifty’s March 2026 low of 51,323 remains above its November 2024 swing low of 49,787 — meaning the two indices have not yet confirmed a reversal together.
What is the difference between primary, secondary, and minor trends?
Primary trends last one to several years and define the market’s main direction. The Nifty 50 primary bull trend ran from March 2020 (7,511) to January 2026 (26,373) — nearly six years. Secondary trends are corrections within the primary trend, lasting three weeks to three months, typically retracing 33 to 66 percent of the primary move. Minor trends are daily fluctuations lasting less than three weeks — Dow called these noise.
How do traders identify which phase the market is in?
Look for these signals: Accumulation — market trading sideways after a significant decline, volume low but steady, sentiment maximum pessimism, retail selling. Public Participation — clear trending move with expanding volume, moving averages aligned, public interest growing, new highs on broad participation. Distribution — market at highs but momentum slowing, FII selling data increasing, market breadth narrowing, fewer stocks making new highs. The September 2024 to February 2026 period on Nifty 50 showed classic distribution signals.
Can Dow Theory be used for intraday trading?
Dow Theory was designed for longer timeframes — weekly and monthly charts. However, the principles (trend identification, volume confirmation, phase analysis) can be applied to intraday charts as well. The key difference: intraday primary trends might last a few hours and secondary corrections might last 15 to 30 minutes. Many successful intraday traders use Dow Theory structure on 5-minute and 15-minute charts, but the framework was not designed for this purpose — combine it with specialised intraday tools for best results.
What is the biggest limitation of Dow Theory?
The biggest limitation is delayed signals. By the time Dow Theory confirms a trend reversal (requiring both a lower high AND a lower low on weekly closes), a significant portion of the move has already occurred. Traders will never catch the exact top or bottom using pure Dow Theory. This is by design — it prioritises confirmation over speed. The framework accepts missing 20 percent of the move in exchange for high-conviction entries on the other 80 percent.
How does volume confirm a trend in Dow Theory?
In a healthy uptrend, volume should expand when prices rise and contract when prices pull back. If prices are making new highs but volume is declining, the trend is weakening. If prices are falling on heavy volume, sellers have strong conviction — a potential reversal signal. A good practical rule is to require at least 1.5 times the 20-day average volume on any breakout candle before treating the breakout as valid. Check volume bars on TradingView or Zerodha Kite before acting on any price signal.
What happens when Nifty and Bank Nifty diverge?
When Nifty 50 makes new highs but Bank Nifty does not (or vice versa), it is called a non-confirmation or divergence. This is a warning signal that the current trend may not be sustainable. It does not guarantee a reversal but suggests traders should be cautious — reduce position sizes and tighten stop losses until both indices realign. Persistent divergence often precedes major corrections, as seen in the 2021 to 2022 and 2024 to 2025 secondary corrections.
What is the current Dow Theory status on Nifty 50 as of April 2026?
Nifty 50 is in an active Dow Theory reversal test. The all-time high of 26,373.20 was set on January 5, 2026. A lower high of 26,341.20 was set on February 3, 2026 — the first reversal condition is met. The line in the sand is the February 28, 2025 weekly close low of 22,124.70. As of March 27, 2026, Nifty closed at 22,512.65 — 1.76 percent above the Dow line. A weekly close below 22,124.70 would confirm a strict Dow Theory primary trend reversal on Nifty 50. Bank Nifty has not confirmed — its March 2026 low of 51,323 still holds above the November 2024 swing low of 49,787.
Should beginners study Dow Theory before indicators like RSI or MACD?
Yes. Dow Theory is the logical foundation for why RSI, MACD, and every other indicator work. Studying indicators without understanding Dow Theory is like learning to drive without understanding that roads exist. Beginners should read this article first, then move on to indicator-specific content. Every indicator measures something Dow already described qualitatively — trends, volume, phases, reversals. The framework gives context to the numbers the indicators produce.
Disclaimer: Trading involves substantial risk. Past performance does not guarantee future results. The examples and analysis in this article are for educational purposes only and should not be construed as investment advice. Consult a SEBI-registered advisor before making investment decisions.
Dow Theory is the grammar of technical analysis. Everything else is vocabulary. Per the SEBI FY24-25 study, 91 percent of individual equity F&O traders lost money — most from trading trends they had not confirmed.