The morning star and evening star are three-candle reversal patterns that rank among the most reliable in candlestick analysis. Independent pattern research ranks the These three-candle patterns tend to be more reliable than two-candle patterns because they tell a more complete reversal story: trend confirmation, exhaustion, and reversal confirmation across three sessions of evidence.
But geometric patterns are not the same as valid signals. Our audit of 282 NSE stocks found only14 of 386 geometric morning stars (3.6%) and14 of 329 geometric evening stars (4.3%) passed a strict 4-criterion reversal test. This article uses those verified examples.

Chart window: Jul 2022–Dec 2022 · Data refreshed April 17, 2026 · Source: NSE (daily OHLC)
Key Takeaways
- Morning star and evening star are three-candle reversal patterns. The middle candle (the “star”) represents indecision between the prior trend and the reversal.
- our audit confirms morning stars that pass the 4-criterion test are genuinely rare.
- Our NSE audit: only 14 of 386 geometric morning stars (3.6%) passed the 4-criterion test. Most are mid-trend noise.
- C3 (confirmation candle) MUST close past C1 midpoint. The further past, the stronger the reversal signal.
- Indian markets: NSE pre-market auction absorbs most overnight gaps, so accept “body separation” as valid when C2 body is tiny.
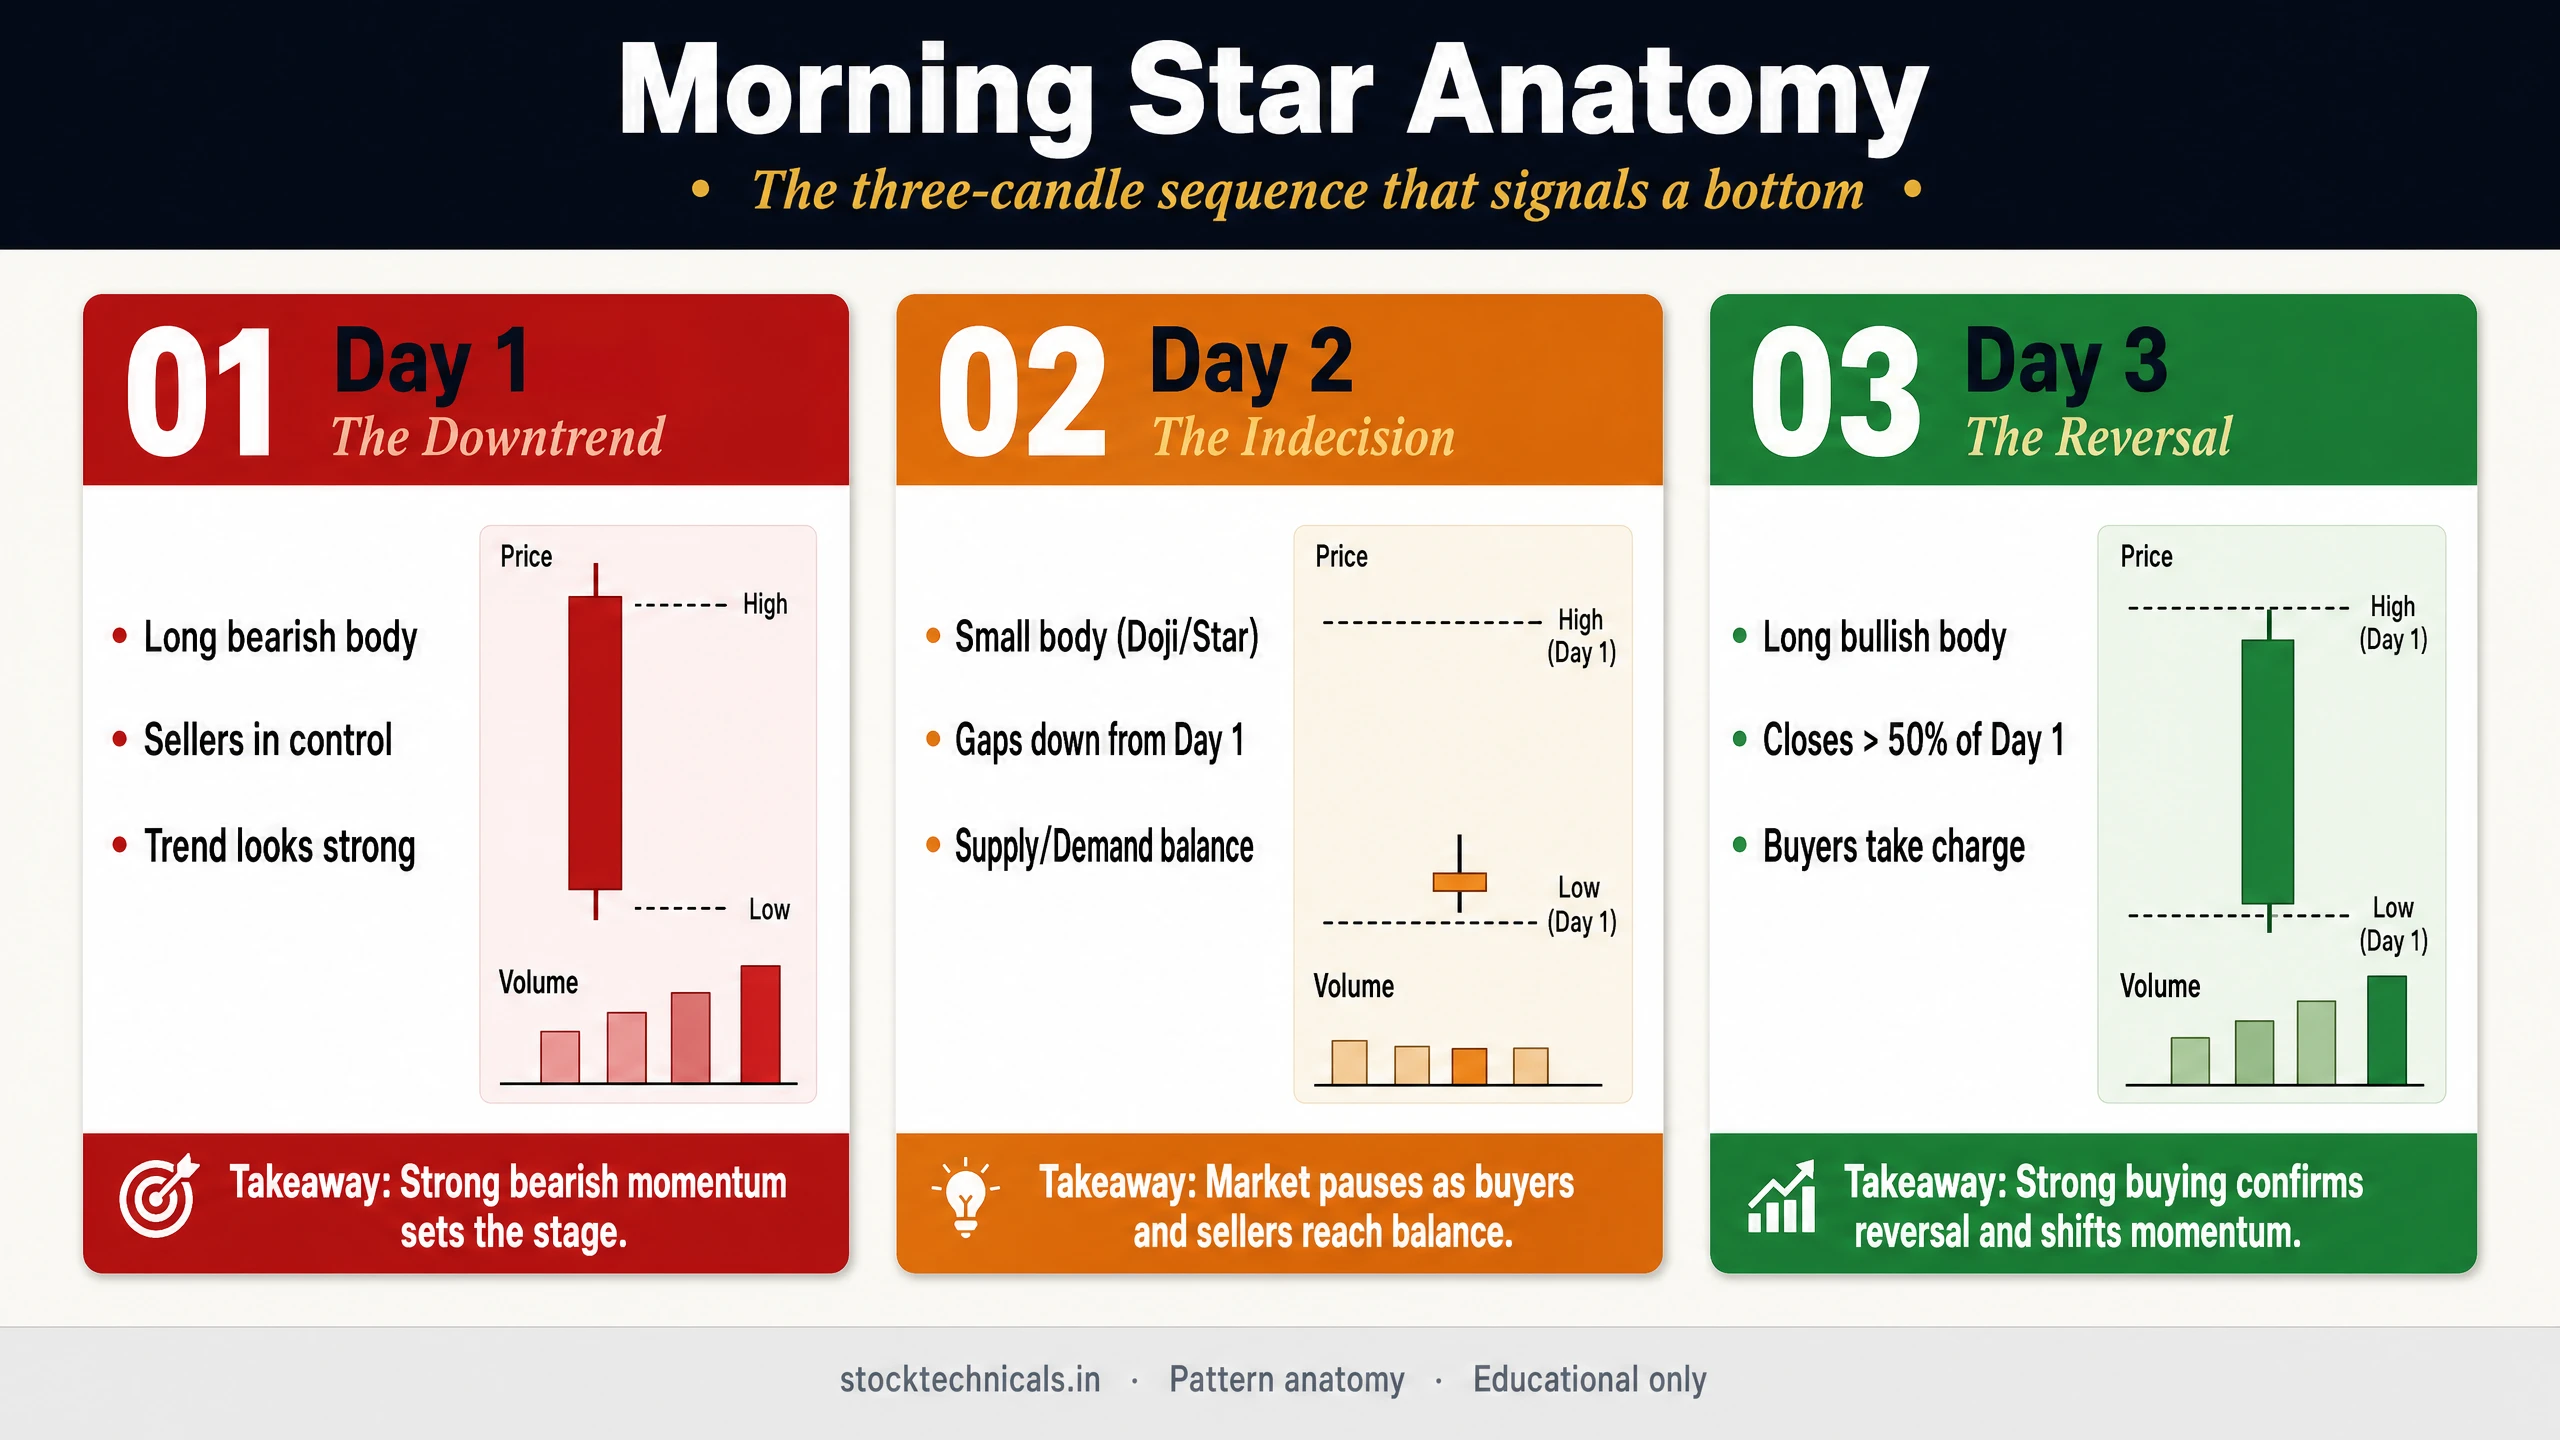
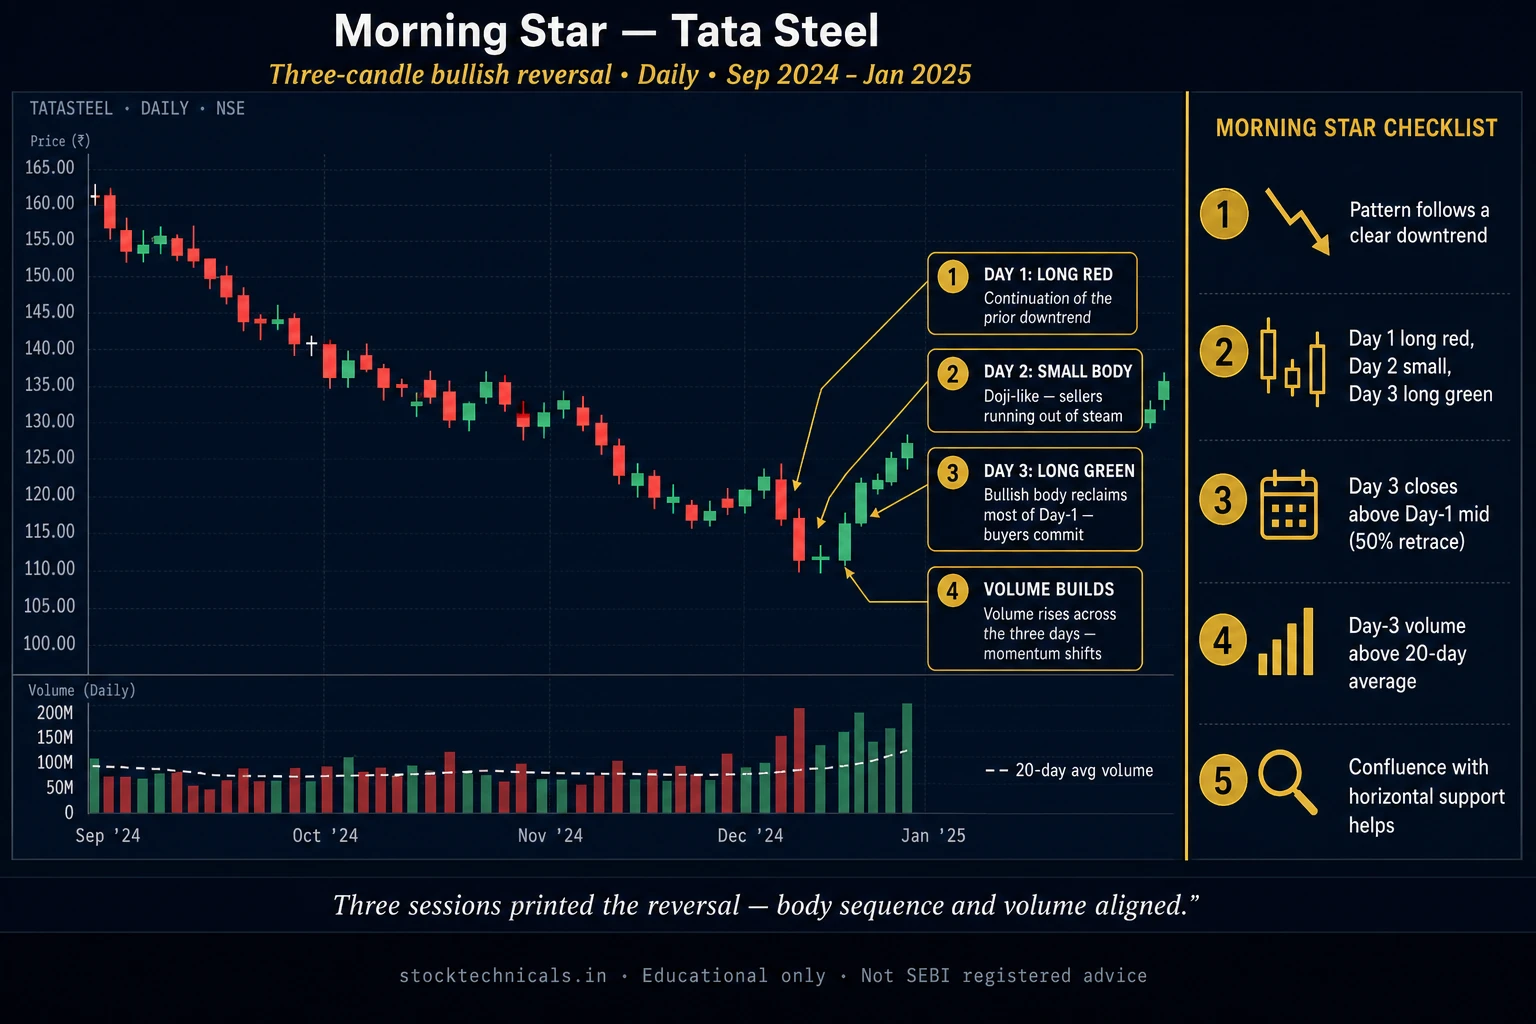
Morning Star Pattern: Three-Candle Bullish Reversal
A morning star appears at the bottom of a downtrend and tells a complete reversal story across three candles. Each candle has a specific role.
Candle One: The Trend Confirmer
A large red candle that confirms the existing downtrend. This candle reassures bears and traps latecomers. The stronger the downtrend at this point, the more dramatic the subsequent reversal.
Candle Two: The Star (Indecision)
A small-bodied candle — ideally adoji or spinning top — that gaps down from C1’s close. The small body signals that selling pressure has dried up but buyers have not yet taken control. In Indian markets, the gap is often absent because NSE pre-market auctions absorb overnight moves — a tiny body with body separation from C1 is an acceptable substitute.
Candle Three: The Confirmation
A large green candle that closes above C1’s midpoint. This is the reversal confirmation: buyers have taken control, pushed through the indecision zone, and reclaimed territory lost by bears. The further C3 closes above C1 midpoint, the stronger the signal. Heavy volume on C3 adds conviction.
Morning Star Examples
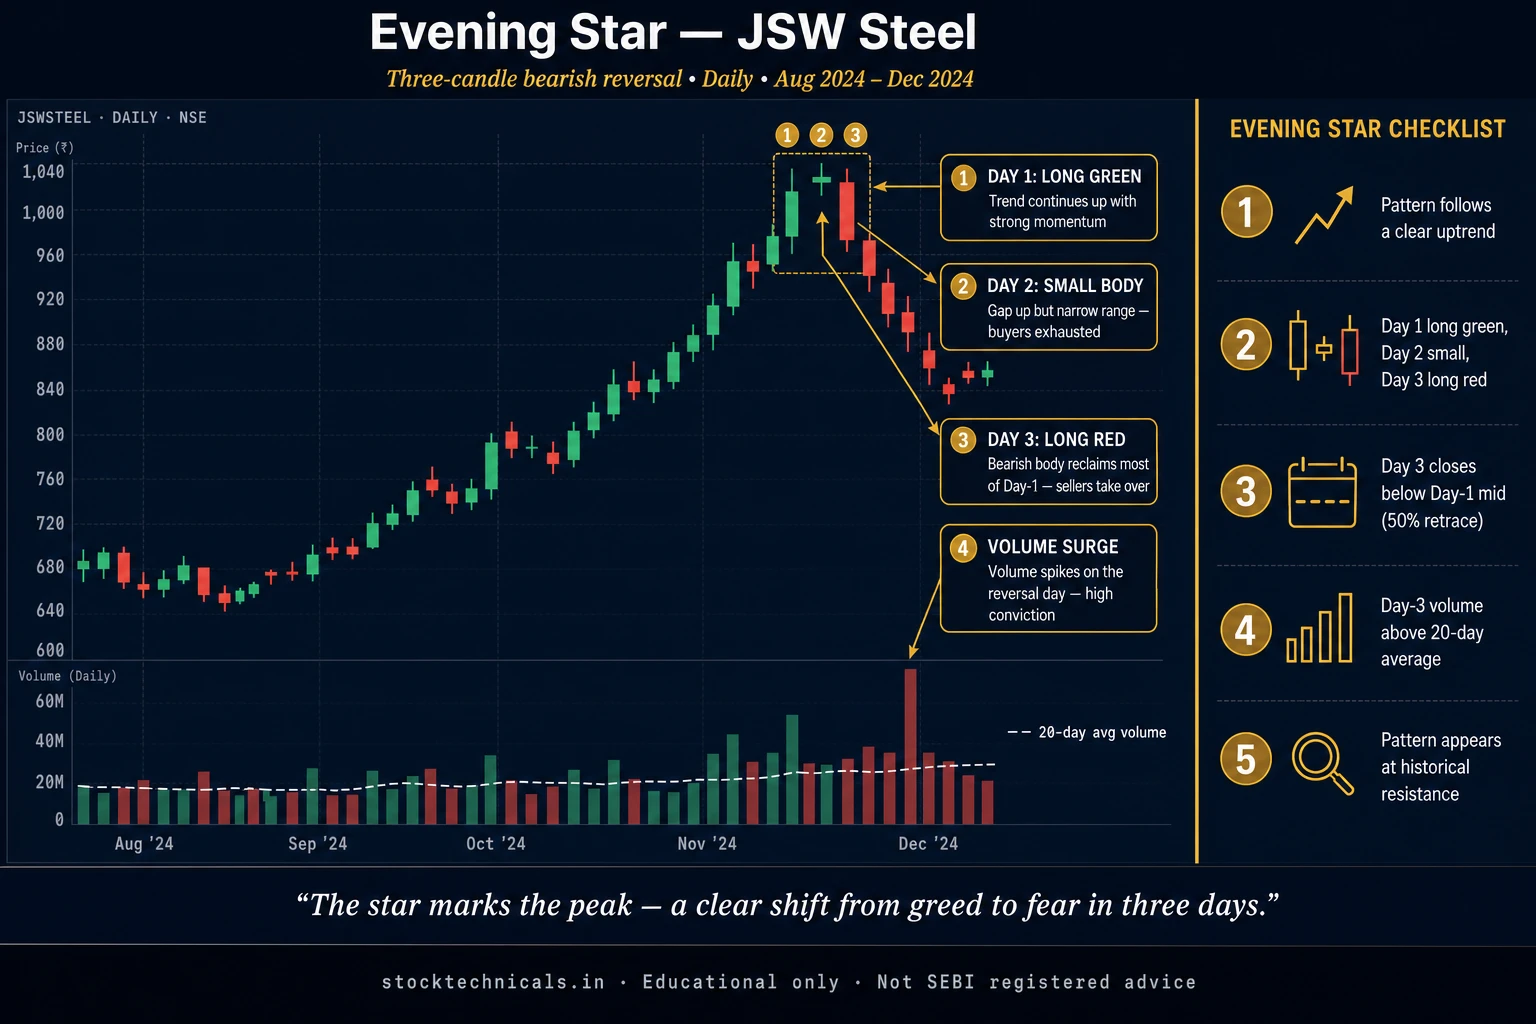
Evening Star Pattern: Mirror at the Top
Not every valid evening star has a dramatic follow-through. UltraTech Cement (NSE: ULTRACEMCO) on 12-February 14, 2025 showed a 7.3% rally reversed by an evening star with only a -5.0% 20-day decline. Valid pattern, modest result. Over large sample sizes, this is typical — expect the full distribution of outcomes, not only the dramatic ones.
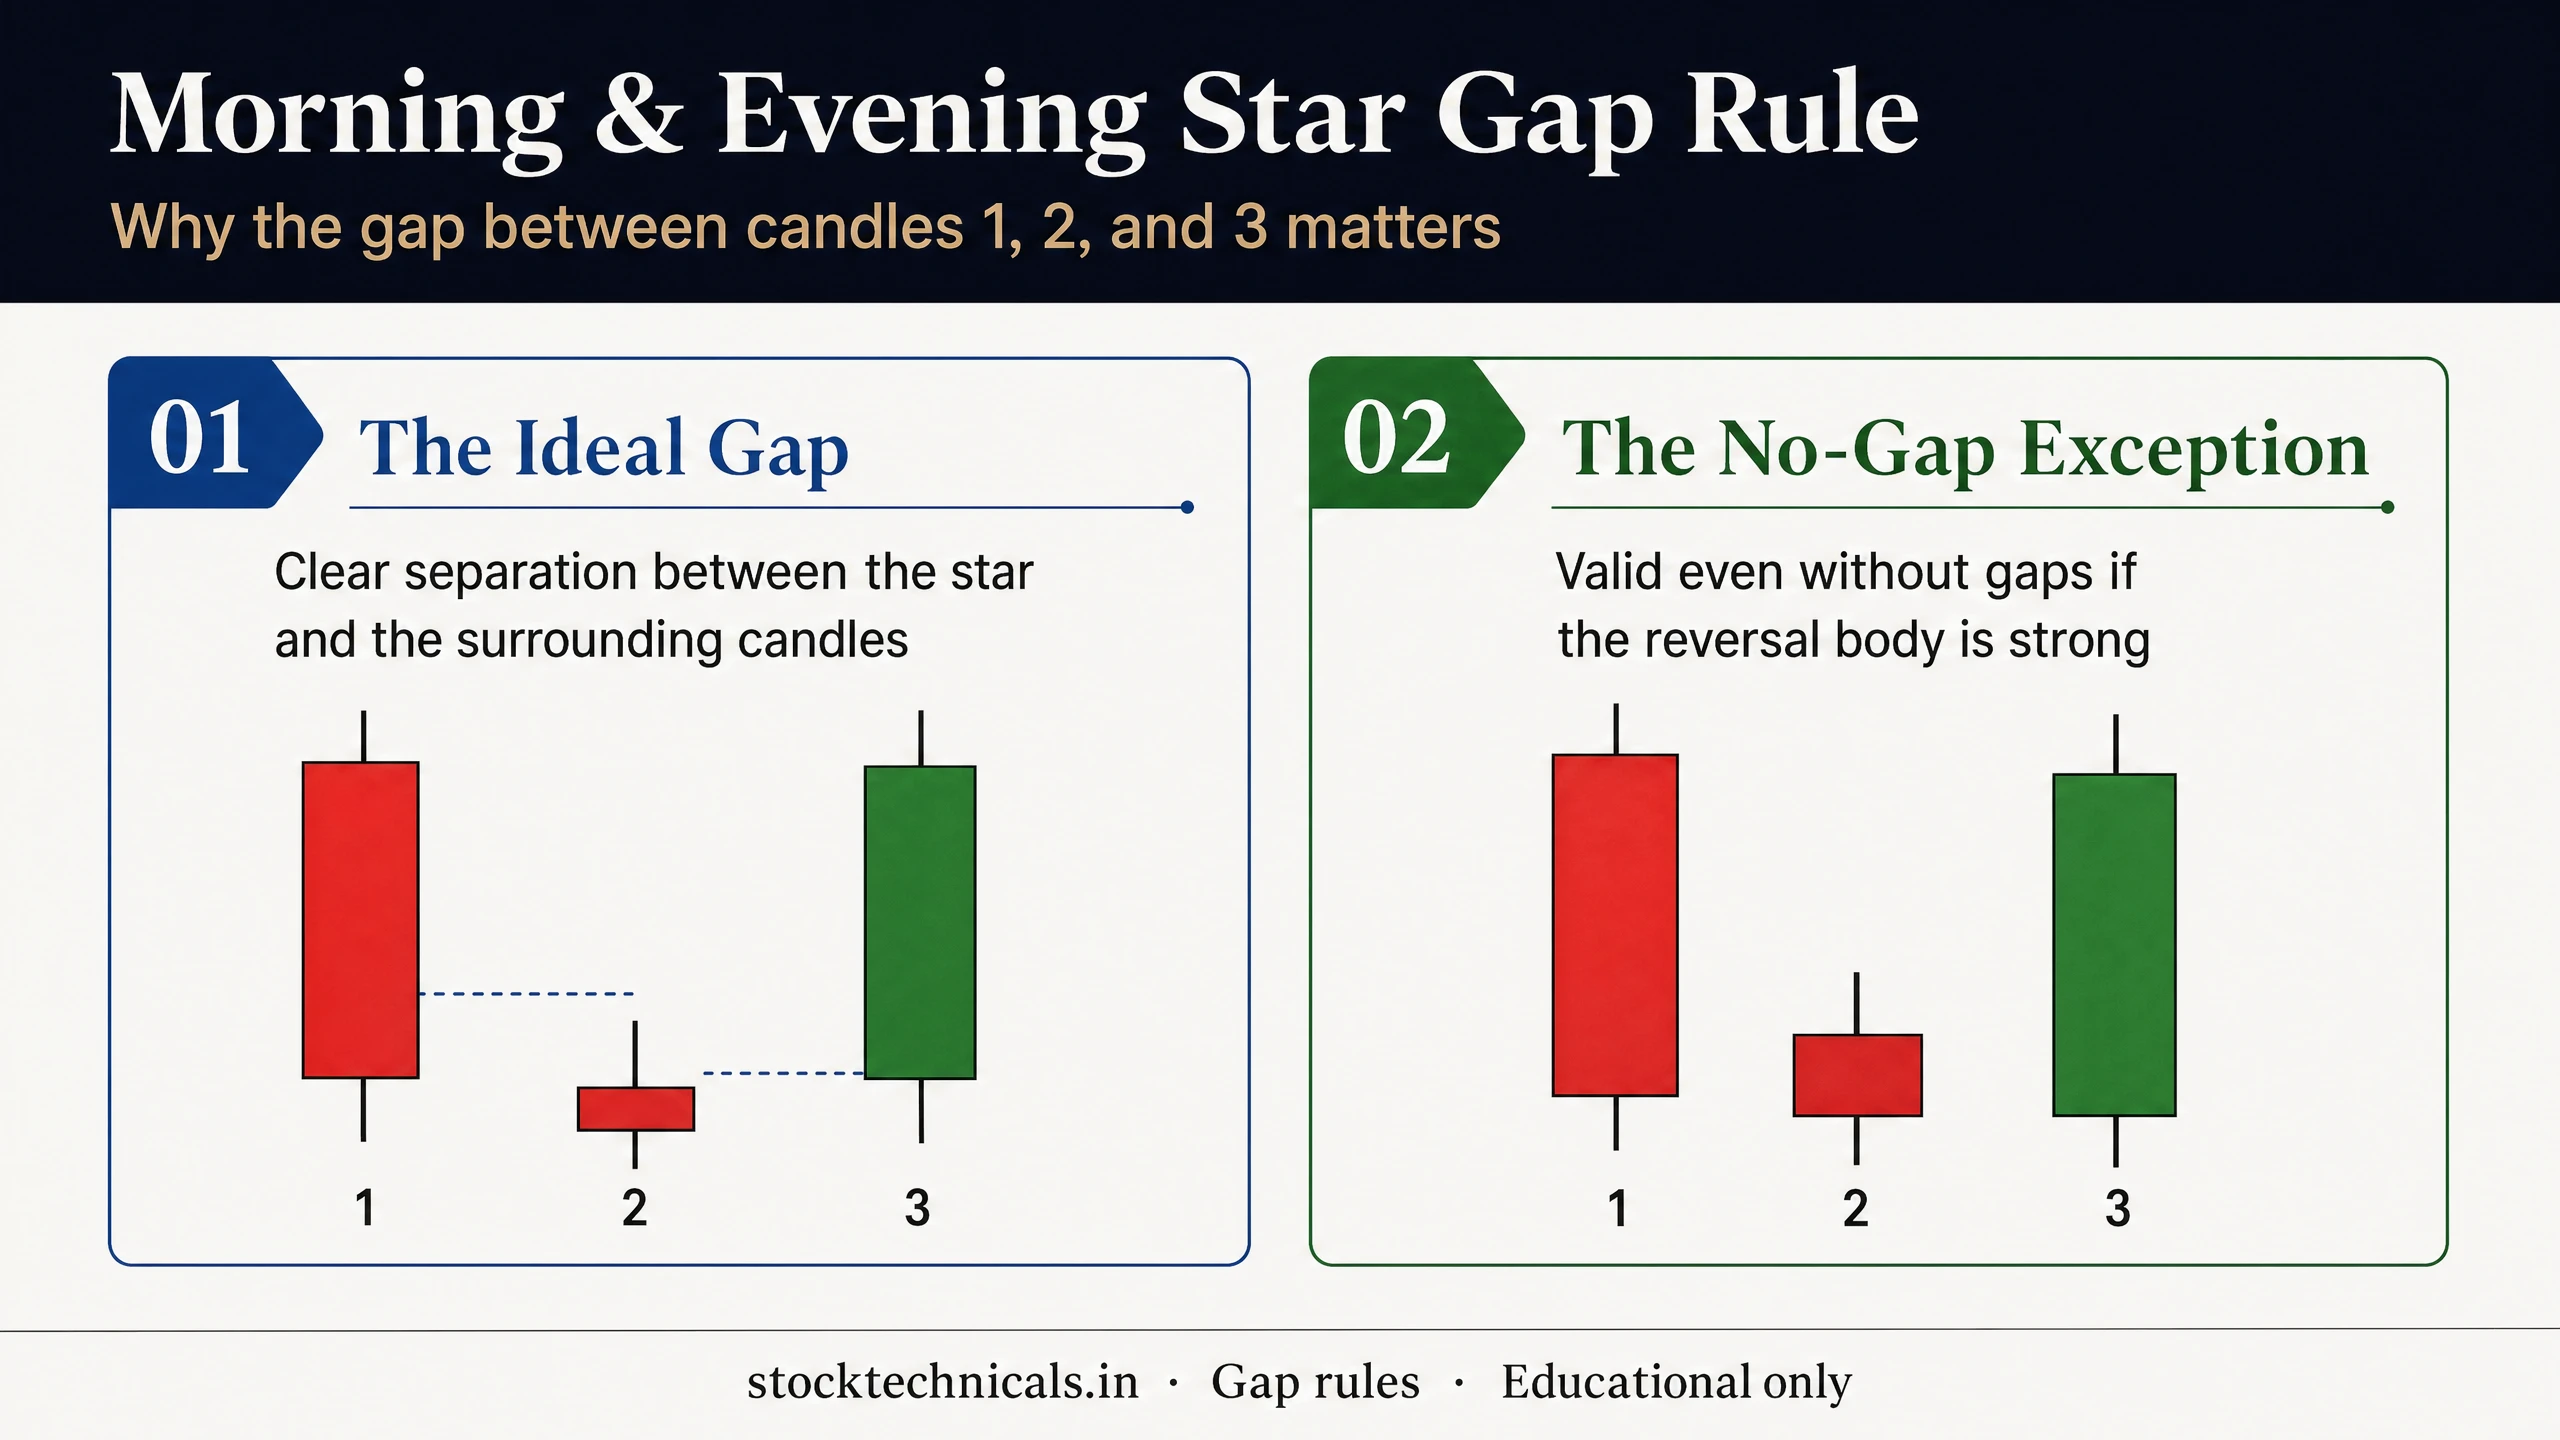
The Gap Rule
Traditional candlestick textbooks (most written for US markets) insist on gaps between C1 and C2 and between C2 and C3. In Indian markets, this rule must be relaxed. NSE’s pre-market auction (9:00–9:07 AM) absorbs most overnight price changes, reducing gap frequency on daily charts. In practice, most Indian star patterns show “body separation” (C2 body does not overlap C1 body, though wicks may) rather than true gaps. This is acceptable as long as C2’s body is tiny and C3 provides strong confirmation.
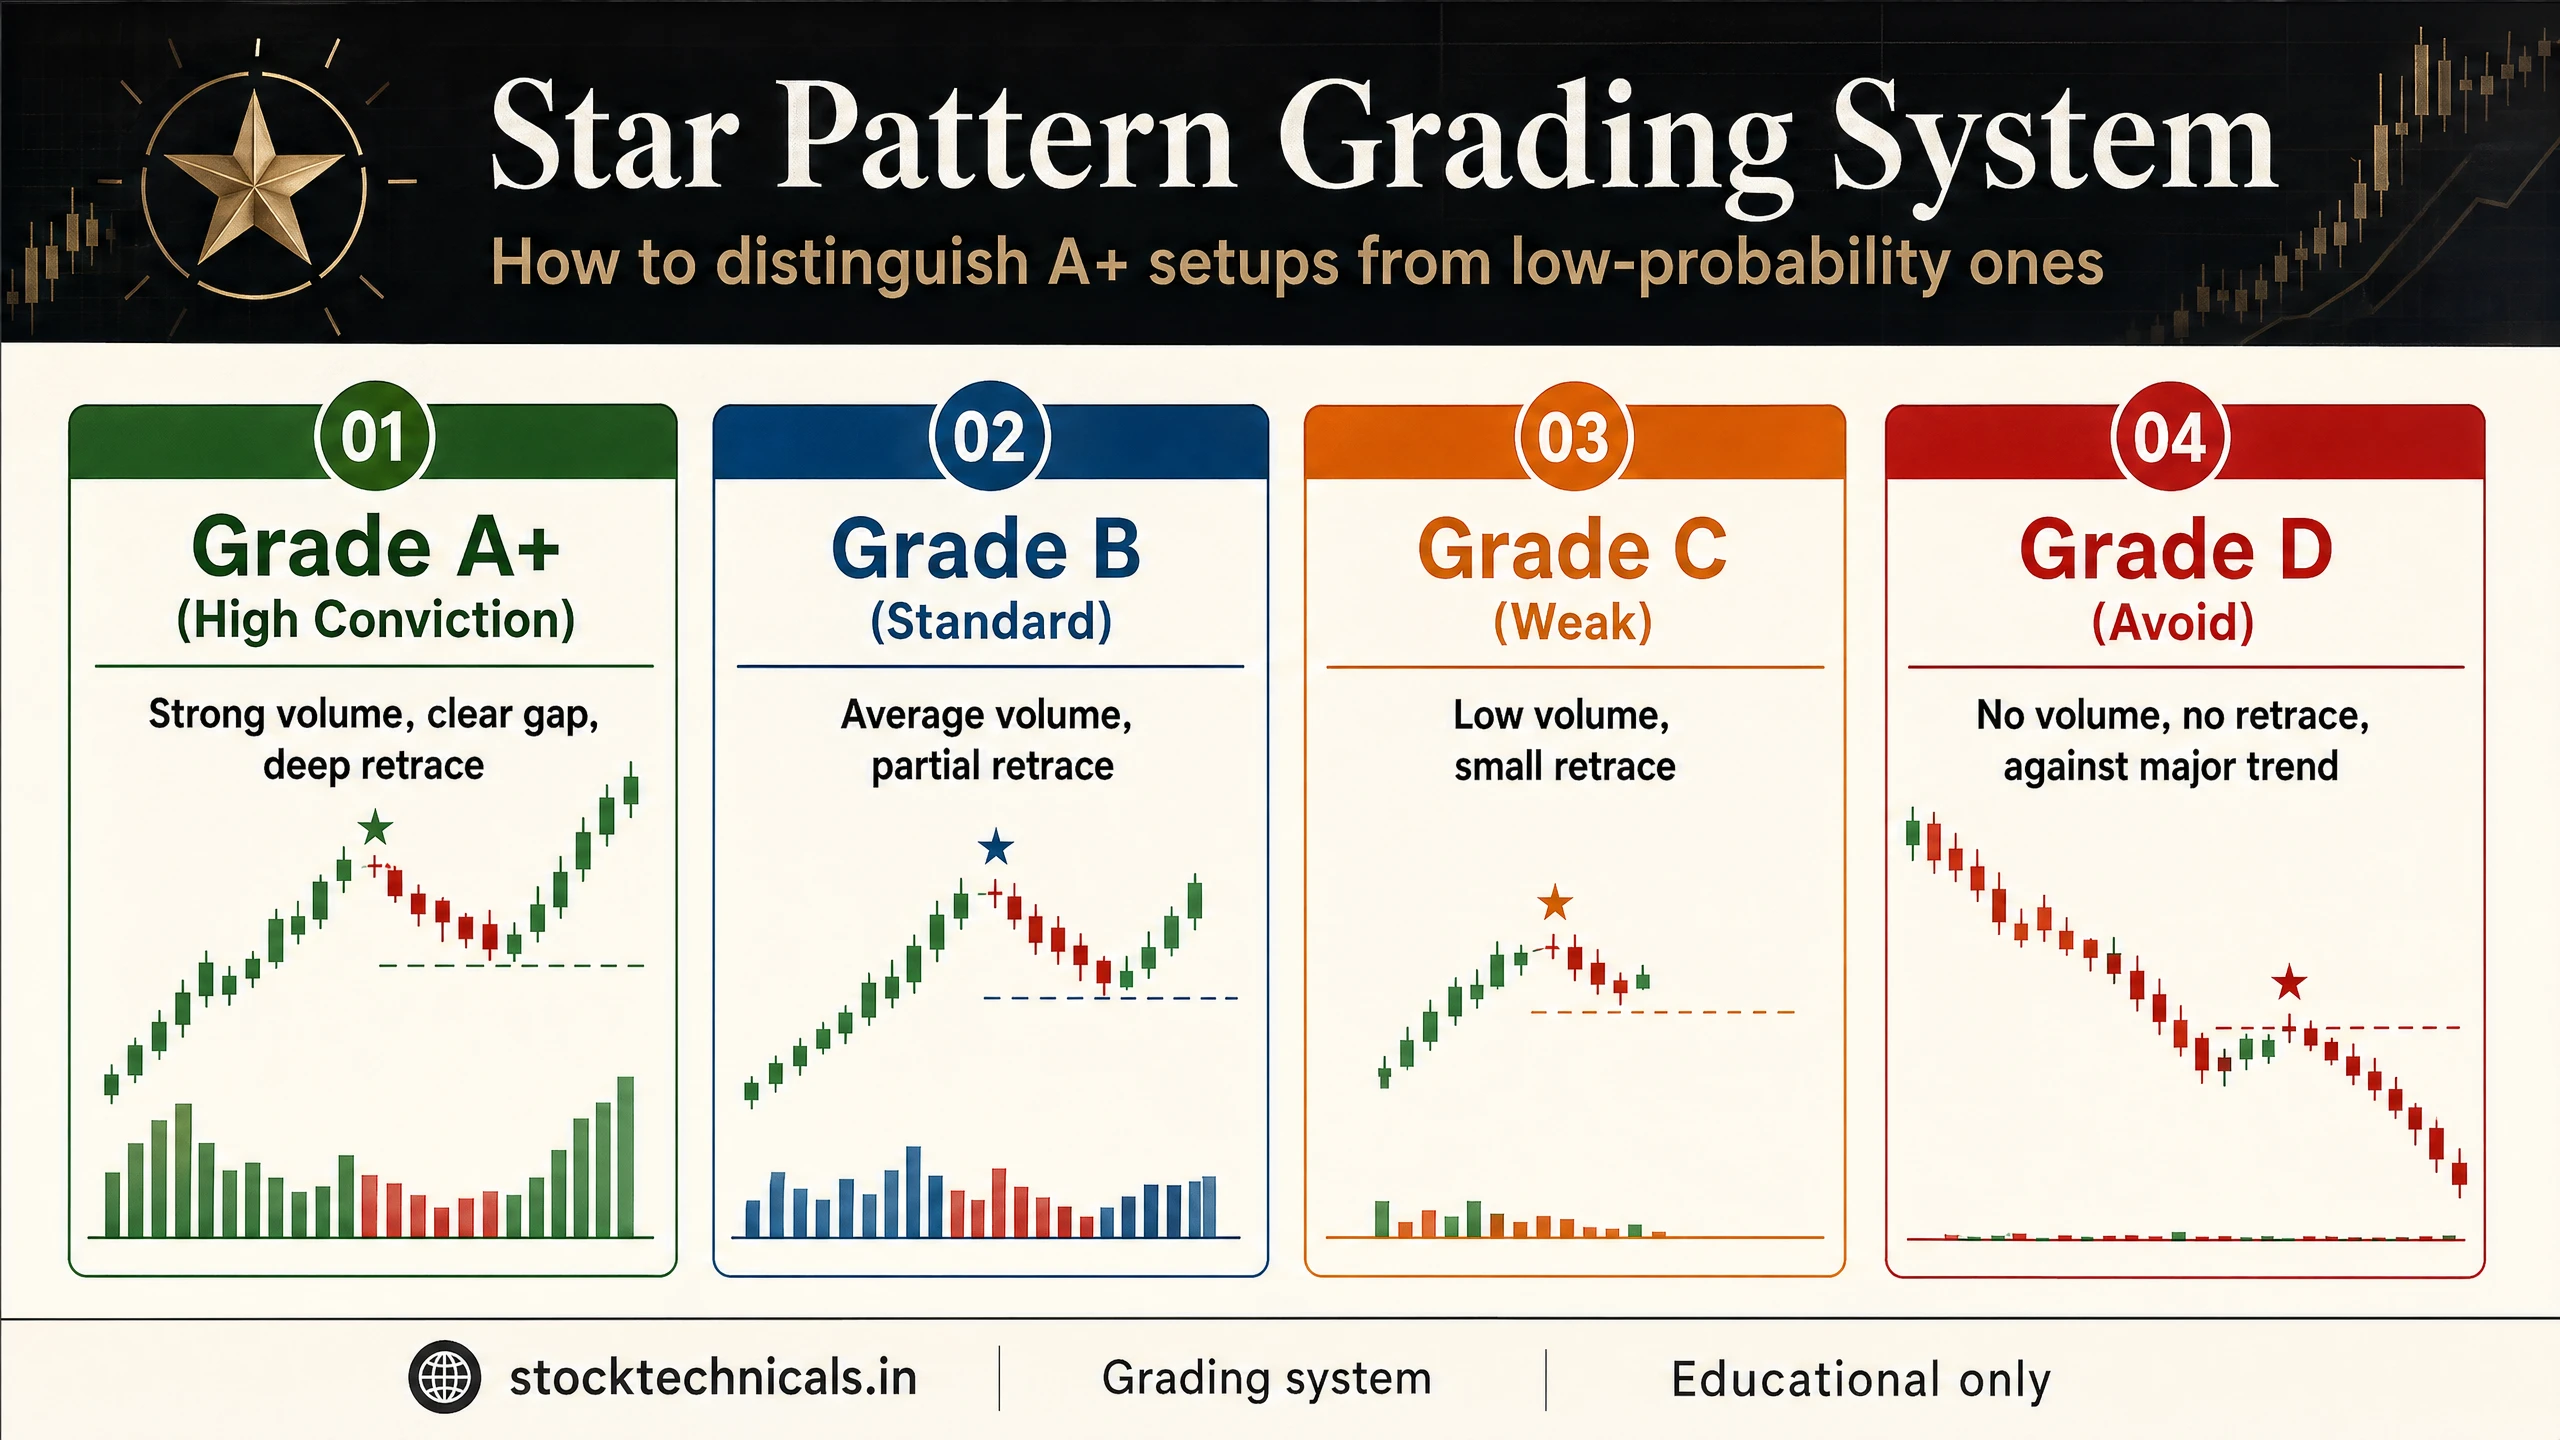
Quality Grading System
Use this six-factor grading system to evaluate every star pattern before trading:
A+ (full size, 1% account risk): Prior trend 10+ candles, clear gap/body separation, C2 body <30% of C1, C3 closes past C1 open, volume on C3 >1.5x average, at key S/R level. Example: AXISBANK Sep 2022 (+18.9%).
A (standard size, 0.75%): 5-9 candle trend, body separation, C2 body <30% C1, C3 past midpoint, volume 1.0-1.5x, near S/R. Example: NESTLEIND Sep 2024 (-15.7%).
B (reduced size, 0.5%): Weaker trend (3-4 candles), weaker confirmation, at-average volume. Example: ULTRACEMCO Feb 2025 (-5.0%).
C (skip): Sideways context, C2 body >50% of C1, C3 fails to reach C1 midpoint, below-average volume. These are the 96% that fail the audit.
Star Patterns on Different Timeframes
Daily (The Standard)
All examples in this article use daily charts. Daily is the sweet spot for swing traders — 3-day patterns with 5-20 day hold periods. Even high-quality morning stars is based on daily chart data.
Weekly (Most Powerful)
Weekly star patterns are rare but highly reliable. A weekly morning star represents three full weeks of market structure. When it forms near a 40-week SMA (weekly equivalent of 200-day SMA), it can mark major cyclical turns lasting months.
Intraday and F&O Context
On 15-minute and hourly charts, star patterns occur much more frequently but are noisier. For NSE F&O weekly instruments (now expiring Tuesday per SEBI rule change of September 1, 2025), evening star formations on the Monday or Tuesday morning session can trigger major position unwinding if they appear near key strikes.
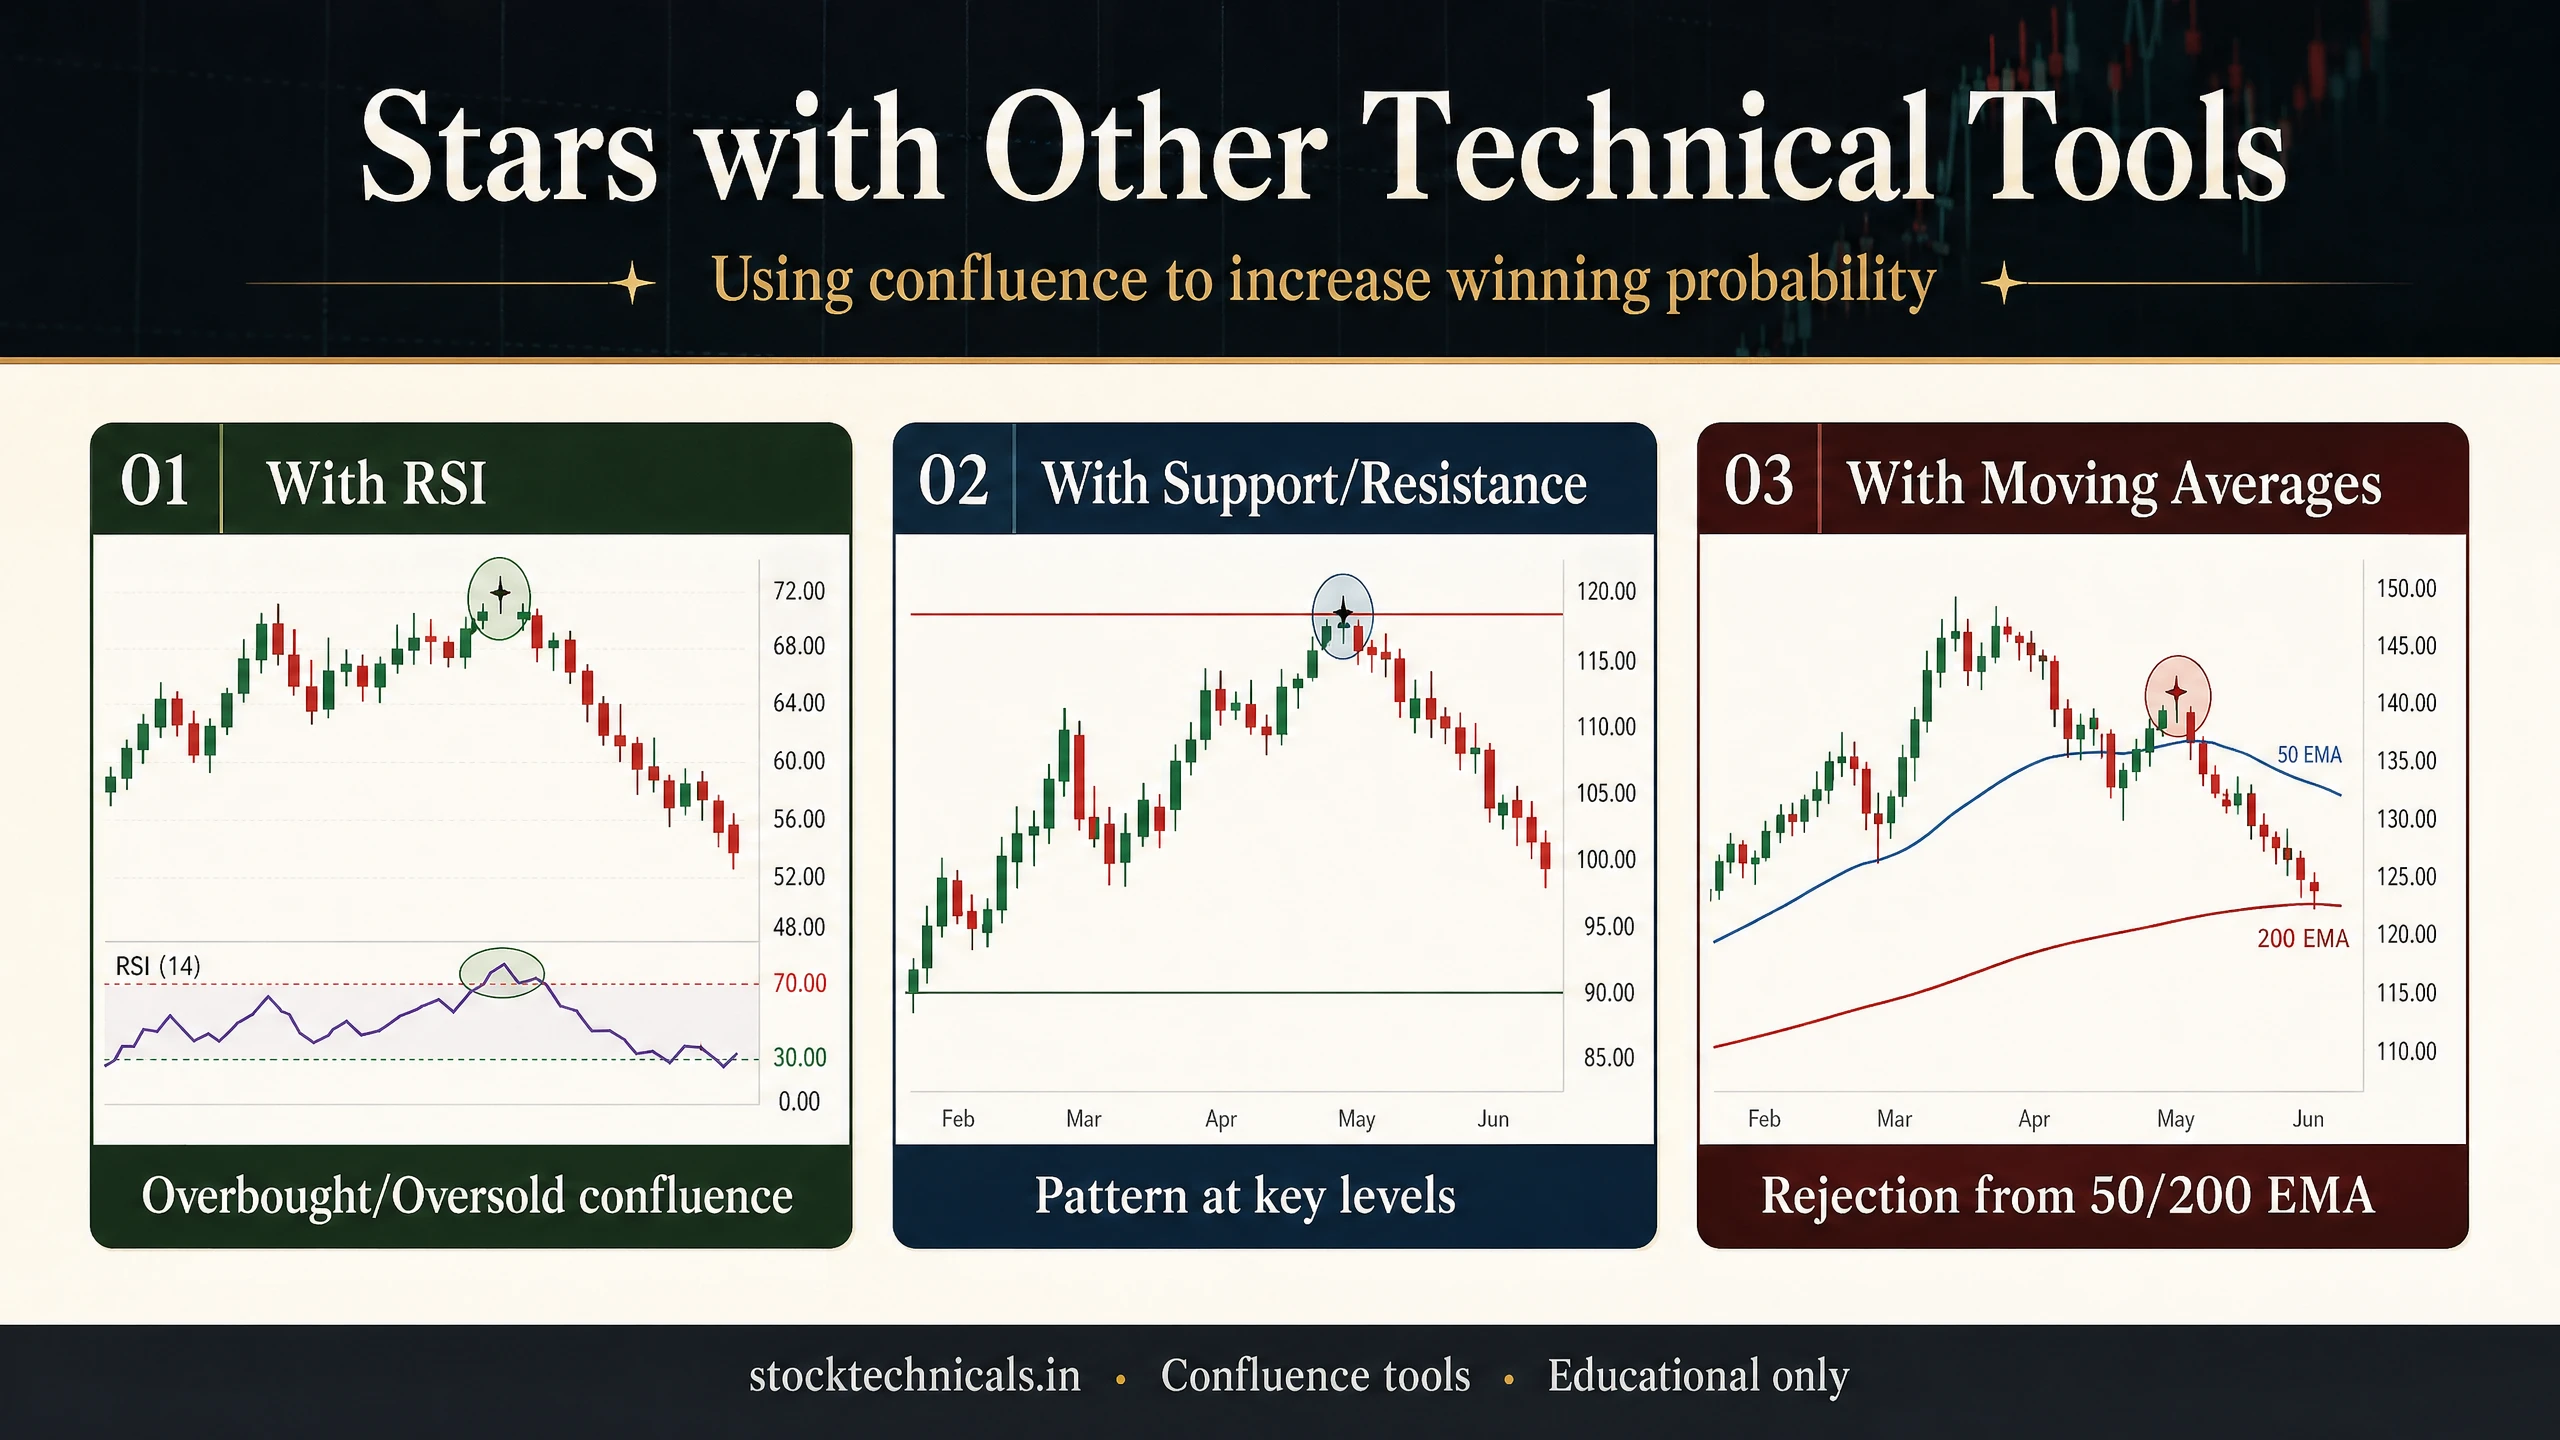
Combining Stars with Other Tools
Moving Averages
A morning star forming near the20-day EMA or50-day SMA in a primary uptrend is a pullback-reversal signal. An evening star breaking below the 20-day EMA adds trend-change confirmation.
RSI Divergence
WhenRSI shows bullish divergence (price lower low, RSI higher low) AND a morning star forms at the same level, the two signals reinforce each other. This is one of the highest-probability setups in technical analysis.
Support and Resistance
A morning star at a knownsupport zone, or an evening star at major resistance, adds structural confluence. When pattern + level + volume all agree, the probability jumps significantly above the baseline 78%.
Common Mistakes
Mistake: Demanding Perfect Gaps
If you only trade star patterns with textbook gaps, you will miss most opportunities in NSE stocks. Accept body separation as the Indian equivalent of a gap.
Mistake: Ignoring C3 Midpoint Rule
C3 MUST close past C1’s midpoint. A green C3 that closes below midpoint is NOT a valid morning star confirmation — it is a weak bounce within a larger decline.
Mistake: Trading Stars in Sideways Markets
Star patterns are reversal signals. They require a prior trend to reverse. Without a trend, a three-candle formation in a range is noise. Always verify the prior trend is at least 5 candles long.
Mistake: Entering Without C3 Confirmation
Some traders enter on the assumption that C3 will confirm — before it closes. Do not. Let C3 close and confirm its position past C1 midpoint before entering. The intraday swings during C3’s session can be violent.
Complete Trading Plan
Entry Rules
Conservative: Enter on Day 4 open if it confirms direction (above C3 close for morning star, below for evening star).Aggressive: Enter at C3 close.
Stop Loss
Below C2 low for morning star, above C2 high for evening star. Alternative: below/above C1 extreme for a wider stop. If price breaches the pattern extreme, the reversal has failed.
Target
Next support/resistance level. Minimum 2:1 risk-reward ratio. Trail stop to break-even at 1:1 profit. Scale out partial profits at key technical levels.
Interactive Tool
Star Pattern Identifier
Describe three candles and find out if they form a valid morning star, evening star, or neither
Q1: A morning star requires how many candles?
Q2: In an evening star, what should C3 (the third candle) do?
Q3: Why are gaps less common in Indian stock markets?
Q4: GRASIM shows a morning star (Jan 2025) AND an evening star (Dec 2024). What does this prove?
Q5: Hindalco shows a textbook evening star but price rallied +6.12%. What is the lesson?
Educational tool only. Not investment advice. Always verify patterns against your own analysis and risk management rules.
The Bottom Line About Morning Star and Evening Star
Morning star and evening star are among the most reliable candlestick patterns — both are among the more reliable three-candle patterns when properly selected. But reliability is conditional. Only patterns at proper trend extremes, with small C2 bodies and strong C3 confirmation, qualify as true reversal signals. The rest (96% of geometric matches in our NSE audit) are noise.
Adapt the gap rule for Indian markets. Grade every setup against the six-factor framework. Size positions based on grade, not hope. And always remember: even 78% success means 22% failure — a strategy without stops is not a strategy, it is gambling.
SEBI data shows 91% of individual F&O traders lose money. The difference between the 9% who do not and the 91% who do is rarely pattern selection — it is discipline, position sizing, and systematic stop-loss placement.
Frequently Asked Questions
| Pattern | Candle 1 | Candle 2 (star) | Candle 3 | Direction |
|---|---|---|---|---|
| Morning Star | Long red | Small body (any colour) | Long green | Bullish reversal |
| Evening Star | Long green | Small body (any colour) | Long red | Bearish reversal |
| Morning Doji Star | Long red | Doji | Long green | Strong bullish reversal |
| Evening Doji Star | Long green | Doji | Long red | Strong bearish reversal |
What is the actual success rate of the morning star pattern?
Our NSE audit across 282 stocks found only 14 of 386 geometric morning stars (3.6 percent) and 14 of 329 evening stars (4.3 percent) passed the full 4-criterion test. The patterns work — but only when selection is rigorous. Mid-trend lookalikes fail consistently.
Does the star candle need to be a doji?
A doji is ideal but not required. Any small-body candle with body less than 30 percent of C1 body qualifies as the star. The key is that the body is small enough to signal indecision between buyers and sellers.
Are gaps mandatory for star patterns in Indian markets?
No. NSE pre-market auctions absorb most overnight price changes, making clean gaps rare on Indian daily charts. Body separation (C2 body does not overlap C1 body) is an acceptable substitute. Focus on C2 body size and C3 confirmation instead of gaps.
How do I confirm a morning star before trading?
C3 must close above C1 midpoint. Additionally check volume on C3 should exceed the 20-day trailing average, the pattern should be at a known support level, and the prior downtrend should be at least 5 candles long. Wait for C3 to close before entering.
Where should I place my stop loss for a morning star trade?
Below C2 low for a tighter stop, or below C1 low for a wider stop. If price breaks below the star candle extreme, the reversal has failed and you should exit.
Can the same stock produce both morning and evening stars?
Yes. Star patterns are location-dependent, not stock-dependent. The same stock can produce morning stars at cyclical bottoms and evening stars at cyclical tops. Bank of Baroda appears in our data at both types at different dates.
Why do some valid star patterns still fail?
Broader market or sector momentum can overpower individual candle patterns. Fundamental events outside the 20-day technical window — earnings, news, scandals — can also override signals. Always check upcoming catalysts before holding through major dates.
Continue Learning
For two-candle reversals:Engulfing Patterns — simpler 2-candle reversal at 63% success rate.
For single-candle reversals:Shooting Star vs Inverted Hammer — same shape, opposite signals based on location.
For confirmation tools:RSI Basics — divergence signals that pair perfectly with star patterns.
For volume analysis:Volume in Trading — why the 1.5x trailing-average threshold matters for C3 confirmation.
Markets are unpredictable, capital is finite, and no candlestick pattern guarantees profit. Past performance does not predict future results. Always define your stop loss before entering, never risk more than you can afford to lose, and verify every setup against your own analysis.