Skip to content
stocktechnicals.in
  • Home
  • Blog
  • Learn
  • Market Pulse
  • About

stocktechnicals.in

Dow Theory: The Foundation of All Technical Analysis

11 May 202611 January 2026 by stocktechnicals.in

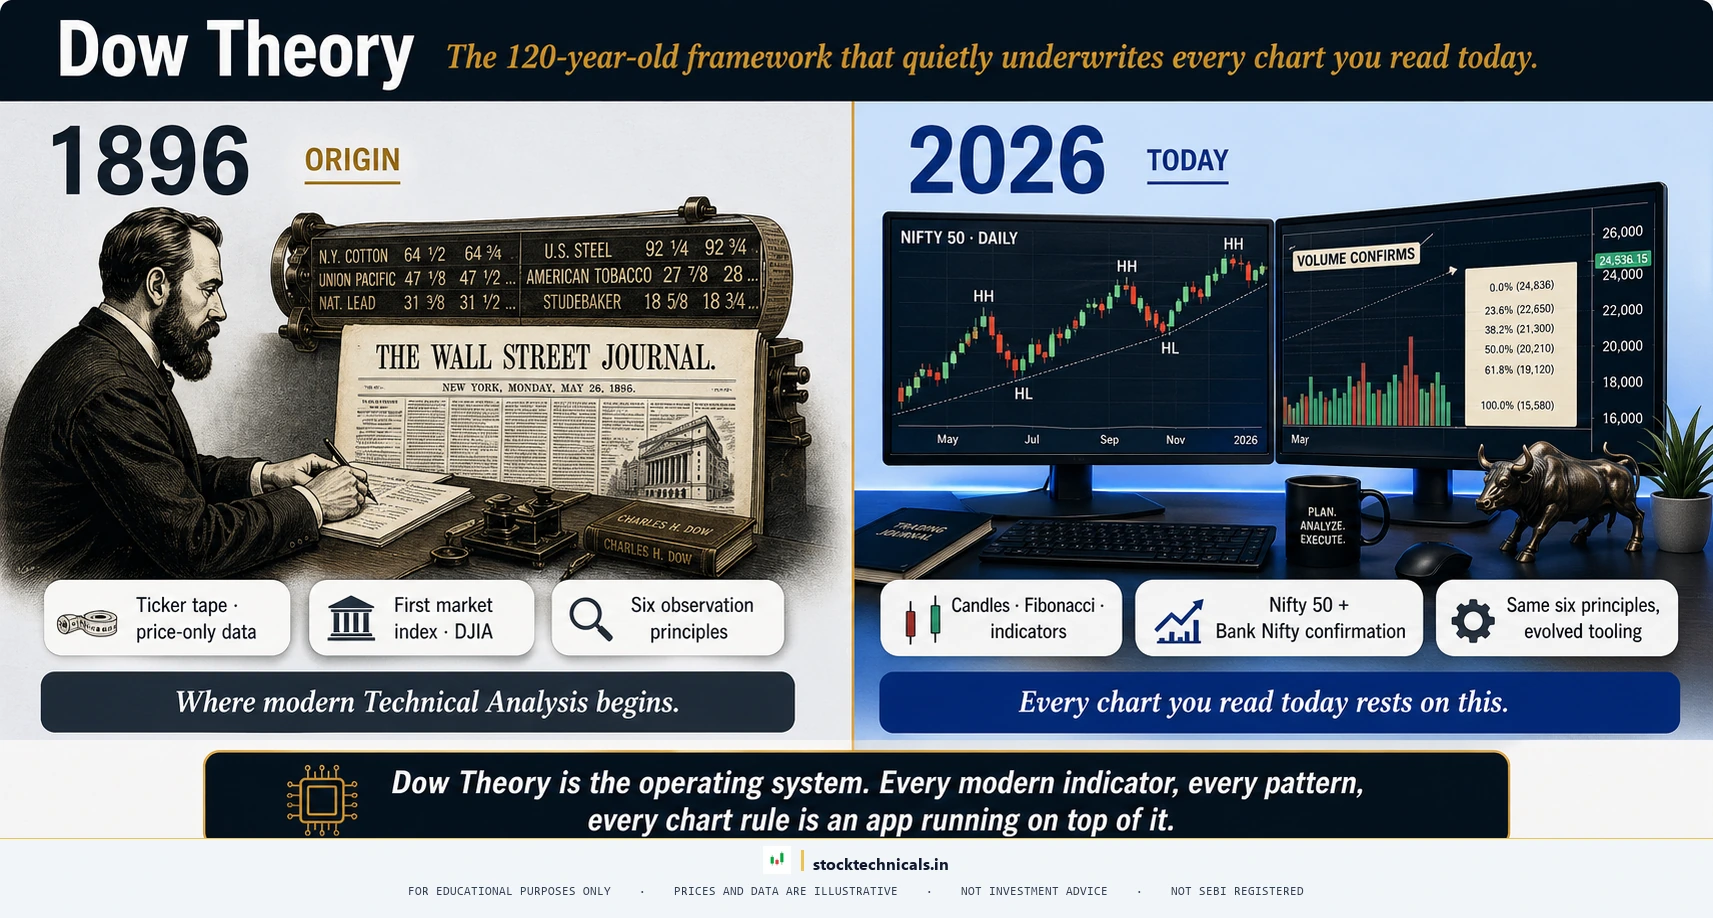
Dow Theory provides six principles that form the foundation of all technical analysis. Learn how to apply these 120-year-old principles to the Nifty 50 and Bank Nifty with real price data.

Categories Technical Analysis Leave a comment

What is a Pullback? How to Trade Pullbacks Effectively

11 May 202610 January 2026 by stocktechnicals.in

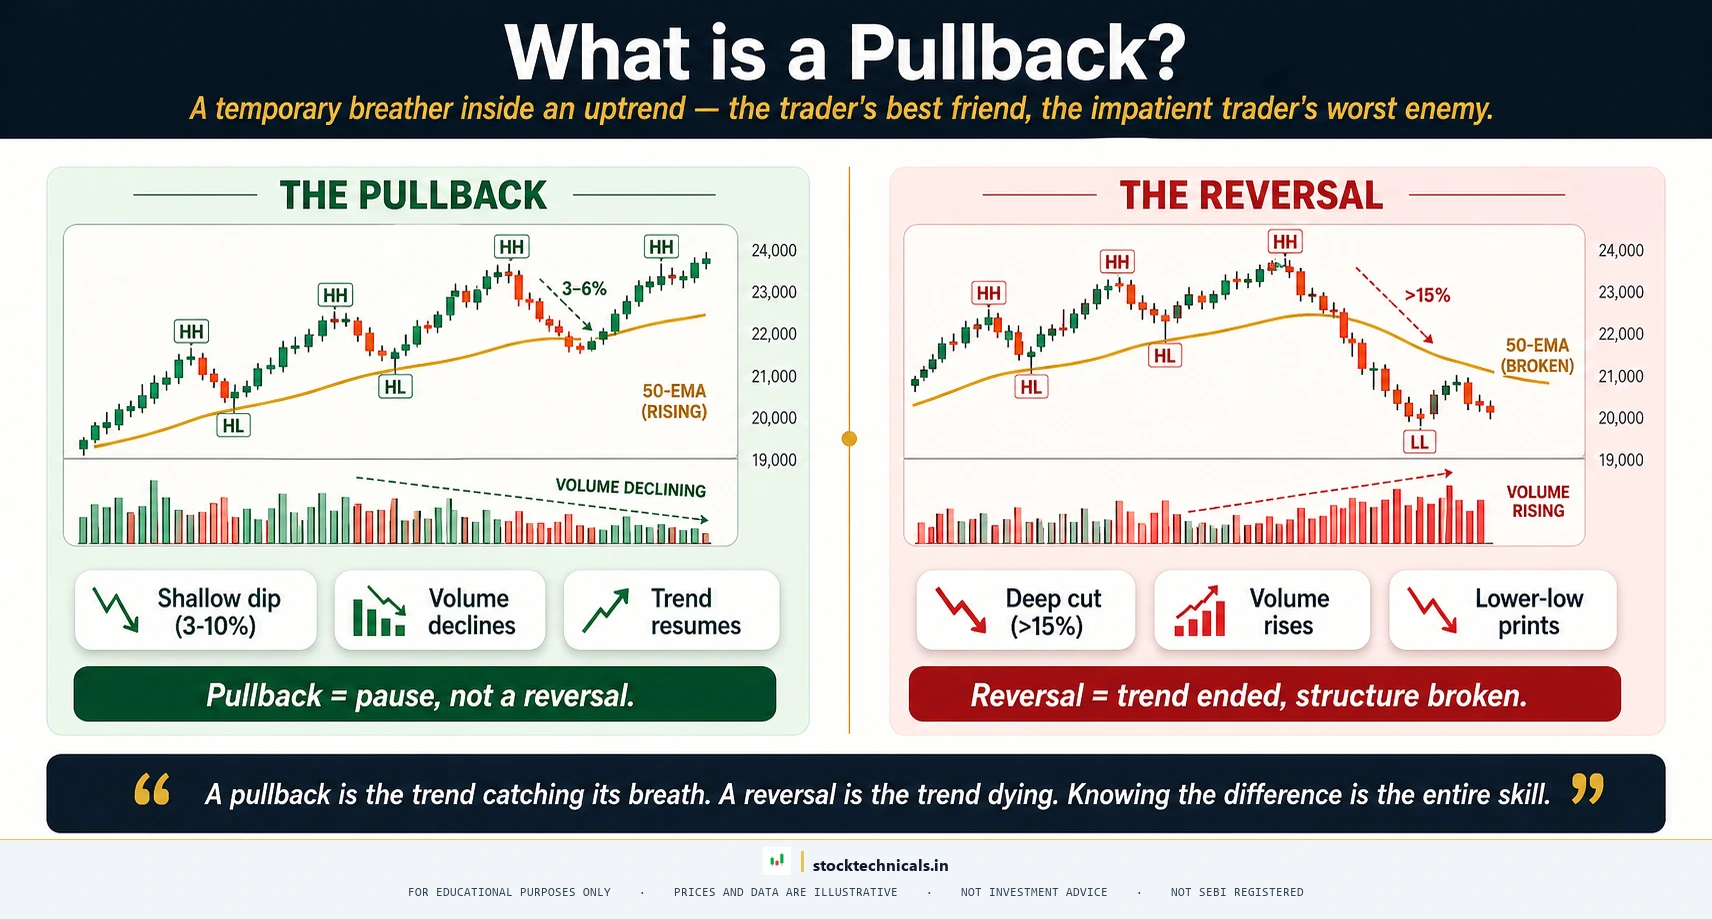
A pullback is a temporary dip within an ongoing uptrend that offers high-probability continuation entries. Learn how to identify healthy pullbacks, distinguish them from reversals, and place precise entries using real Reliance, HDFC Bank, L&T, Nifty 50, and Tata Steel examples verified against Fyers API data.

Categories Technical Analysis Leave a comment

What is a Breakout? How Volume Confirms Breakouts

11 May 20269 January 2026 by stocktechnicals.in

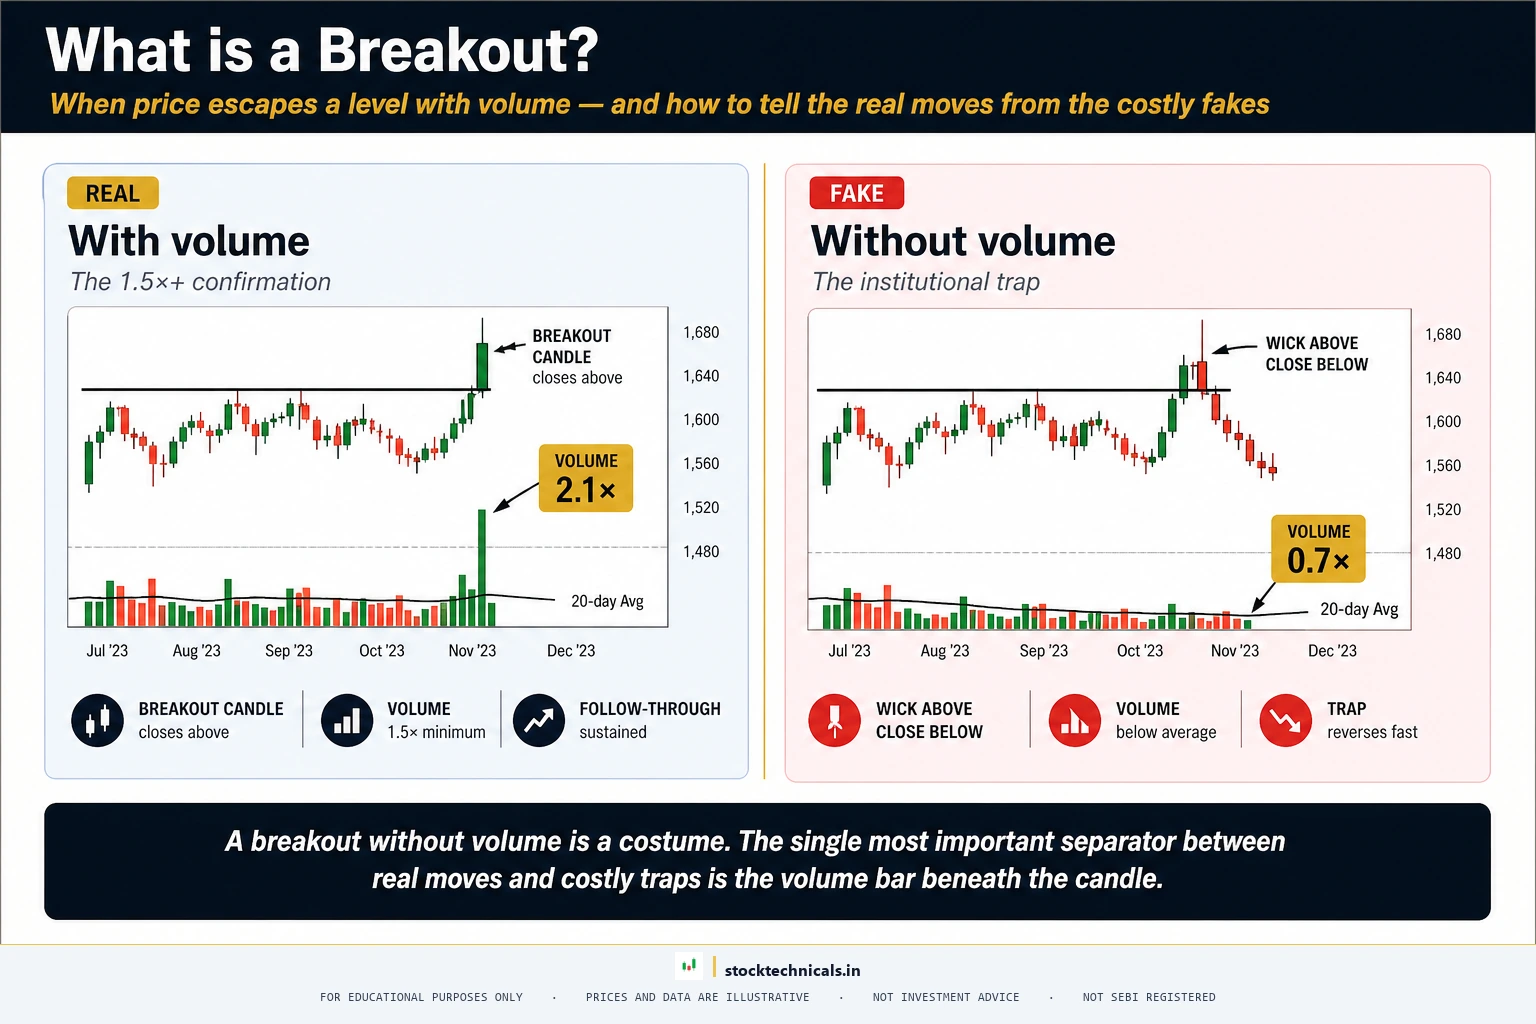
Learn how to identify real breakouts from traps using volume confirmation, candle structure, and retest entry. Real NSE examples from Reliance, Tata Steel, ITC, and Nifty 50.

Categories Technical Analysis Leave a comment

Volume in Trading: The Conviction Signal Behind Every Move

11 May 20268 January 2026 by stocktechnicals.in

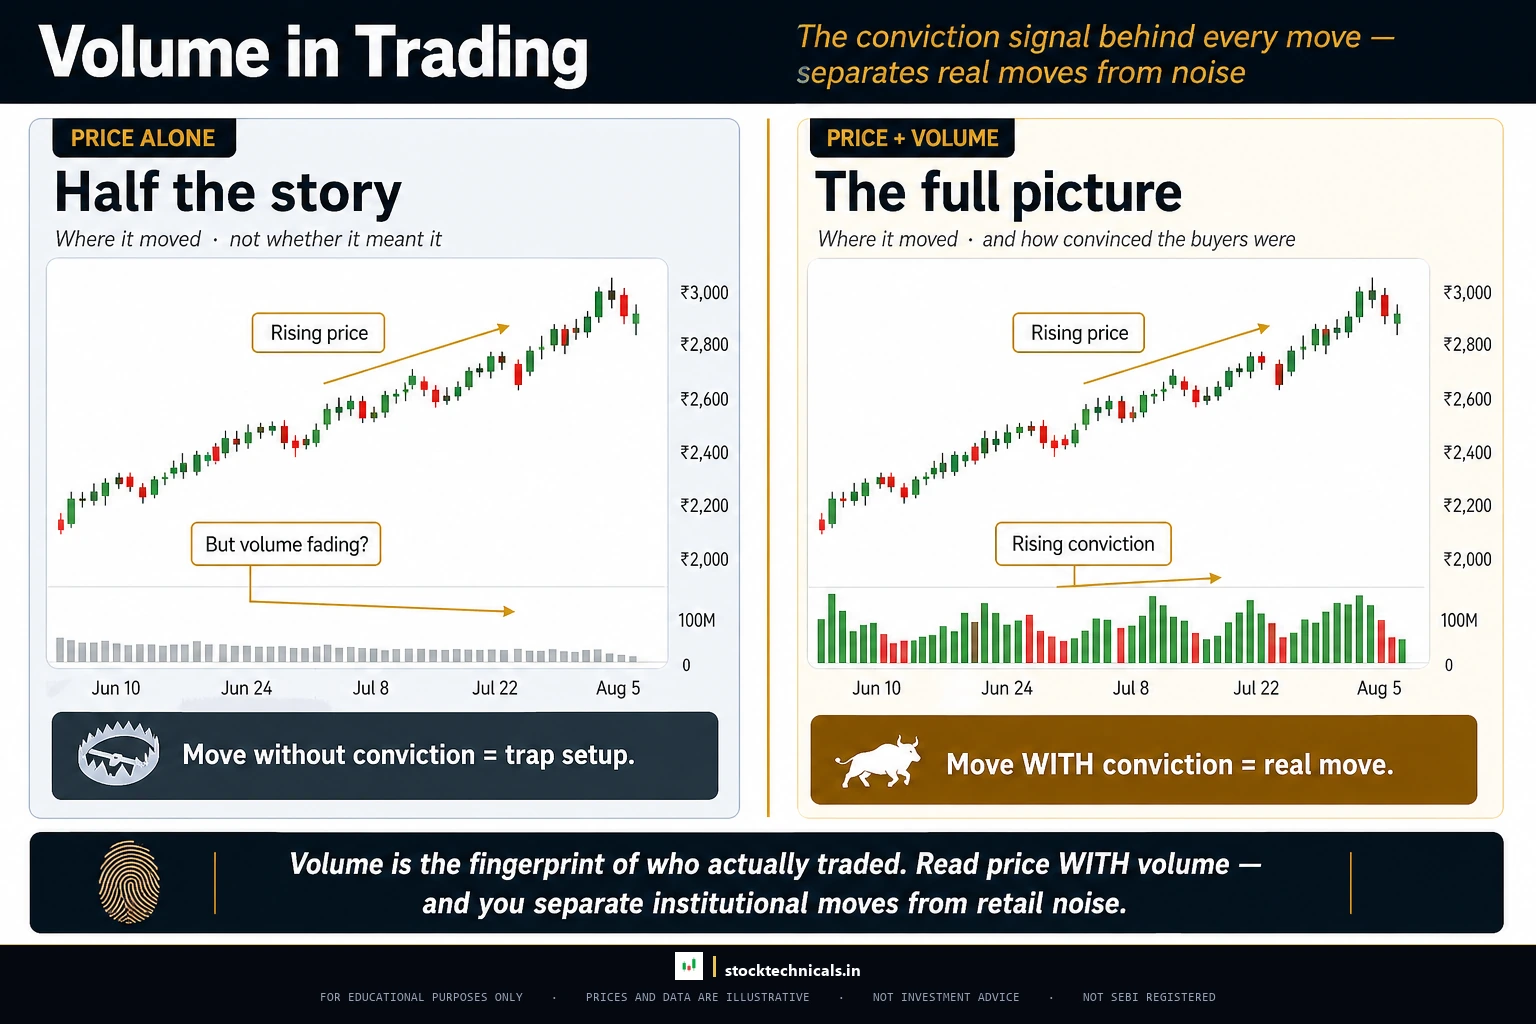
Volume confirms what price suggests. Learn how to read volume patterns, identify institutional activity, and use volume to confirm trends, breakouts, and reversals.

Categories Technical Analysis Leave a comment

Trendlines: How to Draw and Trade Them

11 May 20267 January 2026 by stocktechnicals.in

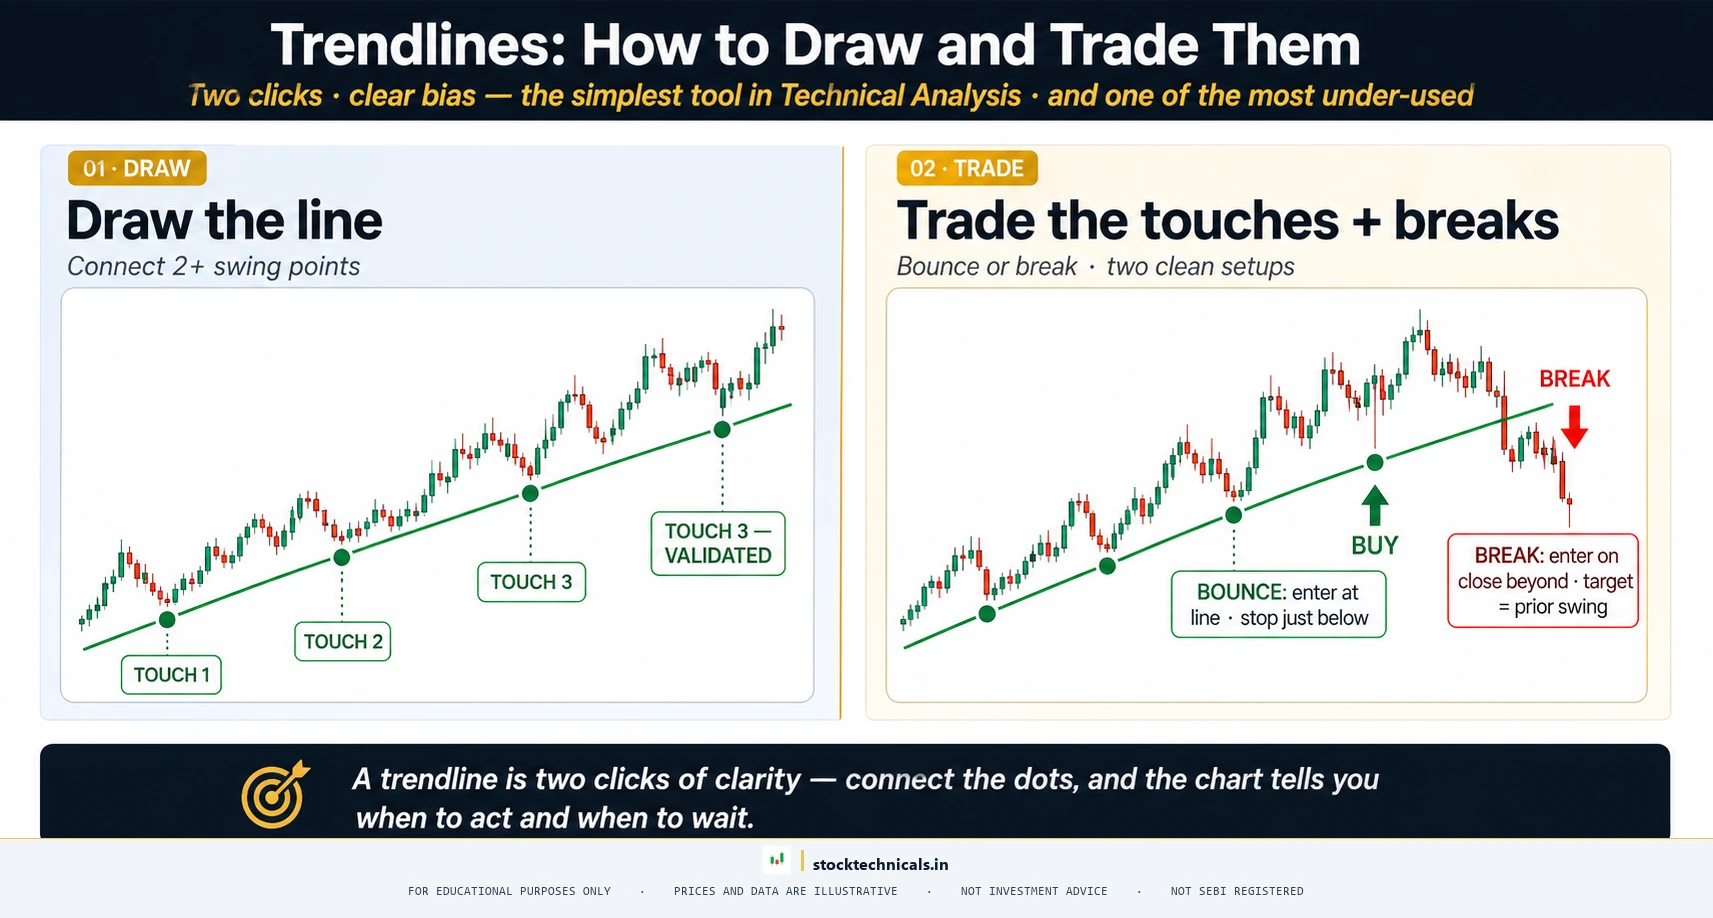
Trendlines are the most fundamental tool in technical analysis. Learn how to draw, validate, and trade trendlines using real NSE stock data and Variant D annotated charts.

Categories Technical Analysis Leave a comment

What is a Trend?

11 May 20266 January 2026 by stocktechnicals.in

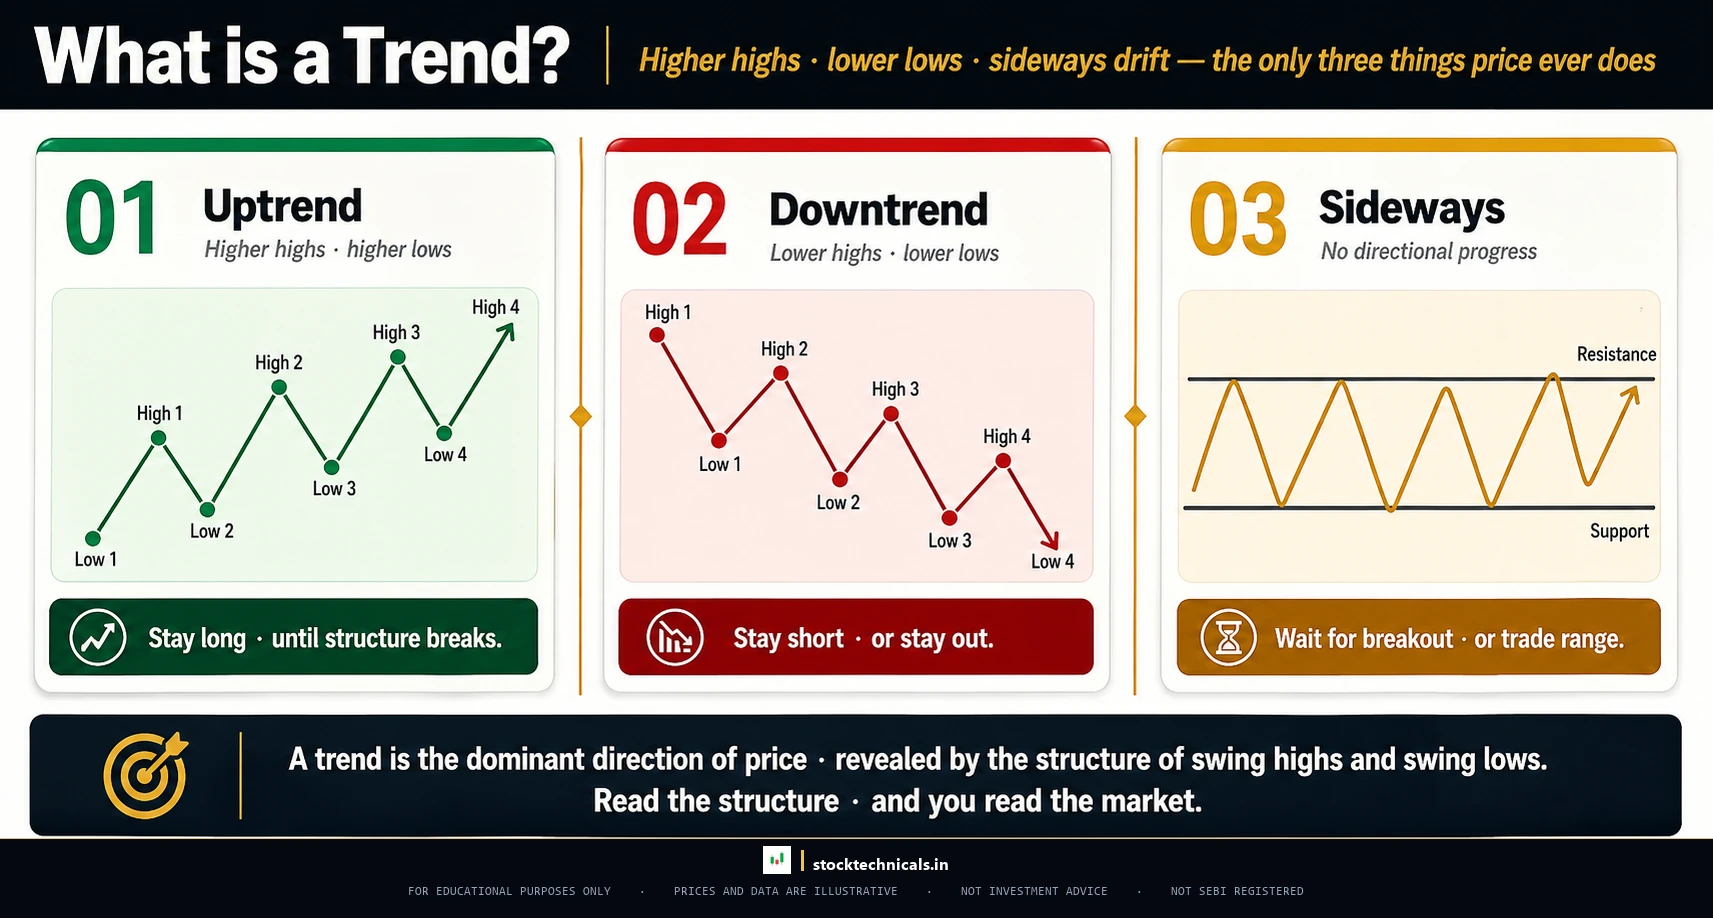
Every profitable trader follows one principle before anything else: identify the trend and trade with it. Learn how to identify uptrends, downtrends, and sideways markets using real NSE price data.

Categories Technical Analysis Leave a comment

Timeframes in Trading: How to Choose the Right One

10 May 20265 January 2026 by stocktechnicals.in

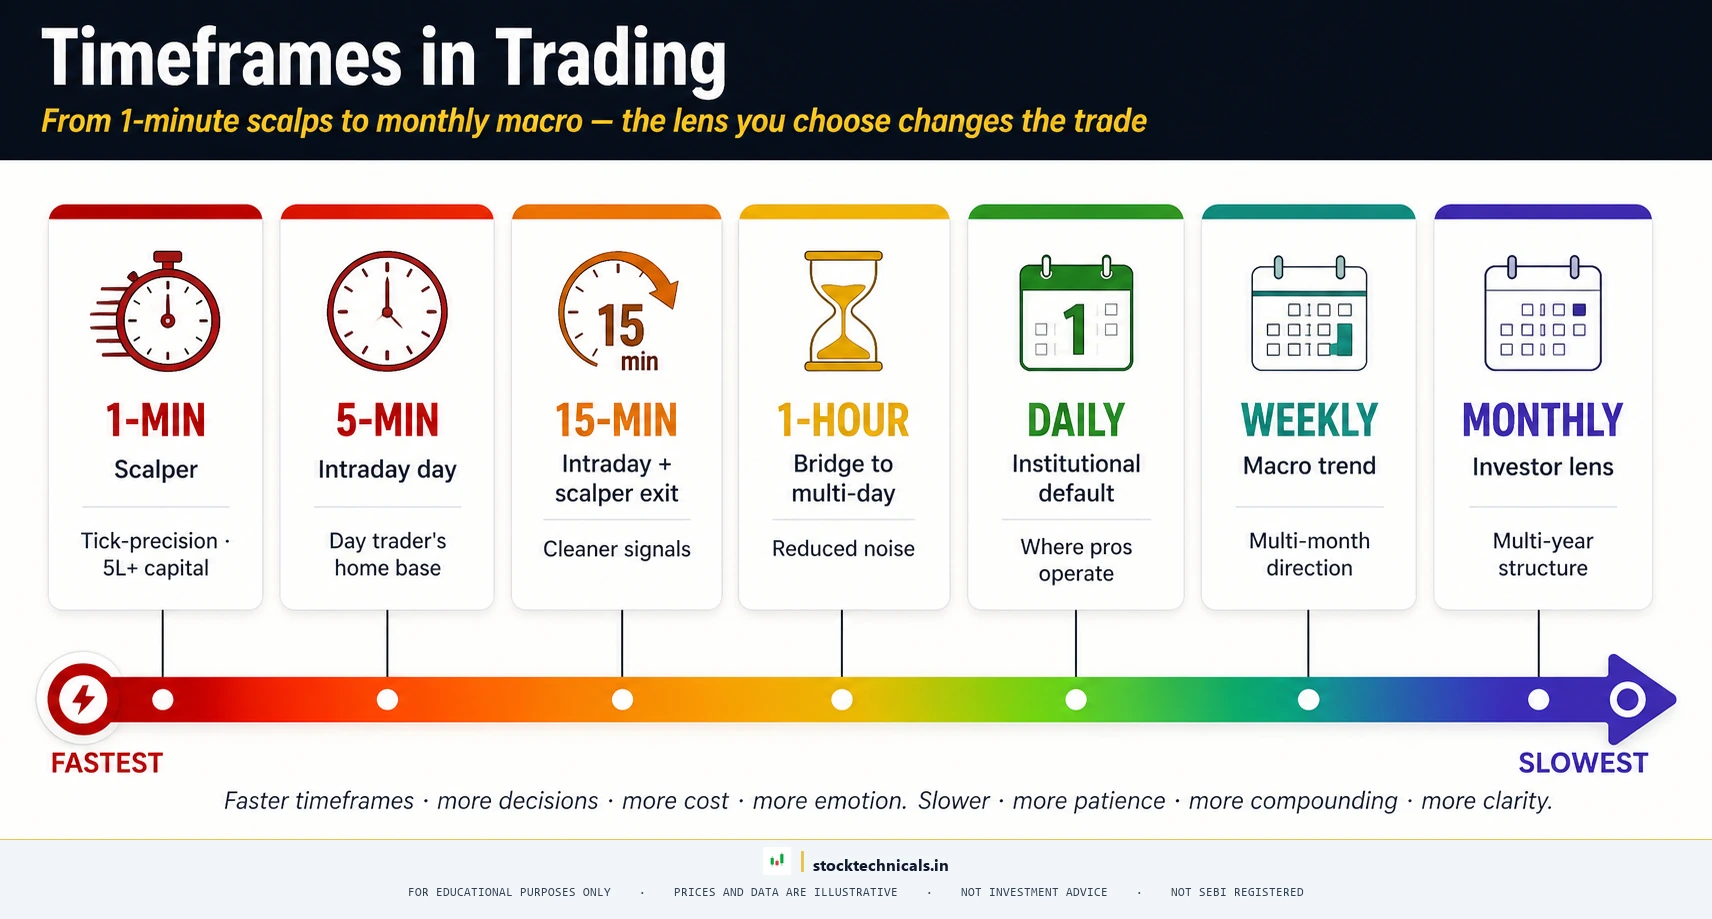
Choosing the right timeframe is one of the most important decisions a trader makes. Learn how daily, weekly, hourly, and 15-minute charts serve different trading styles and strategies.

Categories Technical Analysis Leave a comment

Technical Analysis vs Fundamental Analysis: How to Choose the Right Approach

27 April 20264 January 2026 by stocktechnicals.in
Technical Analysis vs Fundamental Analysis hero — split-screen showing TA inputs (price, volume, time) on the left and FA outputs (statements, ratios, value) on the right, with WHEN to trade vs WHAT to own as the two driving questions

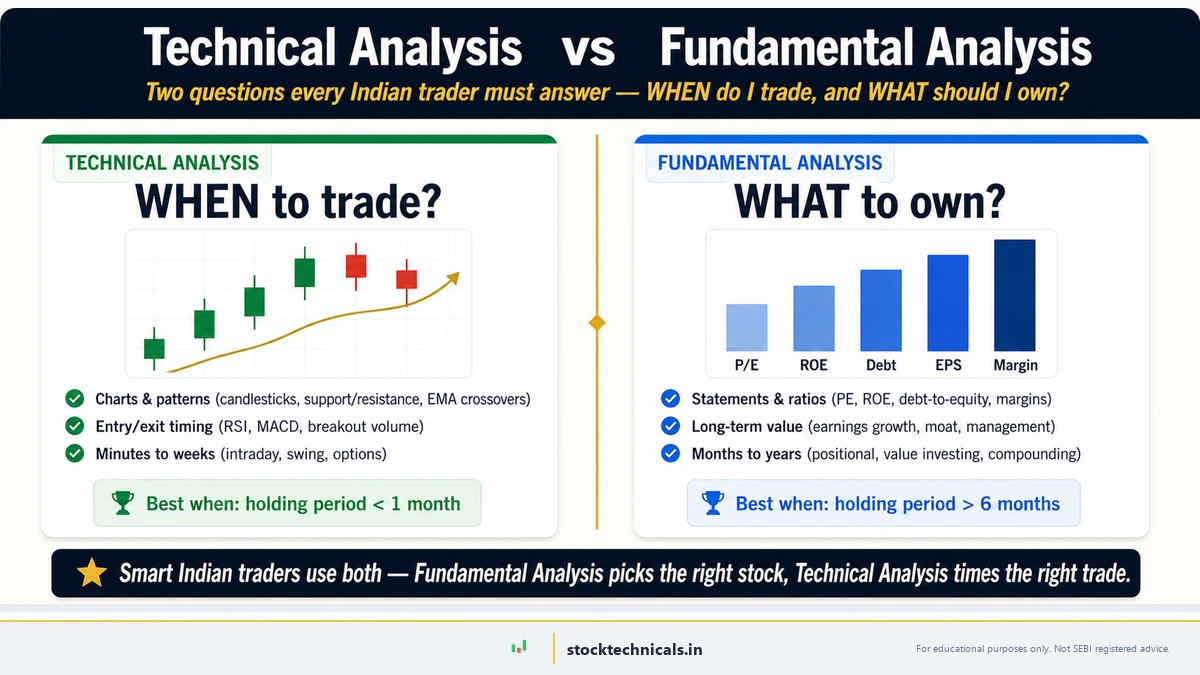
Compare technical and fundamental analysis with a real Reliance Industries case study anchored to 9 April 2026 data, plus a 4-week plan to learn both approaches.

Categories Technical Analysis Leave a comment

Types of Stock Charts: The Complete Visual Guide

11 May 20263 January 2026 by stocktechnicals.in

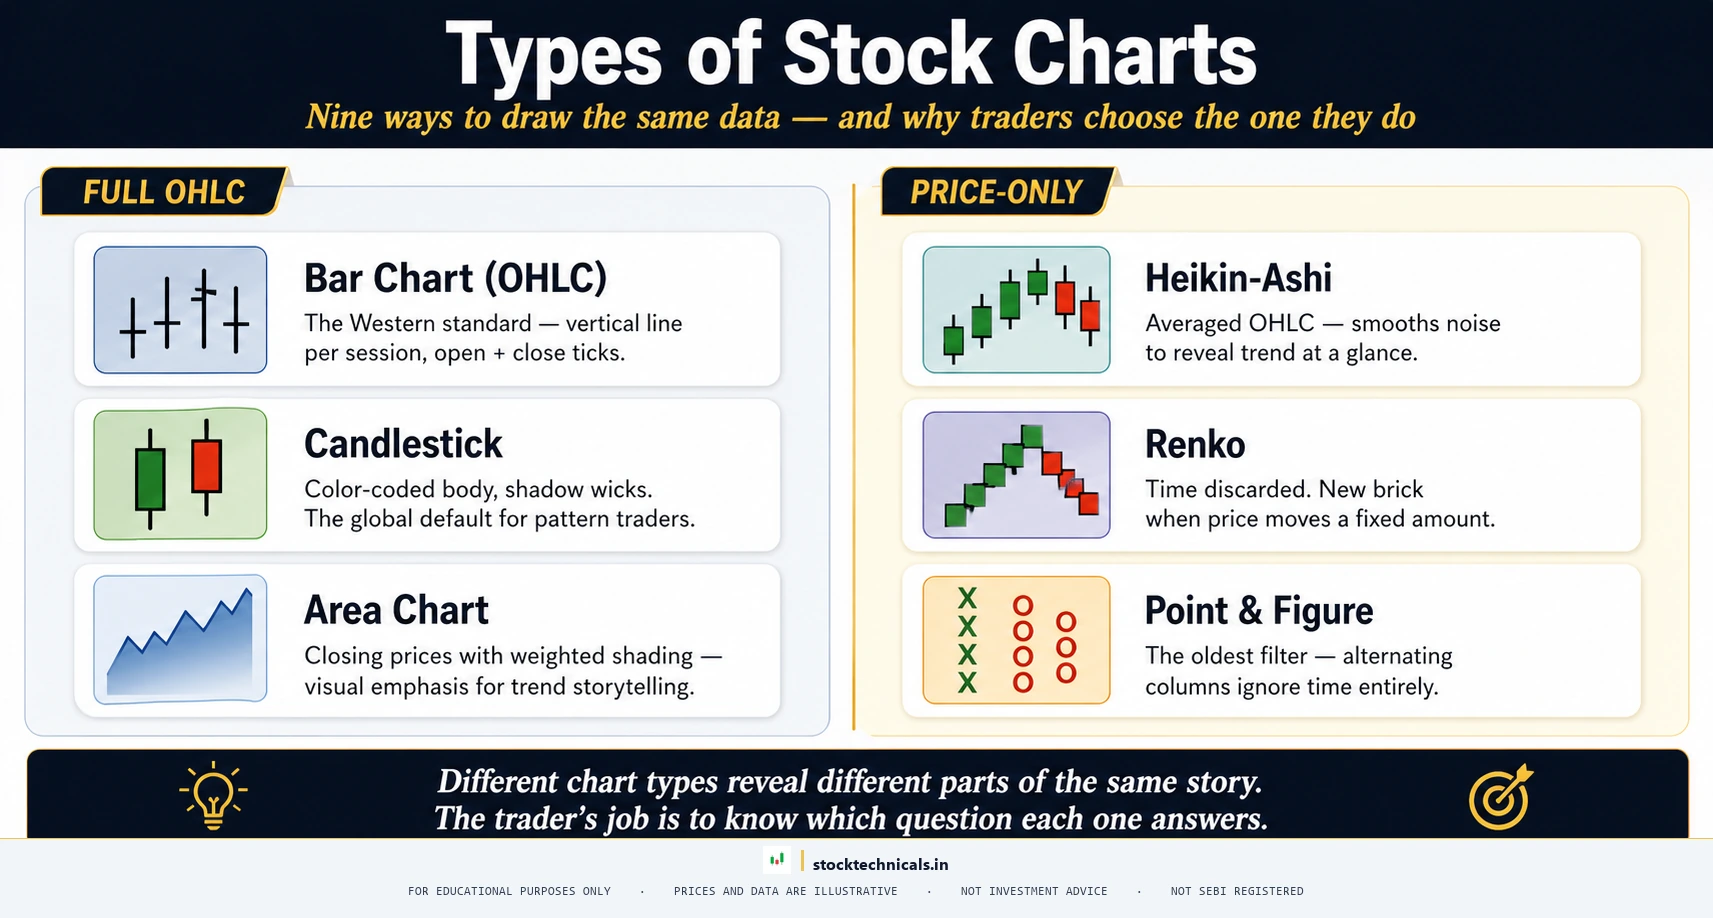
Learn the 3 main types of stock charts — Line, Bar, and Candlestick. Understand which chart type is best for your trading style with real NSE examples and comparisons.

Categories Technical Analysis Leave a comment

How to Read Stock Charts: From First Glance to Trade Setup

27 April 20262 January 2026 by stocktechnicals.in
How to Read a Stock Chart hero — four-step reading journey: identify the trend, mark the key levels, confirm with volume, plan the trade

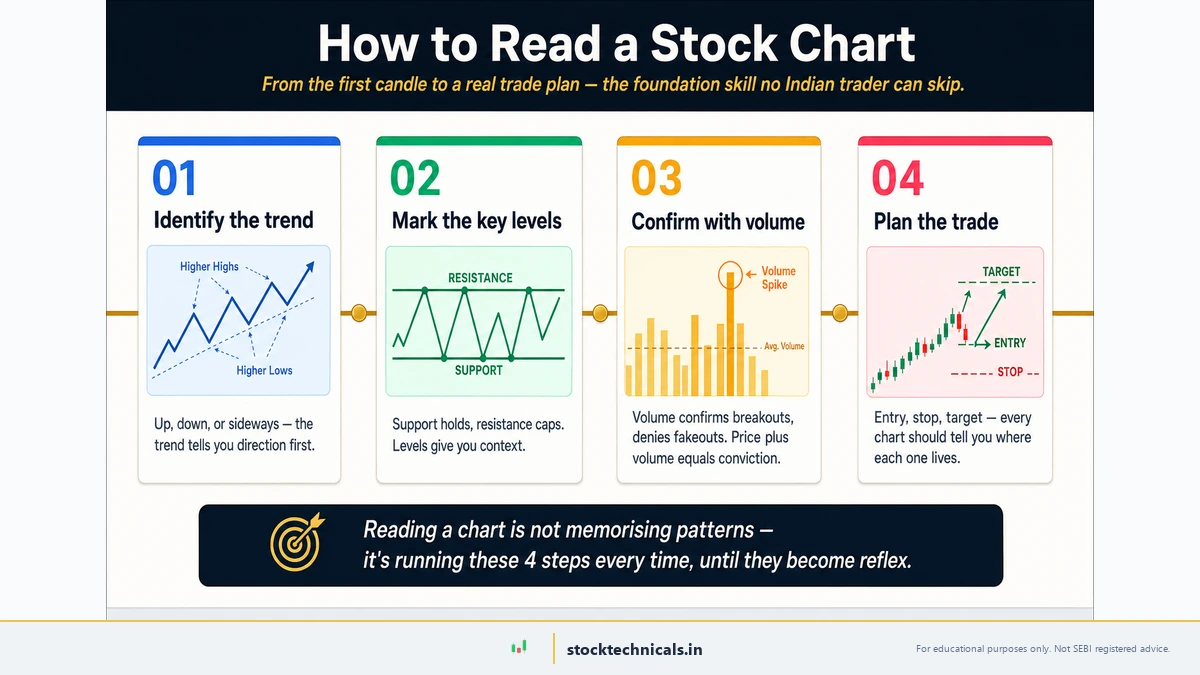
Learn how to read stock charts step by step for Indian stock market trading. Understand price bars, volume, timeframes & chart tools with real NSE/BSE examples.

Categories Technical Analysis Leave a comment
Older posts
Newer posts
← Previous Page1 … Page6 Page7 Page8 Next →
Blog Learn About Contact Disclaimer Privacy Policy Affiliate Disclosure

© 2026 stocktechnicals.in — All rights reserved.

© 2026 StockTechnicals.in — Free Technical Analysis Education for Traders
About · Disclaimer · Privacy Policy · Affiliate Disclosure · Market Pulse · Contact
⚠️ Disclaimer: I am not a SEBI-registered investment advisor, research analyst, or portfolio manager. All content on this website is strictly for educational and informational purposes only. Nothing on this website constitutes investment advice, trading recommendations, or solicitation to buy, sell, or hold any securities. Past performance does not guarantee future results. Trading in financial markets, especially derivatives (F&O), involves significant risk of loss. Please consult a SEBI-registered financial advisor before making any investment decisions.