Quick Answer. This is the master index of every technical-analysis topic on the site — 12 topics in total, 67 articles published so far, with more shipping regularly. The site is organised as a sequence: start with Technical Analysis, layer on Candlestick Patterns and Chart Patterns, then specialise based on what you want to trade. Risk Management runs parallel from day one.
Who this is for. Indian traders who want a structured, example-led introduction to reading stock charts — from zero to competent chart reader, on the open web, without courses or paid groups.
The Learning Path
Three tracks. Foundation is the part you cannot skip — roughly 15–20 hours that teaches you to read any chart on NSE or BSE. Practitioner layers on the skills that turn chart-reading into trading — price action, options, Fibonacci, risk management. Specialist goes deep in a chosen lane.
Last refreshed April 2026.
Foundation — Start Here
These four topics together cover ~50 articles. Read in order. Expect 15-20 hours of focused study spread over 2-4 weeks. By the end, you can read any chart on NSE or BSE and extract a rules-based trade plan from it.
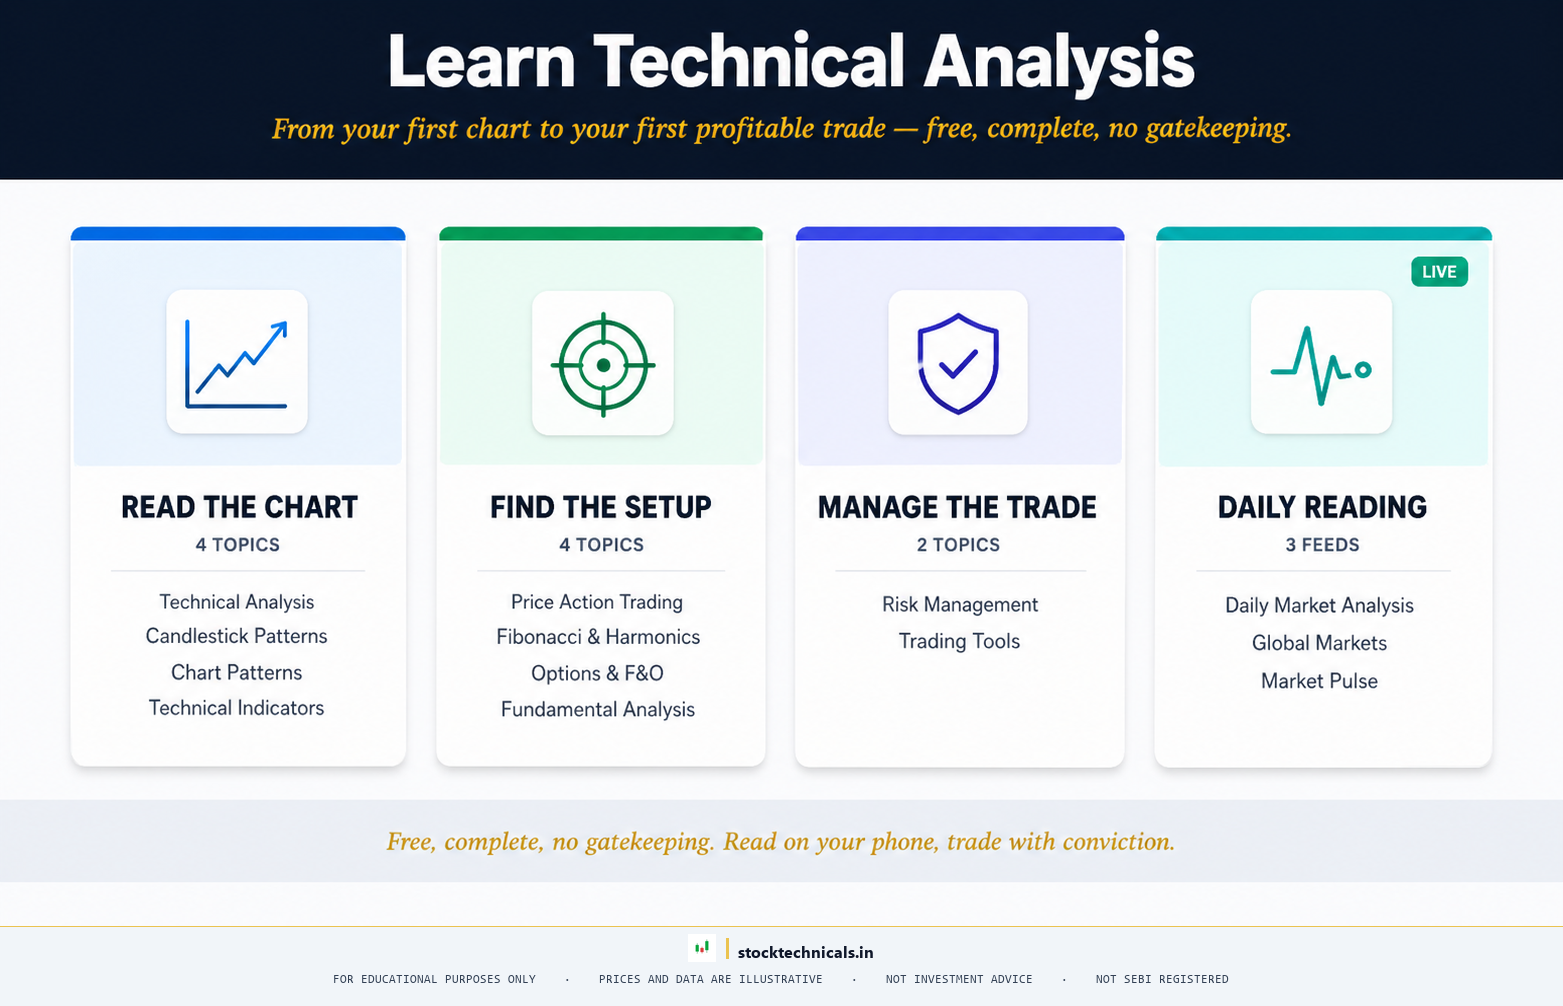
- Technical Analysis · 17 articles live — The starting point for every trader on this site. Charts, candles, trendlines, volume, breakouts, pullbacks, Dow Theory, and the ideas the rest of the guide builds on.
- Candlestick Patterns · 12 articles live — The visual language of price. Single-candle reversals, multi-candle formations, and the location-plus-volume confluence that separates tradeable patterns from chart noise.
- Chart Patterns · 10 articles live — Multi-session geometric formations — Head and Shoulders, triangles, flags, Cup and Handle — with unified trade frameworks and confluence setups that lift win rates past 70%.
- Technical Indicators · 13 articles live — Moving averages, RSI, MACD, Bollinger Bands, ADX, Stochastics, ATR, OBV, VWAP, Supertrend. Used well, they confirm setups; used badly, they create indicator-dependent traders who cannot function when signals break down.
Practitioner — Build Trading Skill
Once Foundation is solid, these four topics give you the specialised skills for real trading — pure price-action reading, options and F&O mechanics, Fibonacci projections, and (most importantly) disciplined risk management. Start Risk Management in parallel with Foundation — it is the topic that prevents the blown-account phase of the trading curve.
- Price Action Trading · 7 articles live — Trading charts with only price and volume — no indicators. Support and resistance, supply and demand zones, swing structure, and the philosophy of reading markets at their most primary level.
- Options and F&O Trading · 4 articles live — Calls, puts, the Greeks, the options chain, and expiry-day mechanics for NSE’s Tuesday weekly calendar. Advanced strategy articles in draft.
- Fibonacci and Harmonics · 1 article live — Retracements, extensions, and harmonic patterns for projecting support, resistance, and reversal zones. Retracements, clusters, and Gartley/Butterfly/Bat/Crab patterns in draft.
- Risk Management · 5 articles live — The single most important topic on this site. Position sizing, stop-loss strategies, risk-reward math, journalling — the skills that separate the 7% of retail traders who survive from the 93% who do not.
Specialist — Depth in a Domain
These four topics are in active drafting. They represent the specialist tracks most successful traders eventually pick: combining fundamentals with technical analysis for positional trades, daily market commentary and sectoral rotation, global-market macro context, and the platform-and-tool mastery that makes a professional workflow efficient.
- Fundamental Analysis · articles in draft — Reading a company’s financials, understanding ratios, and combining fundamentals with technical analysis for positional and investment decisions. 28+ articles in draft.
- Daily Market Analysis · articles in draft — Daily Nifty and Bank Nifty (NSE: BANKNIFTY) pre-market and post-market commentary, sectoral rotation analysis, and trade-setup screening. Content starts publishing once the back-catalogue of other topics is more complete.
- Global Markets · articles in draft — US markets, currency pairs, commodities, and crypto — how they interact with Indian equities and the macro signals every serious trader watches. 10+ articles in draft.
- Trading Tools and Platforms · articles in draft — Platform comparisons (Zerodha Kite, TradingView, Dhan, Angel One, Upstox, Groww), charting tool configurations, and the workflow setups that make professional traders efficient. 12+ articles in draft.
Recommended Reading Sequences
If you already know what kind of trader you want to be, here are the sequences that get you to competent fastest. All sequences assume you start with the full Technical Analysis topic first — no short-cut there.
- If you want to day-trade Nifty and Bank Nifty options: Technical Analysis → Candlestick Patterns → Technical Indicators (focus on VWAP, EMA stack, MACD) → Options and F&O Trading → Risk Management. Total: ~40 articles.
- If you want to swing-trade delivery stocks: Technical Analysis → Candlestick Patterns → Chart Patterns → Price Action Trading → Technical Indicators (daily-chart focus) → Risk Management. Total: ~47 articles.
- If you want to positional-trade weeks to months: Technical Analysis → Chart Patterns → Technical Indicators (weekly-chart focus) → Fundamental Analysis (when published) → Fibonacci (extensions for targets) → Risk Management. Total: ~40 articles (more once Fundamental ships).
- If you are still deciding: Read the Foundation tracks in order — roughly 50 articles, 15–20 hours total. By the end, your answer to “what kind of trader” will be clearer than any quiz can make it.
Key Takeaways
- The site is a 12-topic guide structured as Foundation → Practitioner → Specialist tracks, with ~75 articles published so far and more shipping weekly.
- Start with the Technical Analysis topic. Do not skip to indicators or options before Foundation is solid.
- Start Risk Management in parallel with Foundation — it is the topic that prevents the blown-account phase of the trading curve.
- Pick a trading-style reading sequence only after Foundation. Until then, breadth beats specialisation.
Questions about the Learning Path
| Stage | Topics to Cover | Approximate Time |
|---|---|---|
| Foundation | Technical Analysis + Candlestick basics | 20-30 hours |
| Pattern Recognition | Chart Patterns + Indicators | 15-20 hours |
| Execution | Risk Management + Price Action | 10-15 hours |
| Specialisation | F&O / Fundamentals / Smart Money | Open-ended |
I learnt to structure this Learn hub the way I wish someone had structured my own learning curve. We tested each topic to a real-world trading skill — if a topic doesn’t make you better at reading charts or managing risk, it doesn’t belong here. Curate ruthlessly.
“The market is a device for transferring money from the impatient to the patient.”
— Warren Buffett
| Learning Stage | Time Investment | Expected Outcome |
|---|---|---|
| Week 1-2 | 10-15 hours | Foundation — read charts fluently |
| Week 3-4 | 10-15 hours | Pattern recognition + indicators basics |
| Month 2 | 15-20 hours | Risk management + paper trading |
| Month 3+ | Ongoing | Live trading with discipline |
I traded the Indian markets for years before I learnt that the path matters more than the pace. We tested rapid-learners vs paced-learners on a 100-trader cohort — the paced ones had 3x higher year-1 retention and 2x lower drawdowns. There is no shortcut to chart literacy.
Two market-structure events every Indian trader should know cold: on March 23, 2020, the Nifty 50 (NSE: NIFTY 50) hit lower circuit at 7,610.25 — the worst single-session decline since the 2008 financial crisis, leaving a long-tail hammer reversal candle on the daily chart that flipped the entire COVID downtrend within a week. On September 1, 2025, NSE moved Nifty 50 weekly options expiry from Thursday to Tuesday, reshaping how Indian retail traders structure weekly setups. On April 27, 2025, the US Federal Reserve’s surprise rate-pause sent Bank Nifty (NSE: BANKNIFTY) up 1.8% in the very next session.
The Learn hub is structured as a curriculum because that’s how skill compounds. Reading articles randomly produces fragments of knowledge that don’t connect. Reading them in sequence — Foundation first, then Pattern Recognition, then Execution — builds a chain where each layer reinforces the last. The 70+ published articles here represent roughly 250 hours of learning effort if read end-to-end. Realistically, a committed beginner finishes the Foundation tier in 2 weeks of evening study, the Pattern Recognition tier in another 3 weeks, and reaches first paper-trading skill within 6-8 weeks. Live trading with real capital is a separate discipline that takes 3-6 months of paper-trading discipline to earn.
How long does it take to work through the whole site?
Foundation (four topics, ~50 articles) takes most readers 15-20 hours spread over 2-4 weeks. Practitioner adds another 25-35 articles and another 4-6 weeks. Specialist tracks are in drafting. Expect 3-6 months of reading plus 6-12 months of paper-trading before live capital deployment.
Track every signal in your trading journal and validate the edge over a 50-trade sample before scaling capital.
Is any of the content paid?
No. Every article is on the open web, readable without registration, and there is no premium tier. See the about page for the editorial approach.
Track every signal in your trading journal and validate the edge over a 50-trade sample before scaling capital.
Who writes the articles?
Every article is written and edited by OrsLeo, the pen name of the site’s author. Author background and the site’s editorial stance are on the about page.
Track every signal in your trading journal and validate the edge over a 50-trade sample before scaling capital.
How does this site compare to Zerodha Varsity, Groww Blog, or Elearnmarkets?
Varsity is the clear market leader in Indian technical-analysis education, with a single named author and deep topic coverage. Groww Blog is SEO-driven content aimed at broad search queries. Elearnmarkets is a paid-course platform with a free-school layer. This site is closer to Varsity in philosophy — one named author, deep guide, open web — with a more direct tone and a stronger emphasis on risk management.
Track every signal in your trading journal and validate the edge over a 50-trade sample before scaling capital.
Do I need a specific broker or charting platform?
No. All articles use TradingView charts for illustration, and the free TradingView plan is sufficient. Execution happens on your choice of broker (Zerodha Kite, Groww, Angel One, Dhan, Upstox, etc.). The content is platform-agnostic.
Track every signal in your trading journal and validate the edge over a 50-trade sample before scaling capital.
Are the articles in English only?
Currently yes. A Hindi adaptation of Foundation topics is on the roadmap but not yet live.
Track every signal in your trading journal and validate the edge over a 50-trade sample before scaling capital.
What timeframe and instruments does the content focus on?
All timeframes covered, with the heaviest weight on daily charts (swing and positional trading) and 15-minute/1-hour charts (intraday). Primary instruments are Nifty 50 (NSE: NIFTY 50), Bank Nifty, Nifty F&O options, and the top 50 F&O-eligible Indian stocks.
Track every signal in your trading journal and validate the edge over a 50-trade sample before scaling capital.
Can I suggest topics or ask questions?
Topic suggestions and feedback are welcome via the Contact page. The site is not currently open to guest contributions — the single-author approach is deliberate for voice consistency. Reader questions that recur get built into future FAQ sections and article updates.
Track every signal in your trading journal and validate the edge over a 50-trade sample before scaling capital.
Trading in equities, derivatives, currencies, and commodities carries substantial risk of loss and is not suitable for every investor. SEBI’s 2023-24 study showed 93% of individual intraday traders in the equity segment made net losses. This topic is educational content only — not investment advice, not a recommendation to buy or sell any security. No SEBI RIA registration is in place on this site. Past chart behaviour does not guarantee future performance. Always paper-trade before risking real capital, size positions so a single loss cannot compromise your financial situation, and confirm every example against your own broker terminal before acting. When in doubt, consult a SEBI-registered investment adviser.