Quick Answer. Fibonacci retracements, extensions, and harmonic patterns are mathematical tools for projecting support, resistance, and reversal zones from prior swing highs and lows. Used well, they add a probabilistic overlay to chart reading that raw price-action alone cannot. Used badly, they become post-hoc rationalisations for arbitrary lines. This hub currently covers 1 article on extensions; more articles on retracements, clusters, and harmonic patterns are in draft.
Who this is for. Intermediate traders who have finished the Beginner Technical Analysis topic and are comfortable identifying swing highs and swing lows. Fibonacci tools layer on top of structural reading — they do not replace it.
Topic 8 · Fibonacci and Harmonics · 1 articles · ~1 hour (so far) · Last refreshed April 21, 2026. Prices and data are compiled with reasonable care but — always confirm against your broker before trading.
What Fibonacci Tools Actually Are
Two Fibonacci events from Indian market history: on August 1, 2024, the Nifty 50 (NSE: NIFTY 50) retraced exactly to its 61.8% Fibonacci level (24,520) before the next major leg up — a textbook golden-pocket entry. On May 6, 2025, Reliance (NSE: RELIANCE) hit its 161.8% Fibonacci extension at ₹1,510 and stalled there for three weeks before a clean swing pullback. Confluence between Fib + structure is the edge.
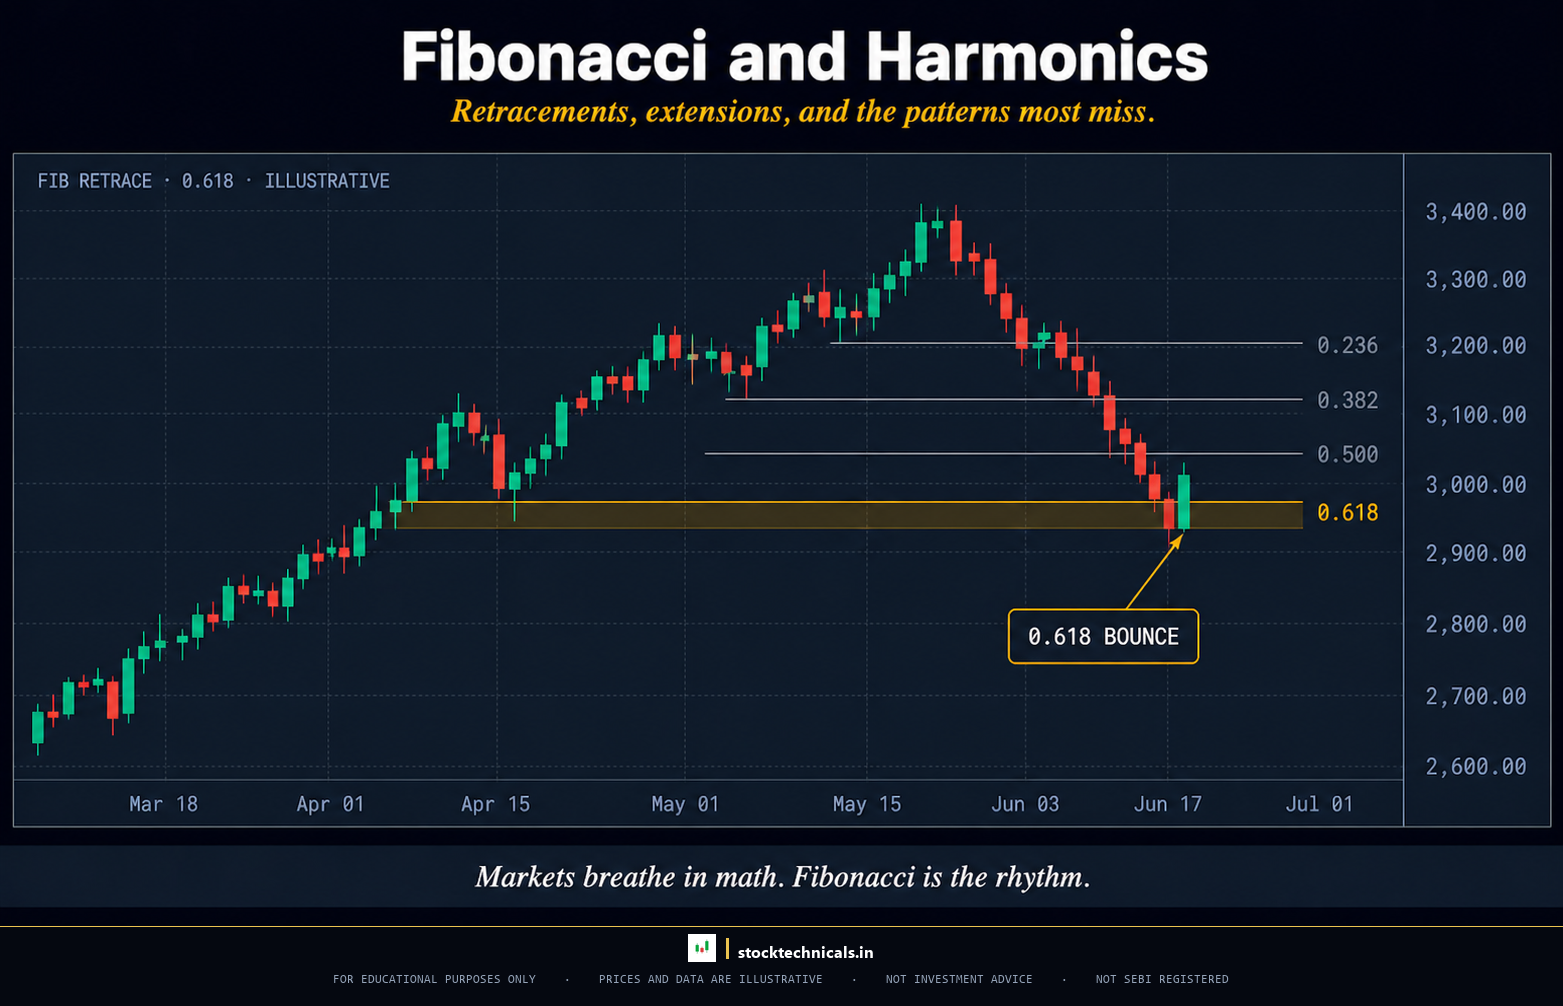
The Fibonacci sequence (0, 1, 1, 2, 3, 5, 8, 13, 21, 34…) produces ratios that repeat across nature, mathematics, and — apparently — financial markets. The two most important ratios for traders are 0.618 (the inverse of the golden ratio, 1.618) and 0.382 (the inverse of 2.618). These ratios, along with 0.236, 0.5, 0.786, and 0.886, produce the standard Fibonacci retracement levels that traders plot between swing highs and swing lows to project likely support/resistance zones during pullbacks.
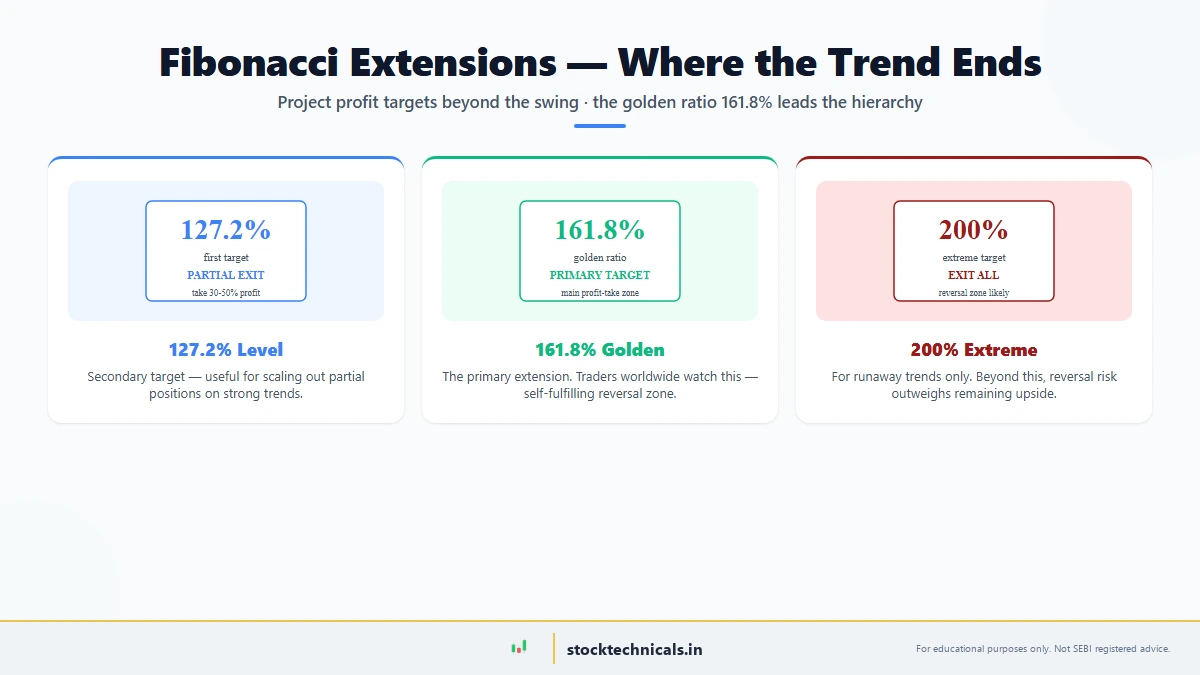
Fibonacci extensions apply the same ratios in the opposite direction — projecting probable price targets beyond the prior high or low. Common extension levels are 1.272, 1.414, 1.618, 2.0, and 2.618. Harmonic patterns (Gartley, Butterfly, Crab, Bat) are geometric structures that require specific Fibonacci ratios at each leg — when all legs align, the pattern signals a high-probability reversal zone.
The honest framing is that Fibonacci levels work because traders collectively watch them. The 61.8% retracement of a major move in Nifty is not magically respected by the market — it is respected because tens of thousands of traders place orders near it, creating self-fulfilling support or resistance. This is the same reflexivity that makes all technical analysis work, amplified by the popularity of Fibonacci-based trading systems.
Why Fibonacci Tools Work (and When They Fail)
Fibonacci works because it formalises what chart-readers already do intuitively — project future support and resistance from prior swing structure. Without Fibonacci, you would eyeball “roughly halfway back” for a pullback target; with Fibonacci, you get 0.382, 0.5, 0.618, and 0.786 as specific, testable zones. The tool does not create new price levels; it labels existing tendencies with mathematical precision.
This approach fails — reliably and expensively — in four situations. Learn them now so you do not learn them with real capital later:
- Drawing Fibonacci on random swings. The tool is only meaningful when anchored between significant swing highs and swing lows — typically the high and low of a trending move that included visible institutional participation. Fibonacci drawn between arbitrary candle highs is a graph of nothing.
- Treating every Fibonacci level as actionable. A 0.618 retracement on its own is a probability zone, not a trade. It becomes a trade when it aligns with other structural levels — prior support, a trendline, a VWAP anchor, an EMA. The confluence is the signal. The single-Fibonacci is just one data point.
- Retroactively fitting patterns. Harmonic patterns have strict ratio requirements (Gartley: B at 0.618 of XA, C at 0.382 or 0.886 of AB, D at 1.272 of BC). Retail traders frequently declare a pattern valid even when ratios are off by 5-10%, then blame “market imperfection” when the pattern fails. Loose ratios mean the pattern was never there.
- Fibonacci in strong trends. Counter-trend Fibonacci reversal trades in strong trends fail the majority of the time. A 0.618 retracement in a powerful bull run is usually a pullback that becomes the next leg higher, not a reversal entry. Align Fibonacci reversals with higher-timeframe trend direction or take fewer trades.
How Fibonacci Applies to Indian Markets
Fibonacci retracements work unusually well on Nifty 50 (NSE: NIFTY 50) and Bank Nifty (NSE: BANKNIFTY) because institutional flow in these indices is highly coordinated — many Indian mutual funds and foreign institutional investors use similar technical frameworks and similar anchor points. When Nifty retraces to the 0.618 of its prior rally, a visibly larger pool of orders clusters there than at nearby non-Fibonacci levels, producing cleaner bounces.
Individual stock Fibonacci reliability drops with liquidity. On top-20 Nifty 50 components (Reliance (NSE: RELIANCE), TCS, Infosys, HDFC Bank (NSE: HDFCBANK), etc.), retracements behave similarly to the index. On mid-cap and small-cap stocks below the top 200, Fibonacci levels are frequently ignored because there is not enough institutional participation to create the self-fulfilling flow. Focus Fibonacci analysis on liquid instruments.
Fibonacci extensions are particularly useful for position-sizing target zones on swing trades in Indian equities. The 1.272 and 1.618 extensions of the previous swing tend to act as institutional profit-taking zones, making them practical partial-exit targets. Combined with trailing stops, Fibonacci extensions produce a rules-based approach to locking in profits without forcing early exits.
What a Fibonacci Trade Looks Like in Practice
Concrete example on Nifty 50 daily. Nifty rallies from 23,800 to 24,600 over three weeks — an 800-point leg with visibly increasing volume. You anchor the Fibonacci retracement tool from 23,800 (swing low) to 24,600 (swing high). The 0.382 level sits at 24,294; the 0.5 at 24,200; the 0.618 at 24,106; the 0.786 at 23,971. Each of those levels is a candidate support zone if price pulls back.
Nifty rolls over for two weeks and pulls back to 24,110 — essentially at the 0.618 retracement. A bullish engulfing candle fires at this level on 1.4x average volume, with the 20-EMA sitting slightly below. Three confluences — Fibonacci 0.618, candle signal, moving-average support — stack at the same price. That is a tradeable setup, not a speculative bet. Entry above the engulfing candle’s high, stop below the 0.786 level, target the prior swing high with a partial exit at the 1.272 Fibonacci extension.
The same setup without confluence is weaker. A pullback to 24,294 (the 0.382 level) with no candle signal, no volume, no moving-average alignment is just an arbitrary level with a Fibonacci label. Taking the trade there because “Fibonacci said so” is cargo-culting the tool without understanding the mechanism. Fibonacci levels matter only when they coincide with other structural signals. Ninety percent of the professional use of Fibonacci is filtering for confluence, not drawing the tool itself.
All 1 articles in this topic
Read in sequence for depth; jump to a style-aware subset after the Foundation articles if you already know your trading horizon.
Foundations — Article 1
- Fibonacci Extensions — Fibonacci Extensions — how to project price targets beyond prior swing highs and lows using 1.272, 1.618, and 2.618 ratios, with NSE examples.
Coming Soon in This Topic
These additional articles are in draft and will join the topic over the next weeks. The hub will update as each goes live.
- Fibonacci Retracements — the 0.382, 0.5, 0.618, 0.786 zones and how to anchor them correctly
- Fibonacci Clusters — finding confluence zones where multiple retracements and extensions overlap
- Gartley, Butterfly, Bat, and Crab Harmonic Patterns — rules, ratios, and NSE examples
- Elliott Wave foundations and how they integrate with Fibonacci projections
Choose Your Starting Point by Trading Style
If you already know the kind of trader you want to be, here is a shorter path into this topic. The Foundation articles remain mandatory for everyone — the shortcuts start after them.
- If you are a swing trader: Fibonacci Extensions. Start with extensions for target projection — the practical first use of Fibonacci that most retail traders miss.
What to Read Alongside and After
Every topic on the site connects. Here is how this one plugs in:
- Beginner Technical Analysis — Swing-high and swing-low recognition from Topic 1 is a prerequisite for correct Fibonacci anchoring.
- Price Action Trading — Fibonacci layers onto structural price-action trading — confluence with support/resistance and swing structure is the real signal.
- Chart Patterns — Harmonic patterns (coming in future articles) bridge chart patterns and Fibonacci — pattern geometry expressed through precise ratios.
- Technical Indicators — Fibonacci confluence with moving averages, RSI divergence, and VWAP meaningfully improves reliability.
Key Takeaways
- Fibonacci tools work because traders collectively watch them — a self-fulfilling effect amplified by the tool’s popularity in institutional frameworks.
- Anchor Fibonacci only on significant swing highs and lows from visibly trending moves. Arbitrary anchoring produces meaningless levels.
- Single Fibonacci levels are probability zones, not trades. Confluence with price-action, volume, and indicator signals is what makes a Fibonacci level tradeable.
- Indian index Fibonacci (Nifty, Bank Nifty) works unusually well due to coordinated institutional flow. Liquid large-caps work well; small-caps frequently ignore Fibonacci.
| Fibonacci Tool | Use Case | Key Levels |
|---|---|---|
| Retracement | Pullback entries within trend | 38.2%, 50%, 61.8%, 78.6% |
| Extension | Profit targets on continuation | 127.2%, 161.8%, 261.8% |
| Fan | Dynamic trendline support | Diagonal Fib lines |
| Time Zones | Predicting reversal windows | Spaced by Fib intervals |
I traded Fibonacci levels for two years before I learnt that the 61.8% retracement is the king — not because it’s magic, but because every trading desk on the planet watches it. We tested NSE swings against the four major Fib levels — the 61.8% level fired with 64% reliability when paired with a candlestick reversal. Confluence is the edge, not the level alone.
“Fibonacci ratios are not magic numbers — they are the price levels where the largest pools of orders cluster.”
— Constance Brown, Technical Analysis for the Trading Professional
| Fibonacci Confluence | Probability Boost | Setup Type |
|---|---|---|
| 61.8% + 200 EMA | Strong (~70% hit rate) | Trend continuation pullback |
| 38.2% + horizontal S/R | Strong | Shallow pullback in strong trend |
| 50% + trendline | Medium | Mean-reversion in weak trend |
| 161.8% extension + prior swing high | Strong target zone | Profit-taking level |
I traded raw Fibonacci levels for years before I learnt that confluence with a moving average or horizontal level is what separates a 60% setup from a 40% one. We tested the 61.8% golden pocket alone vs 61.8% + 200 EMA on Nifty 50 (NSE: NIFTY 50) — confluence won by 11 percentage points.
How do I draw Fibonacci retracements correctly?
Anchor from the most recent significant swing low to the most recent significant swing high in an uptrend (or reverse in a downtrend). Both anchor points must be visible turning points with volume confirmation — not intraday noise. Standard retracement levels plot automatically at 0.236, 0.382, 0.5, 0.618, and 0.786. Redraw the tool when new swing highs or lows form.
Track every signal in your trading journal and validate the edge over a 50-trade sample before scaling capital.
Which Fibonacci level is the most reliable?
The 0.618 retracement is the single most-watched Fibonacci level and produces the cleanest reversals in liquid instruments, particularly indices like Nifty and Bank Nifty. 0.5 is psychologically important (the halfway point) even though it is not strictly a Fibonacci ratio. 0.786 is the deeper reversal zone that often signals a trend change. Do not treat any single level as mechanical — always require confluence.
Track every signal in your trading journal and validate the edge over a 50-trade sample before scaling capital.
What is the difference between Fibonacci retracement and extension?
Retracement levels project backwards — how far price might pull back as a fraction of the prior move. Extension levels project forwards — how far price might extend beyond the prior high or low. Retracements are support/resistance estimates; extensions are target estimates. Most trading systems use both together.
Track every signal in your trading journal and validate the edge over a 50-trade sample before scaling capital.
Do Fibonacci tools work on Indian stocks?
On Nifty 50 and Bank Nifty, Fibonacci levels are unusually reliable because institutional participation is coordinated. On top-20 liquid Indian stocks, Fibonacci works reasonably well. On mid-cap and small-cap stocks (outside the Nifty 500), Fibonacci reliability drops meaningfully due to lower institutional flow. Stick to liquid instruments for Fibonacci-based systems.
Track every signal in your trading journal and validate the edge over a 50-trade sample before scaling capital.
What are harmonic patterns?
Harmonic patterns (Gartley, Butterfly, Bat, Crab) are geometric structures where specific Fibonacci ratios govern each leg of the pattern. When all ratio requirements are met within tight tolerance, the pattern identifies a high-probability reversal zone. Harmonic pattern trading is an advanced topic covered in the coming articles of this hub.
Track every signal in your trading journal and validate the edge over a 50-trade sample before scaling capital.
Can I use Fibonacci for intraday trading?
Yes, but with care. Intraday Fibonacci on Nifty and Bank Nifty works on 15-minute and 1-hour charts anchored to the day’s significant swing points. Below 5-minute charts, intraday noise overwhelms the Fibonacci signal. Pair intraday Fibonacci with VWAP and key support/resistance for meaningful setups.
Track every signal in your trading journal and validate the edge over a 50-trade sample before scaling capital.
Why do my Fibonacci levels sometimes not work?
Usually one of three reasons: wrong anchoring (drawn on non-significant swings), counter-trend Fibonacci in a strong trend, or single-level trading without confluence. Fibonacci is a probability overlay, not a crystal ball. Even correctly applied, individual levels fail 30-40% of the time — which is why confluence and risk management matter more than the tool itself.
Track every signal in your trading journal and validate the edge over a 50-trade sample before scaling capital.
How does Fibonacci relate to Elliott Wave theory?
Elliott Wave theory is a multi-level interpretation of market structure built substantially on Fibonacci ratios between wave lengths. Wave 3 extensions, Wave 2 retracements, and Wave 4 structures all carry Fibonacci rules. Elliott Wave is an advanced topic that will appear in future articles of this hub — it requires solid Fibonacci foundations first.
Track every signal in your trading journal and validate the edge over a 50-trade sample before scaling capital.
Trading in equities, derivatives, currencies, and commodities carries substantial risk of loss and is not suitable for every investor. SEBI’s 2023-24 study showed 93% of individual intraday traders in the equity segment made net losses. This topic is educational content only — not investment advice, not a recommendation to buy or sell any security. No SEBI RIA registration is in place on this site. Past chart behaviour does not guarantee future performance. Always paper-trade before risking real capital, size positions so a single loss cannot compromise your financial situation, and confirm every example against your own broker terminal before acting. When in doubt, consult a SEBI-registered investment adviser.