
Williams %R is a momentum oscillator developed by Larry Williams that plots a single line between 0 and −100. Readings between 0 and −20 mean overbought; readings between −80 and −100 mean oversold. Unlike RSI and Stochastic, it moves on an inverted scale, which makes it faster and more sensitive to swing extremes — useful for traders who want early reversal signals in trending markets.
Intermediate traders who already use RSI or Stochastic and want a faster momentum reading for swing entries on Nifty 50, Bank Nifty, and large-cap stocks. Best paired with a trend filter — Williams %R generates a lot of signals, so a trend overlay is what keeps you from fighting the tape.
Most momentum oscillators run on a 0–100 scale. Williams %R flips it: the line runs from 0 (strong) at the top to −100 (weak) at the bottom. That single inversion makes the indicator feel faster than RSI because the overbought/oversold zones are closer together visually and the line reacts to fresh swing highs and lows more promptly.
Larry Williams, the futures trader who built it, designed it to answer one question: is the current close near the high or low of the recent range? When it’s near the high, momentum is with bulls. When it’s near the low, momentum is with bears. Everything else follows from there.
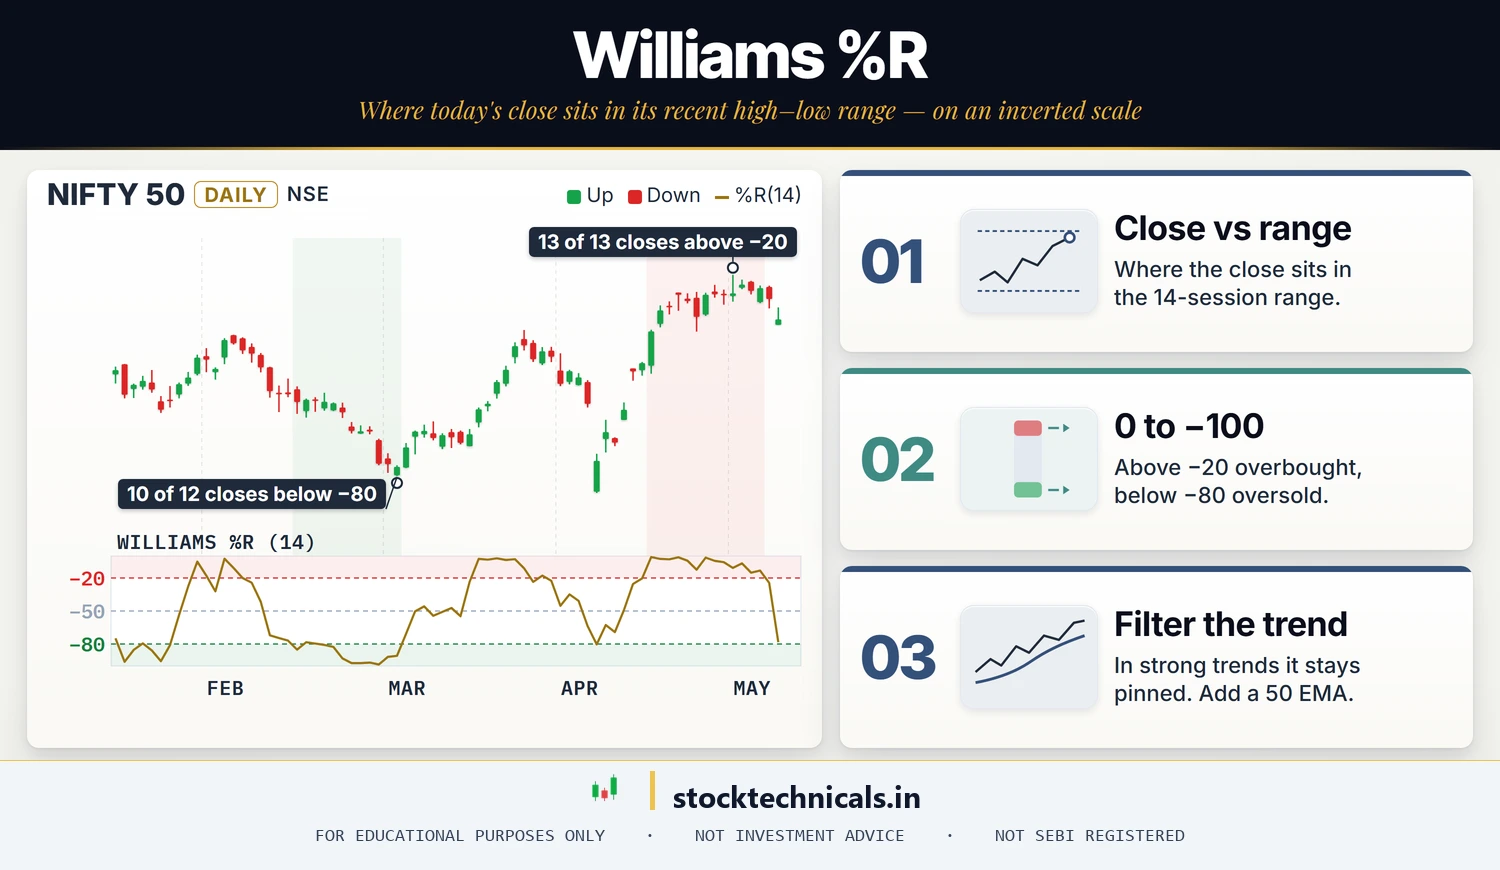
- Formula: %R = (Highest High − Close) / (Highest High − Lowest Low) × −100, typically over 14 periods.
- 0 to −20 = overbought; −80 to −100 = oversold. Middle zone (−20 to −80) is the trend body.
- Williams %R is a lead indicator — in strong trends it stays pinned in the extreme zone for long stretches. Reading “overbought” alone is not a sell signal.
- Best signals: divergence with price + failure swings (bounce from the extreme zone without making a new extreme reading).
- Always pair with a trend filter (20/50 EMA, higher-timeframe direction, or the Ichimoku cloud) — Williams %R alone produces too many signals in trending markets.
What Williams %R actually measures
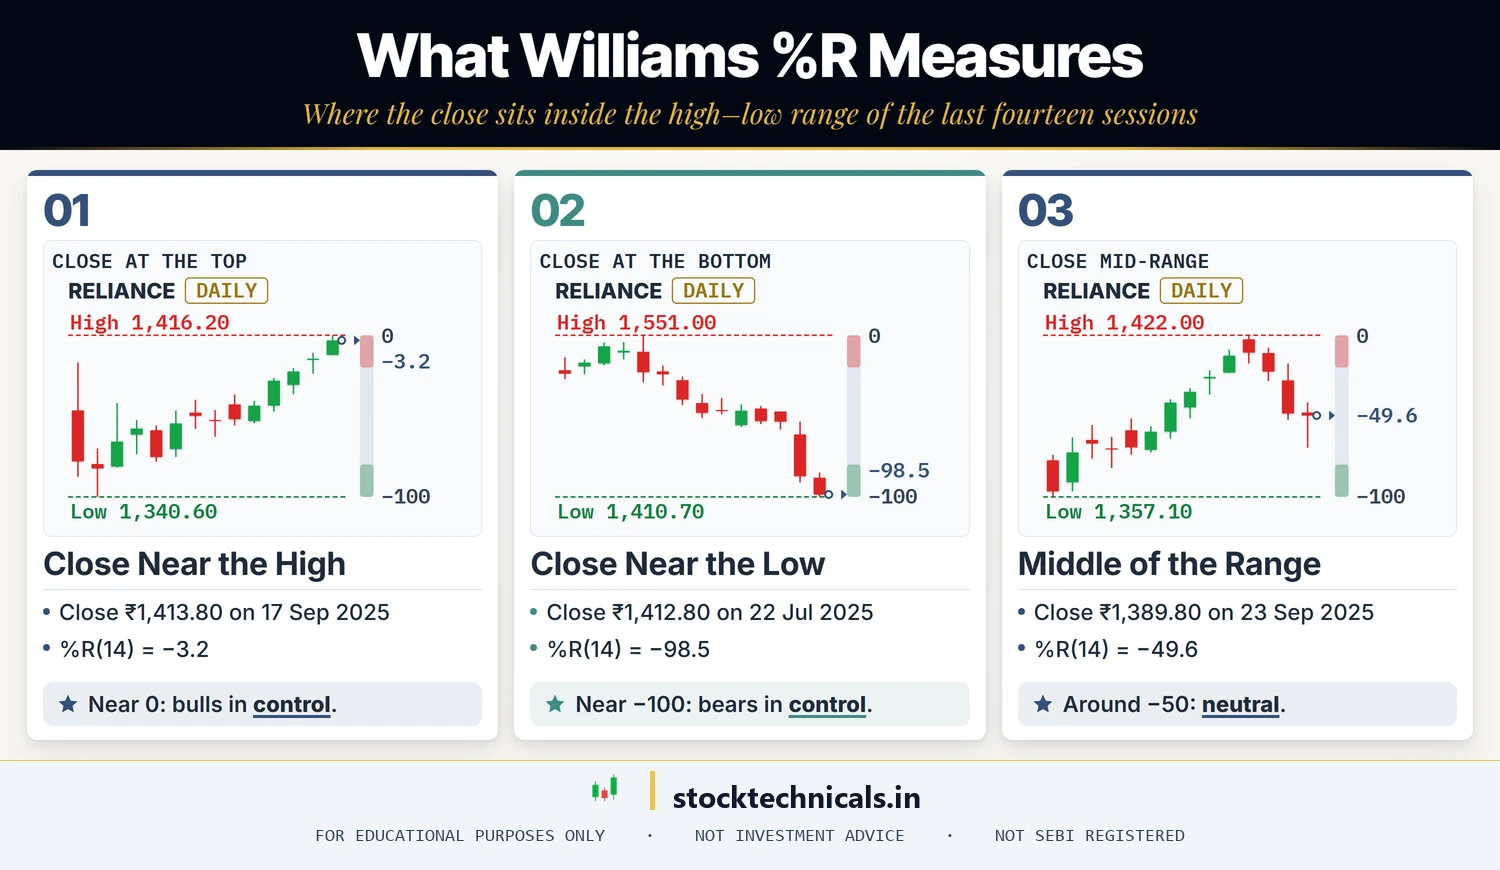
%R answers one question every period: where is today’s close relative to the highest high and lowest low of the last N periods?
- Close at or near the highest high → %R close to 0 → momentum bullish.
- Close at or near the lowest low → %R close to −100 → momentum bearish.
- Close in the middle of the range → %R around −50 → neutral.
Because the measurement is entirely a position-within-range calculation, Williams %R reacts quickly to fresh breakouts and breakdowns. That speed is its main edge over slower oscillators like RSI.
The Williams %R formula
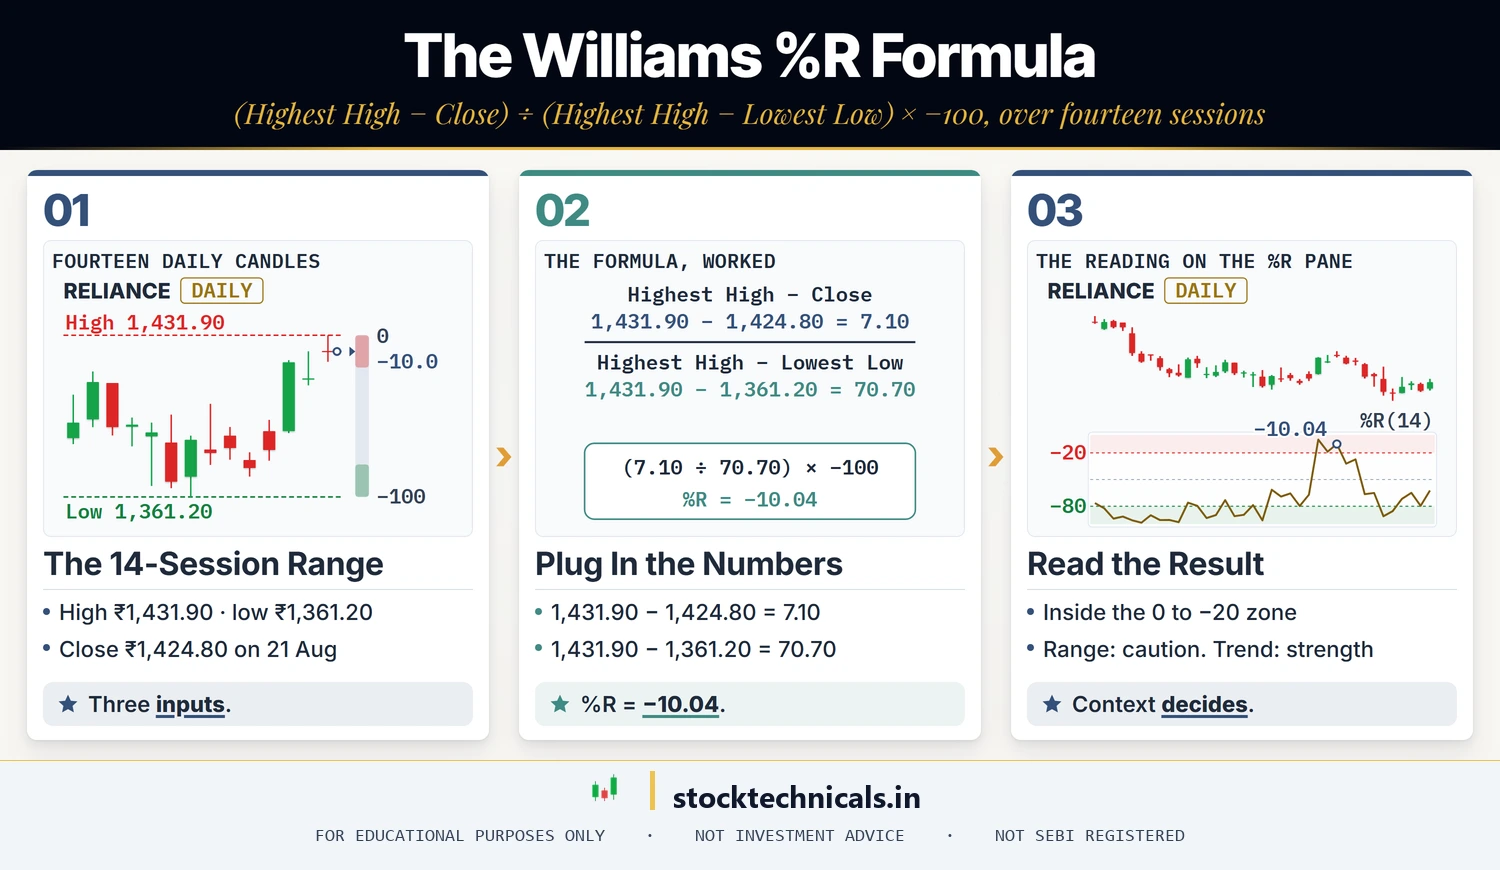
The standard 14-period formula:
%R = [(Highest High over 14 periods − Today’s Close) / (Highest High − Lowest Low)] × −100
Take Reliance over the 14 sessions to 21 Aug 2025: the highest high was ₹1,431.90 and the lowest low was ₹1,361.20. The close on 21 Aug was ₹1,424.80.
- Numerator: 1,431.90 − 1,424.80 = 7.10
- Denominator: 1,431.90 − 1,361.20 = 70.70
- %R = (7.10 / 70.70) × −100 = −10.04
A reading of −10.04 means today’s close is sitting right under the 14-period high. That is a strongly overbought condition. In a range-bound tape, this would warrant caution on new longs; in a strong trend, it signals ongoing strength.
How to read Williams %R on a live chart
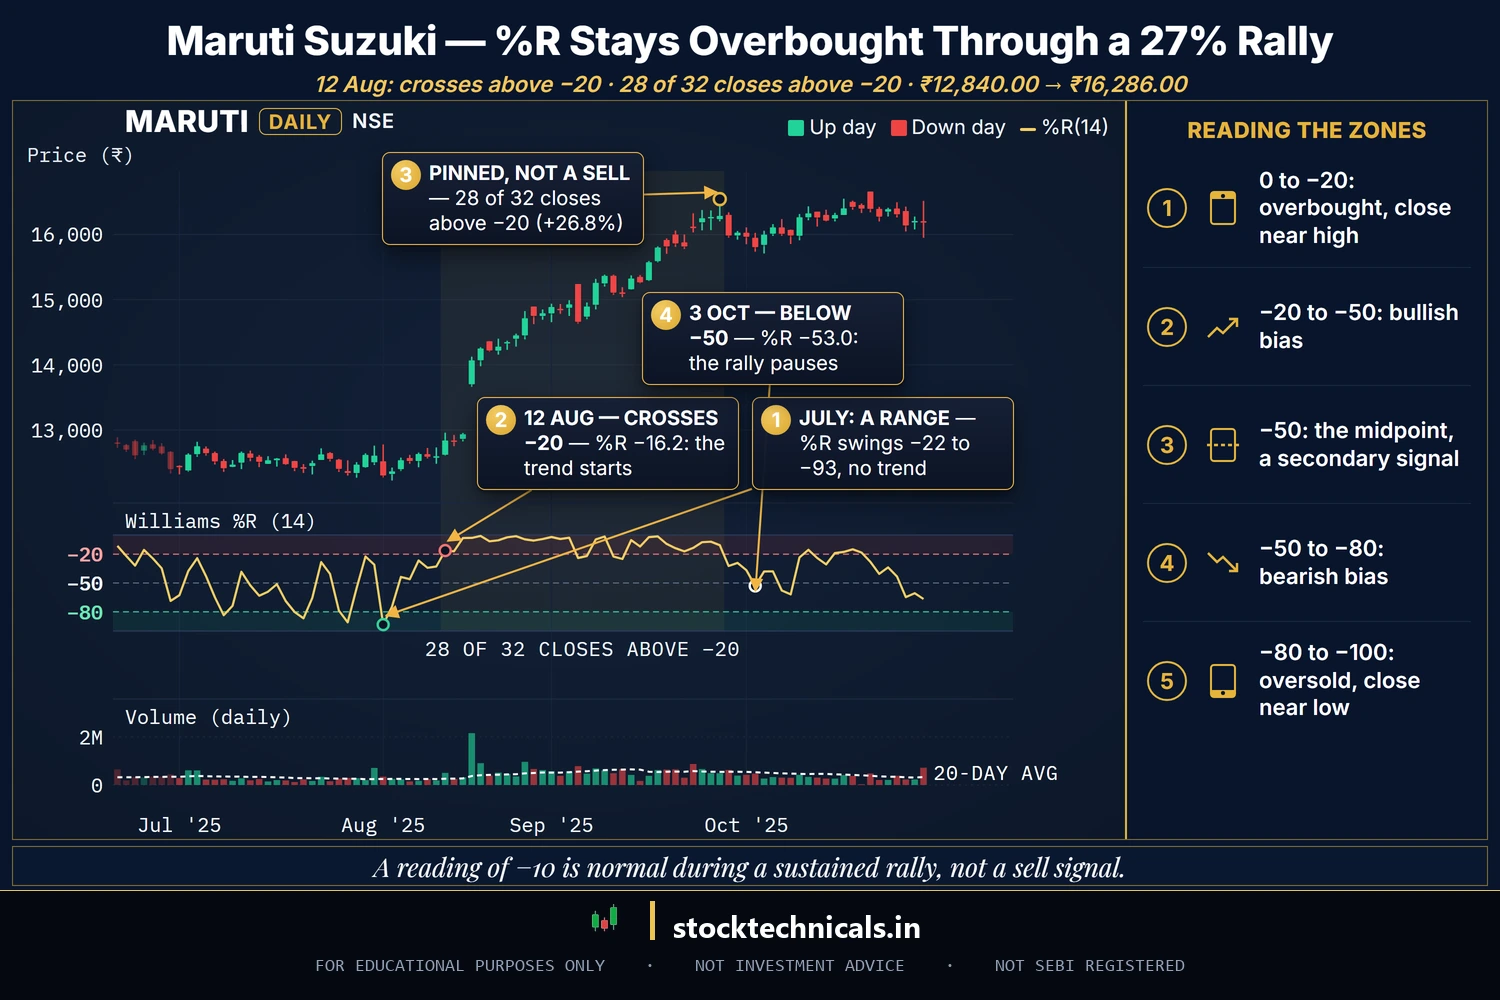
Chart window: Jun 2025–Oct 2025 · Data refreshed 10 Apr 2026 · Source: NSE (daily OHLC)
- 0 to −20 (overbought zone) — close is within the top 20% of the 14-period range. Bullish momentum, but late-stage in a range.
- −20 to −50 (upper neutral) — bullish bias, healthy trend territory.
- −50 (midpoint) — momentum equilibrium. Trend crossing through −50 is a secondary signal.
- −50 to −80 (lower neutral) — bearish bias, down-trend body.
- −80 to −100 (oversold zone) — close is in the bottom 20% of the 14-period range. Bearish momentum, but late-stage in a range.
Key nuance that beginners miss: in a strong trend, Williams %R stays stuck in the extreme zone for long stretches. A reading of −10 is normal during a sustained rally, not a sell signal. That’s why you need a trend filter before acting on “overbought” alone.
The three Williams %R signals worth trading
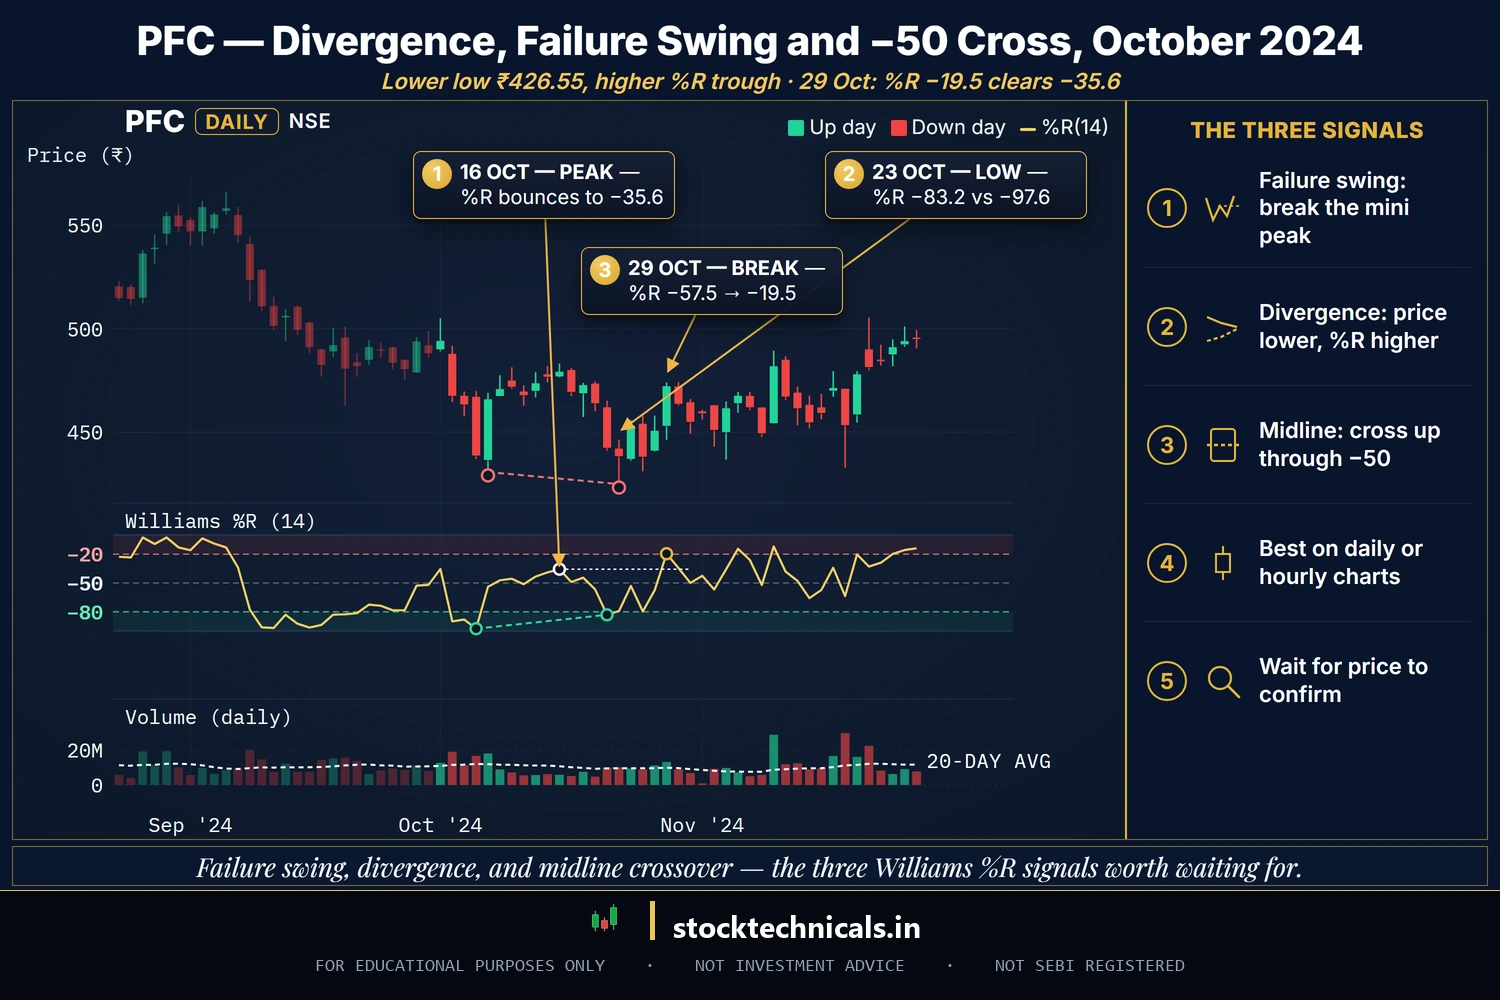
Chart window: Aug 2024–Nov 2024 · Data refreshed 10 Apr 2026 · Source: NSE (daily OHLC)
Failure swing
A “failure swing” is Williams %R’s cleanest reversal signal. In a downtrend: %R drops below −80, rallies back above −80, then dips without making a new low reading, then breaks its mini peak. That’s a bullish failure swing — momentum is exhausting.
Mirror logic for a bearish failure swing in an uptrend: %R climbs above −20, pulls back, rallies again without making a new high, then breaks the mini trough below −20.
Divergence with price
Bullish divergence: price prints a lower low but Williams %R prints a higher low (shallower oversold reading). Selling pressure is fading even though price keeps drifting.
Bearish divergence: price prints a higher high but Williams %R prints a lower high. Buying pressure is fading even though price keeps grinding up.
Divergence signals work best on daily or hourly charts. On 5-minute charts, divergence fires too often to be reliable.
Midline crossover
%R crossing the −50 line is a momentum flip. Cross up through −50 = bullish bias shift. Cross down through −50 = bearish. This is a slower, higher-conviction signal — good for swing traders who want a single binary bias indicator.
Williams %R vs Stochastic Oscillator
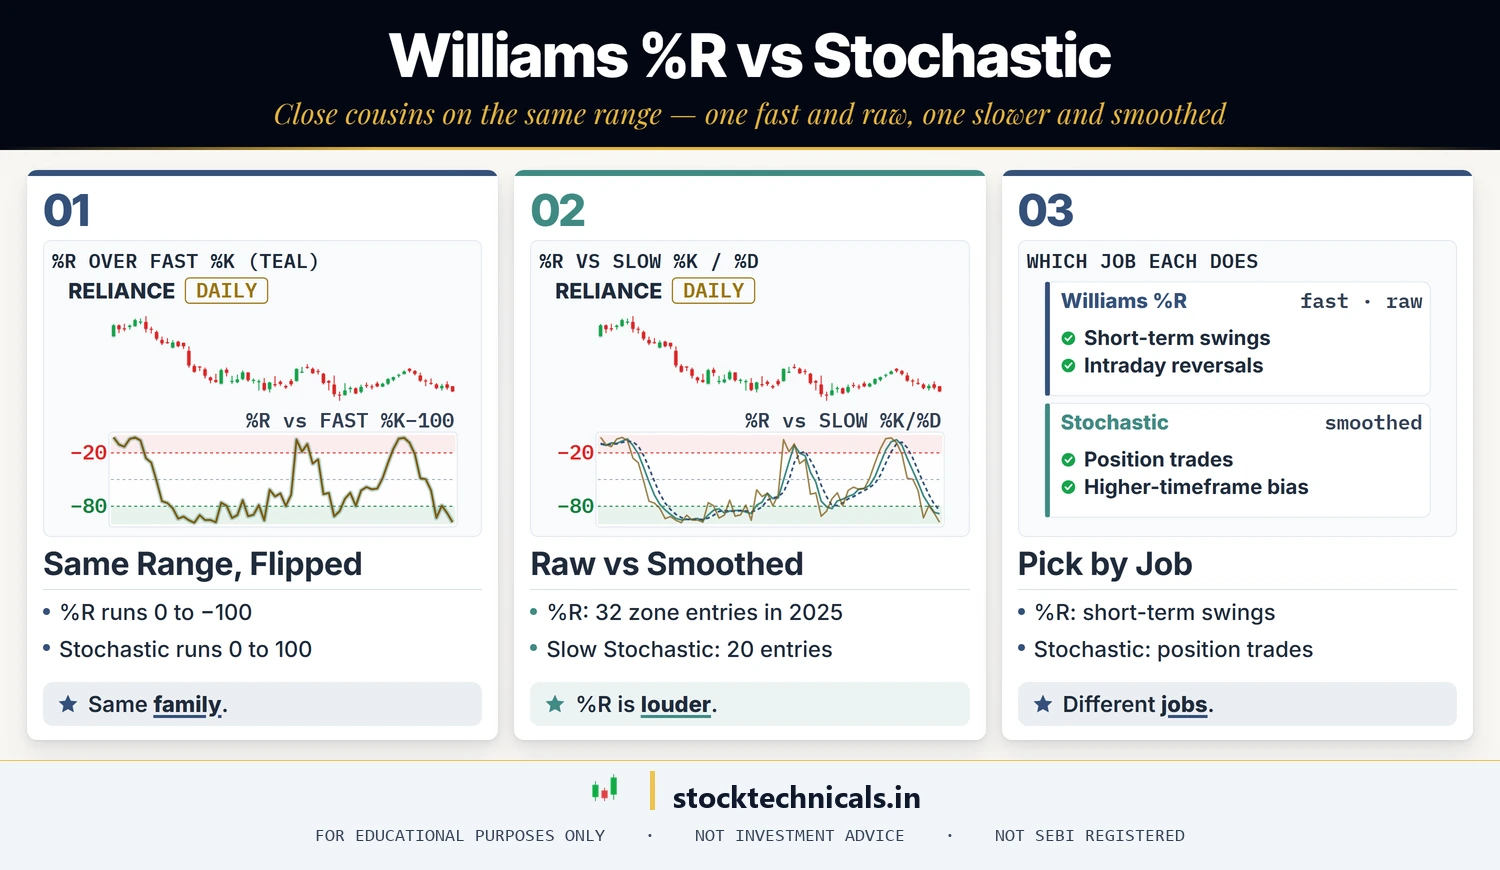
Williams %R and the Stochastic Oscillator are close cousins — both compare close to range. The differences matter in practice:
- Scale: %R is 0 to −100. Stochastic is 0 to 100.
- Smoothing: Williams %R is raw (no smoothing). Stochastic has two smoothed lines (%K and %D).
- Signal count: %R fires more signals because it’s unsmoothed — that’s a feature when you want speed, a bug when you want clean signals.
- Divergence: both work for divergence, but %R’s extremes make it visually easier to spot.
Rule of thumb: use Williams %R when you need speed (short-term swings, intraday reversals). Use Stochastic when you want smoother signals (position trades, higher-timeframe bias).
How to add Williams %R on TradingView, Zerodha Kite, Angel One, Groww
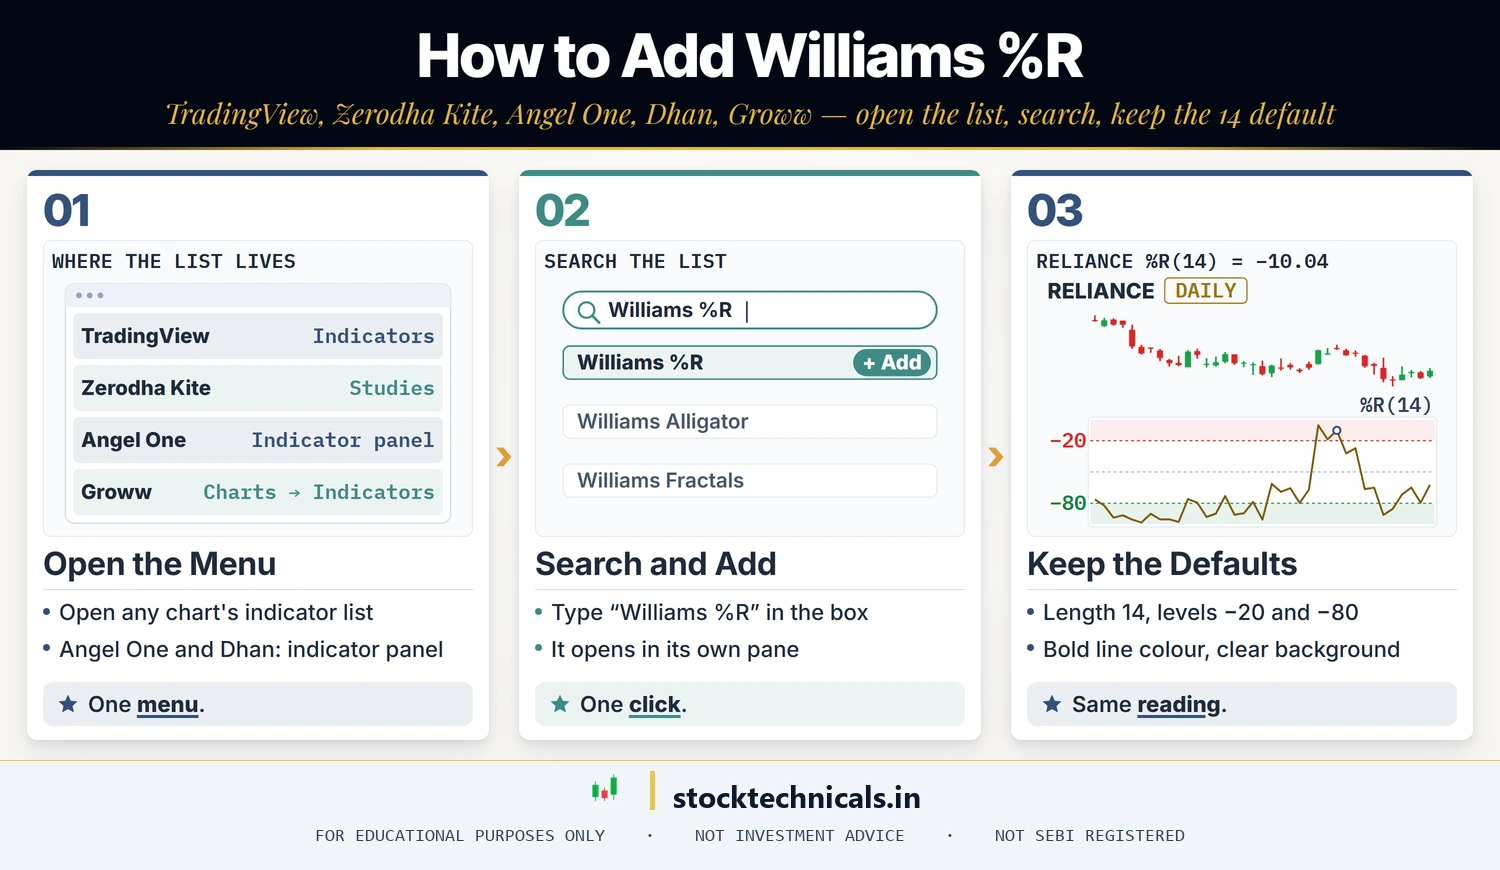
- TradingView — Indicators menu → search “Williams %R” → add. Default period 14, keep it. Set line colour to something bold against your chart background.
- Zerodha Kite — Studies → search “Williams %R” → add. Default 14. Check that the levels sit at −20 and −80.
- Angel One / Dhan — Indicator panel → Williams %R. Parameters identical.
- Groww — Charts tab → Indicators → Williams %R. The default period is 14.
All five platforms use the standard formula, so on the same price data they should show the same reading. Check your plan on TradingView if you want alerts on indicator level crosses.
Combining Williams %R with other indicators
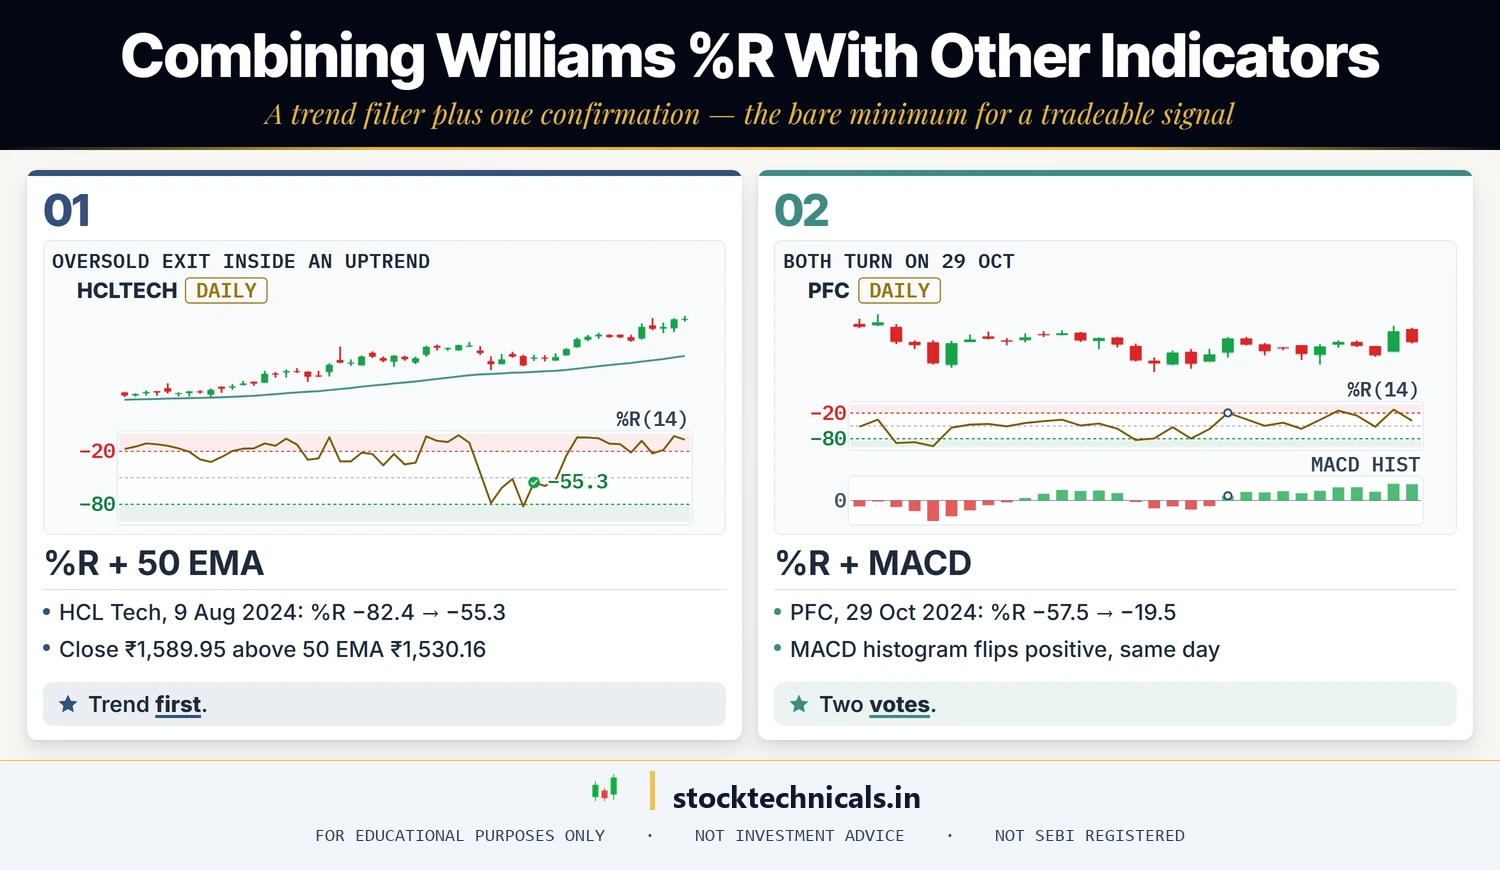
%R + 50 EMA — the trend-filtered setup
Take long signals only when price is above the 50 EMA. Take short signals only when price is below. In our experience, this single filter cuts down the false signals Williams %R generates in trending markets (see EMA Basics).
%R + MACD — momentum confirmation
A Williams %R failure swing with a MACD histogram flip in the same direction is a much higher-conviction signal than either alone (see MACD Basics).
%R + support/resistance
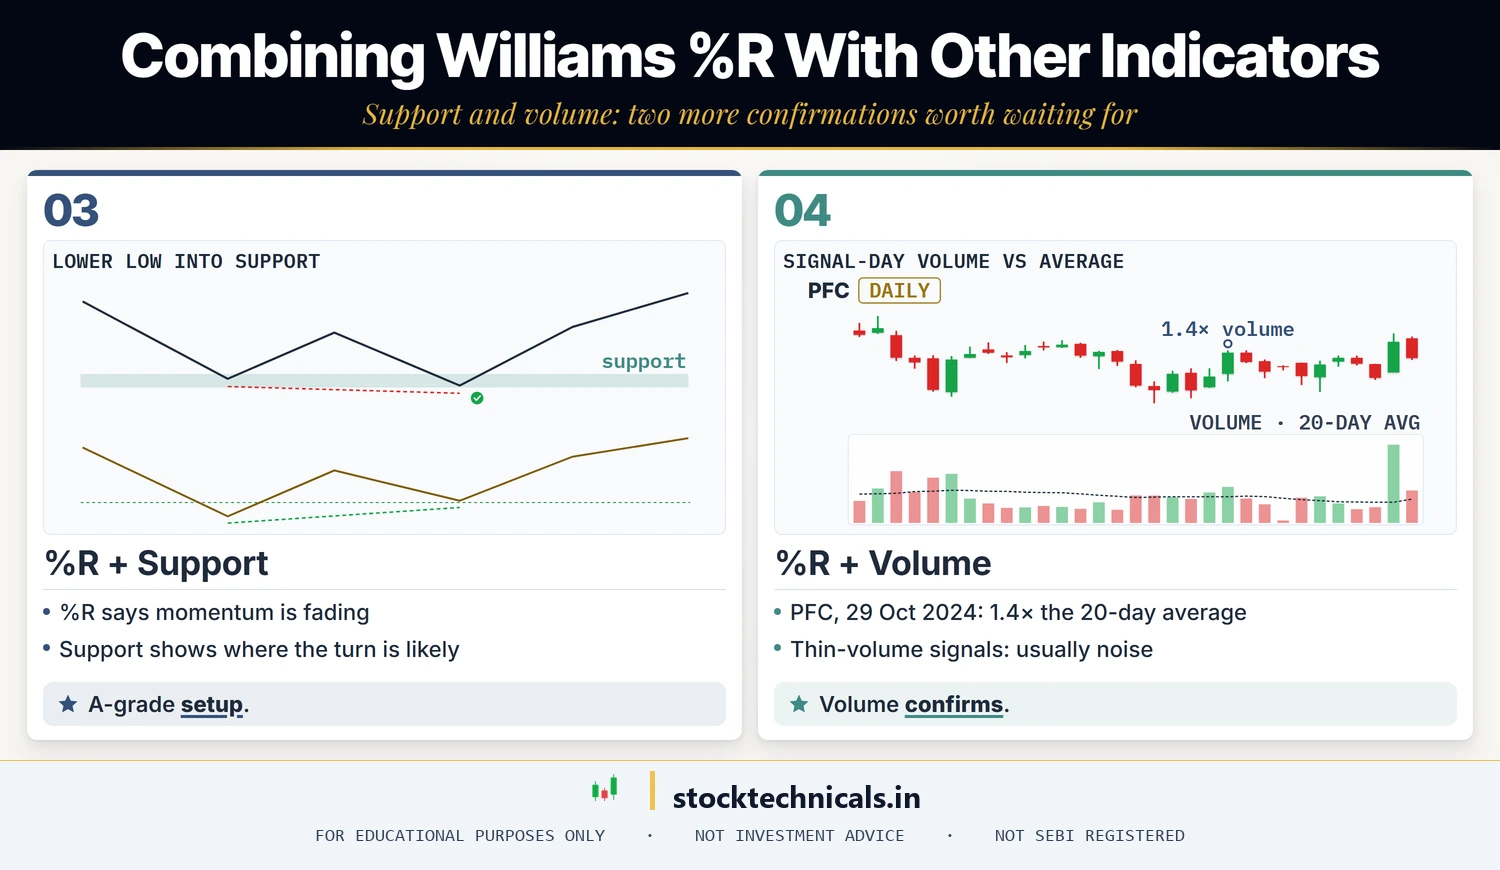
A bullish divergence that fires exactly at a horizontal support zone is an A-grade setup. Williams %R alone tells you momentum is fading; support tells you where the reversal is likely to happen.
%R + volume
A reversal signal on above-average volume is real. The same signal on below-average volume is usually noise.
Multi-timeframe Williams %R

A practical framework: use the higher timeframe for bias, the lower timeframe for entry.
- Daily %R — sets the bias. Above −50 = long-biased. Below −50 = short-biased.
- Hourly %R — finds the setup. Look for failure swings or divergences in the direction of the daily bias.
- 15-minute %R — times the entry. A fresh cross from the extreme zone is your trigger candle.
Three timeframes agreeing is rare but produces the highest-conviction trades in the Williams %R playbook.
Five rules for Williams %R trading
Never trade “overbought” alone
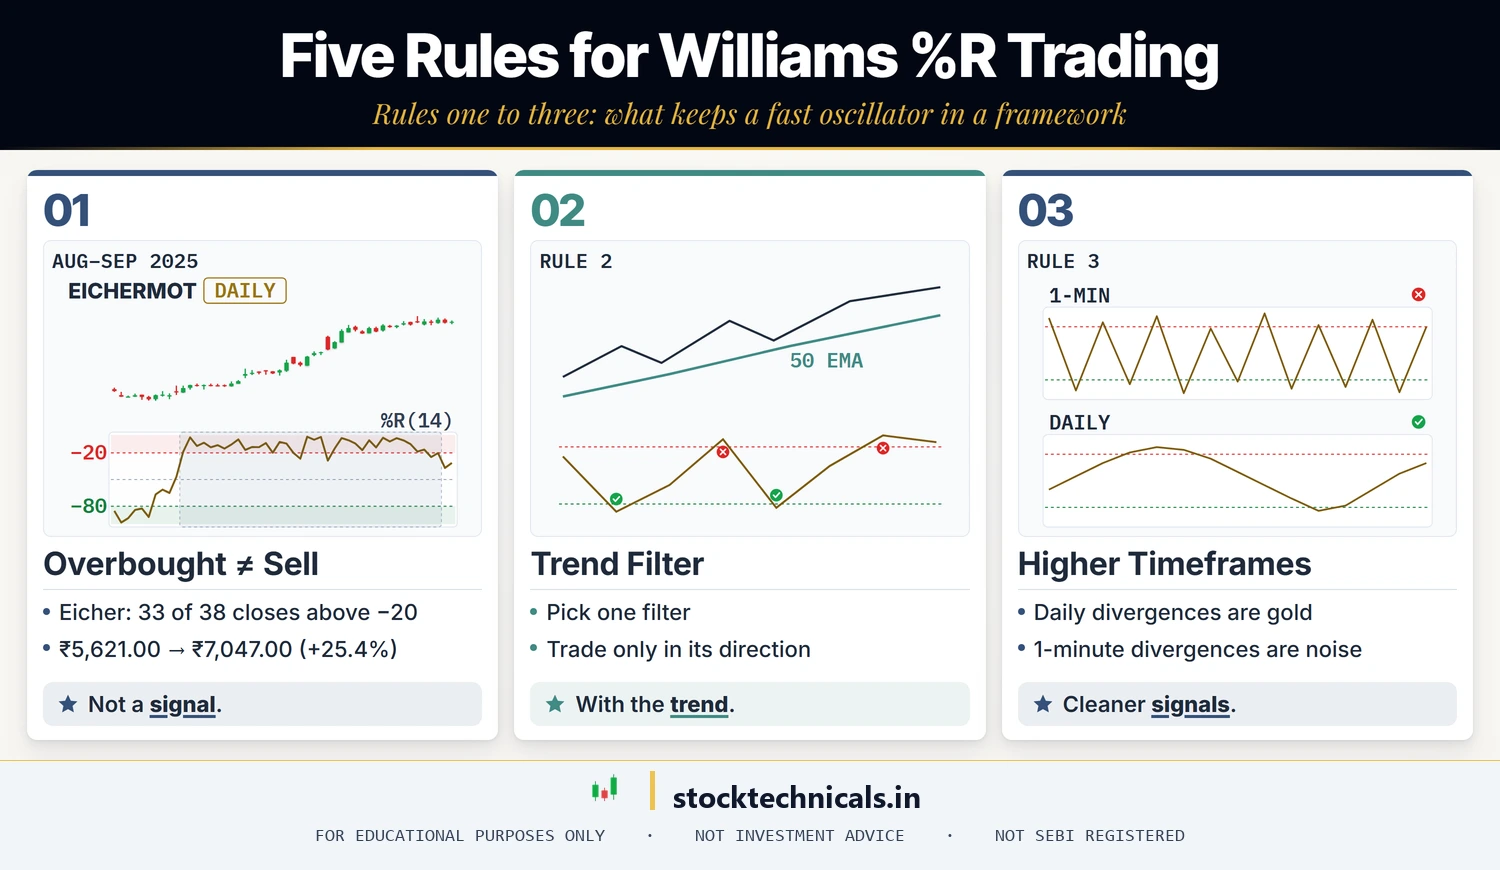
In strong trends, %R stays pinned above −20 (or below −80) for weeks. Overbought is not a sell signal by itself. Wait for a failure swing or divergence.
Always use a trend filter
50 EMA, higher-timeframe bias, Ichimoku cloud — pick one. Filter Williams %R signals through it. Trade only in the direction of the filter.
Higher timeframes, cleaner signals
15-minute or higher. Divergences on daily are gold. 1-minute divergences are noise.
Confirm with price structure
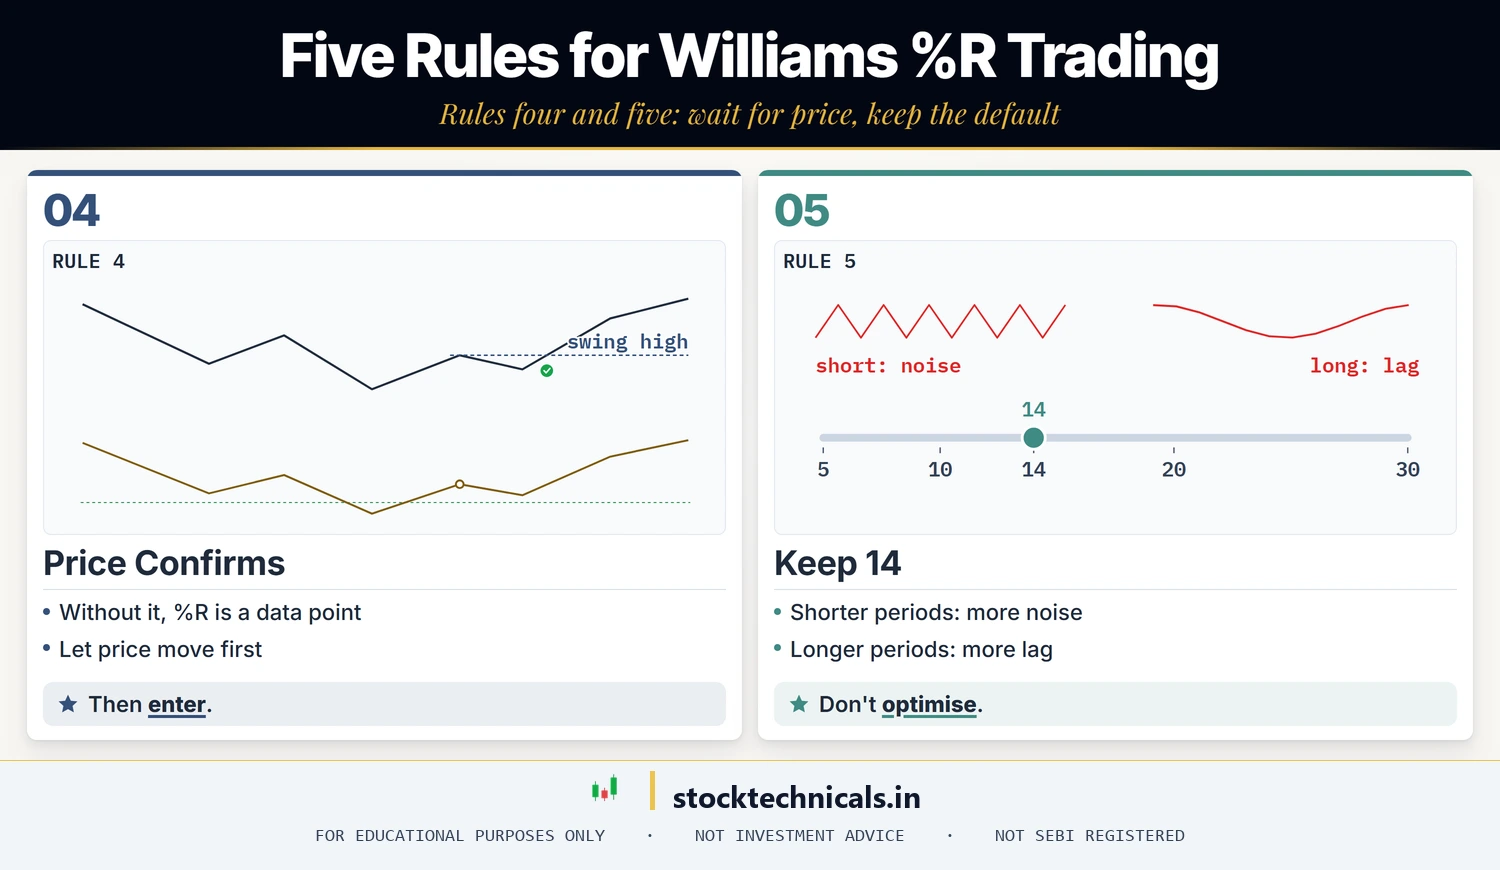
A Williams %R signal without a corresponding price action confirmation (candle, break of a swing high/low) is just a data point. Wait for the price structure to move before entering.
Keep the default 14-period setting
Shorter periods produce noise; longer periods lag. 14 is the usual platform default. Don’t optimise without strong out-of-sample evidence.
Pre-trade checklist
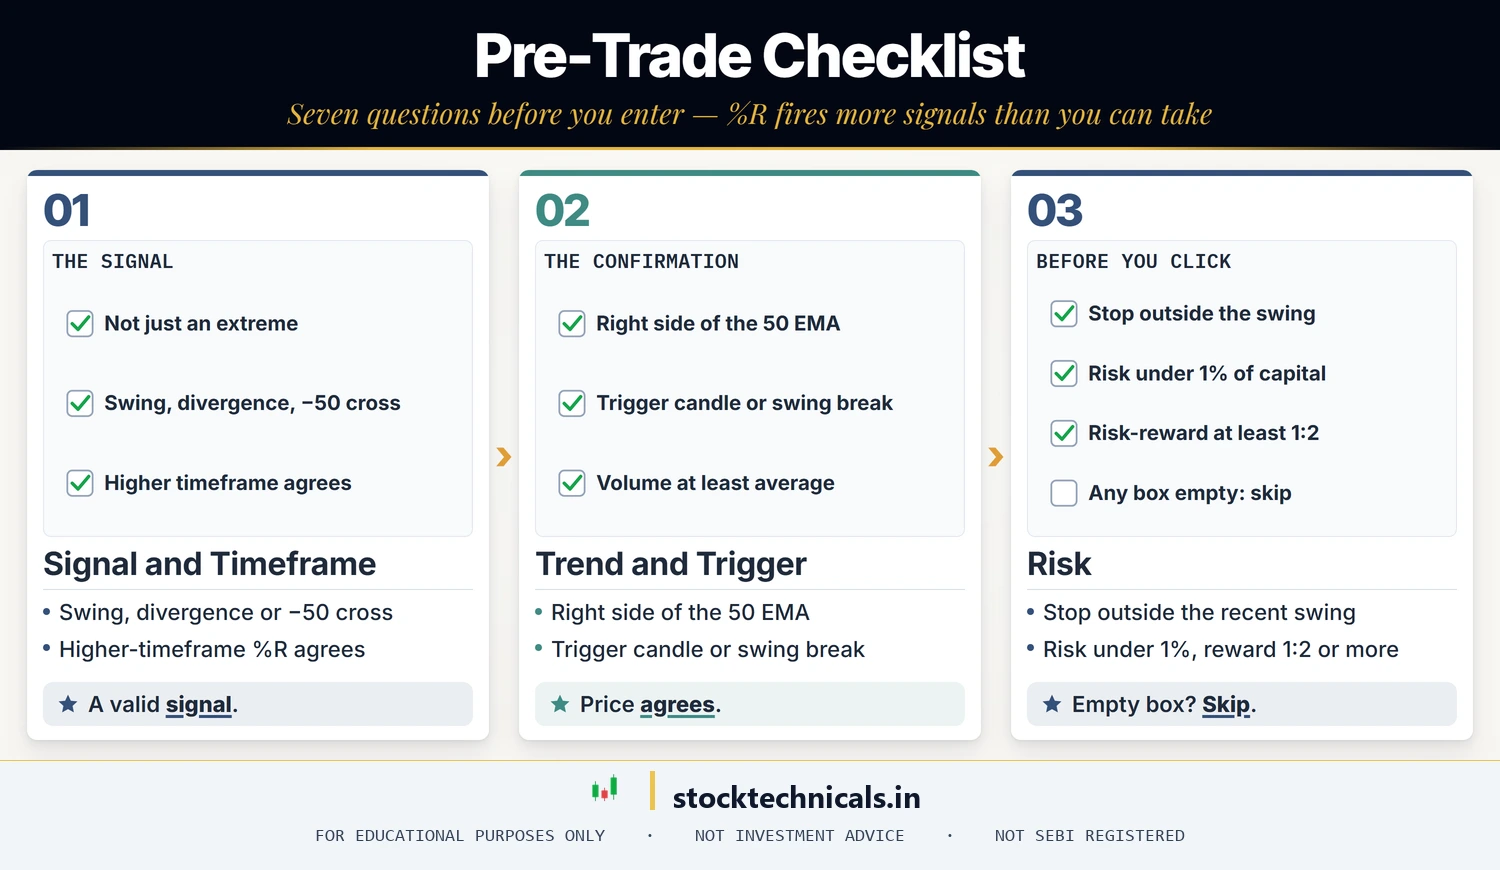
- Is my signal a failure swing, divergence, or midline crossover — not just an extreme reading?
- Does the higher-timeframe Williams %R agree (daily if I’m on hourly)?
- Is price on the correct side of the 50 EMA?
- Is there a price-action trigger candle (swing break, engulfing, pinbar)?
- Is volume at least average on the trigger candle?
- Is my stop outside the recent swing, sized to < 1% of capital?
- Is risk-reward at least 1:2?
If any answer is no, skip. %R fires more signals than you can take — be selective.
Five common Williams %R mistakes
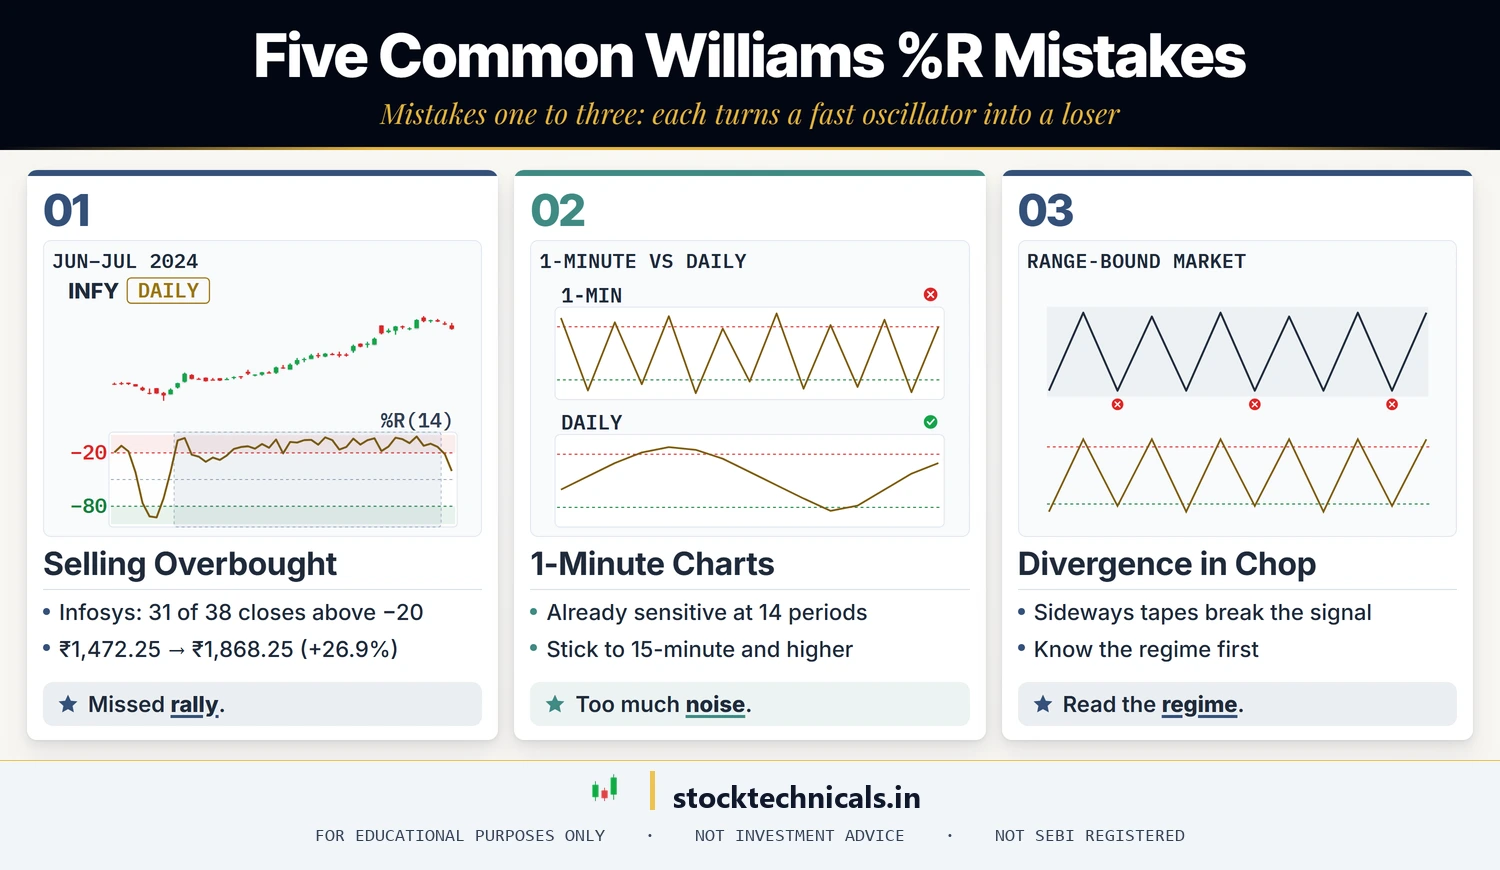
Selling every time %R hits the overbought zone
In uptrends, %R will live in the 0 to −20 zone for extended runs. Selling every hit of overbought is how traders miss entire multi-week rallies.
Trading %R on 1-minute charts
Williams %R is already sensitive at 14 periods. On 1-minute charts the signal-to-noise ratio collapses. Stick to 15-minute and higher.
Ignoring divergence rules on range-bound markets
In choppy, sideways tapes, divergence signals fire constantly and fail often. Know the market regime first — %R divergence is a trend-following tool, not a chop-buster.
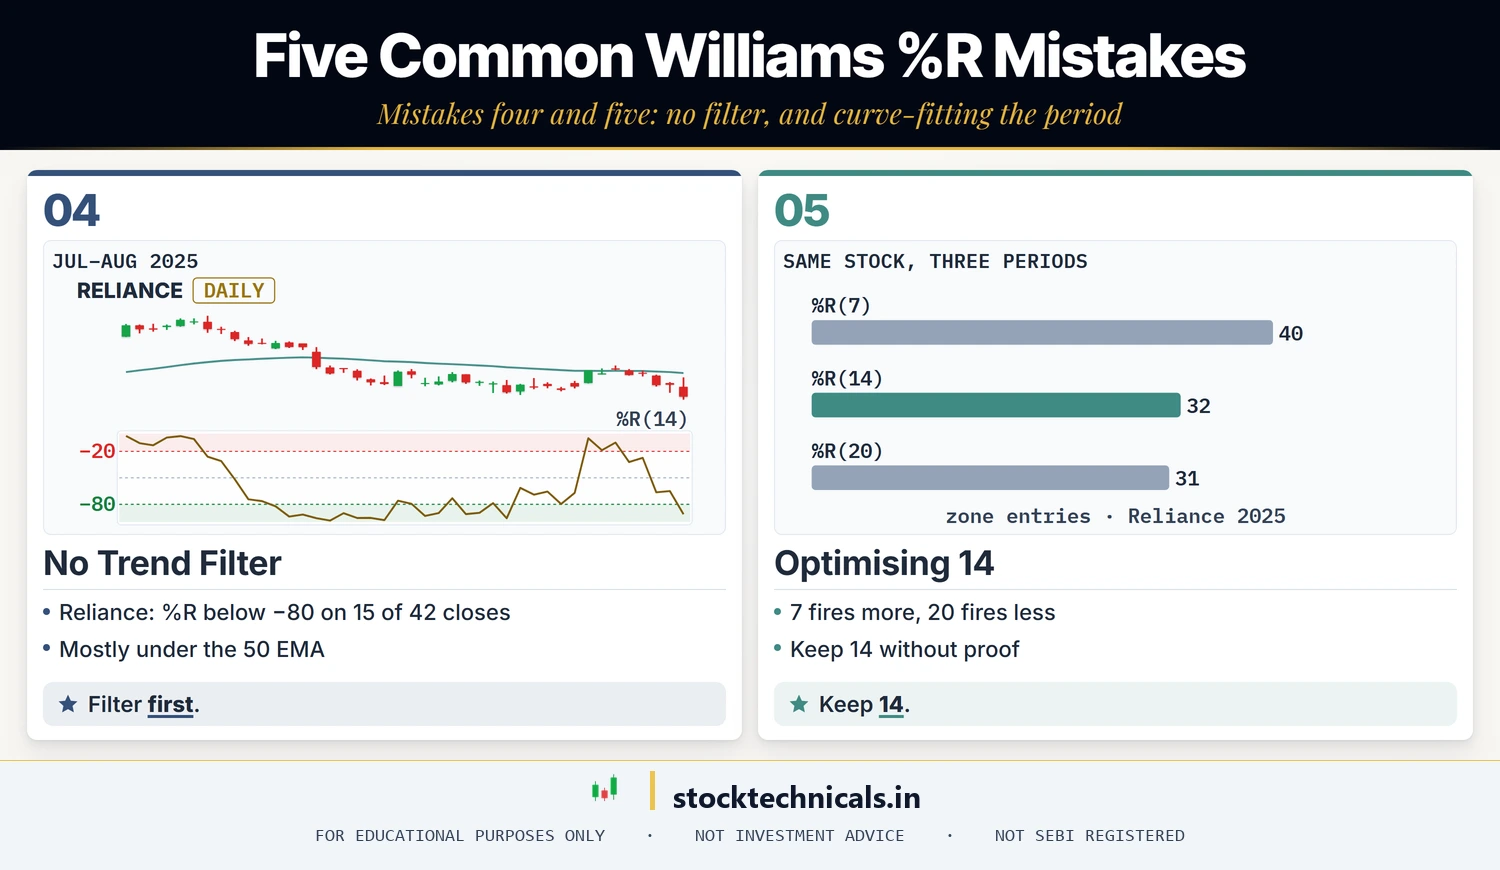
No trend filter
The single most common beginner error. Williams %R without a trend filter is a losing trade generator in trending markets.
Optimising the period parameter
Traders who change 14 to 7 or 20 looking for better results are almost always curve-fitting their recent data. 14 is the widely used default — keep it unless you have strong out-of-sample evidence.
Williams %R vs other oscillators — quick comparison
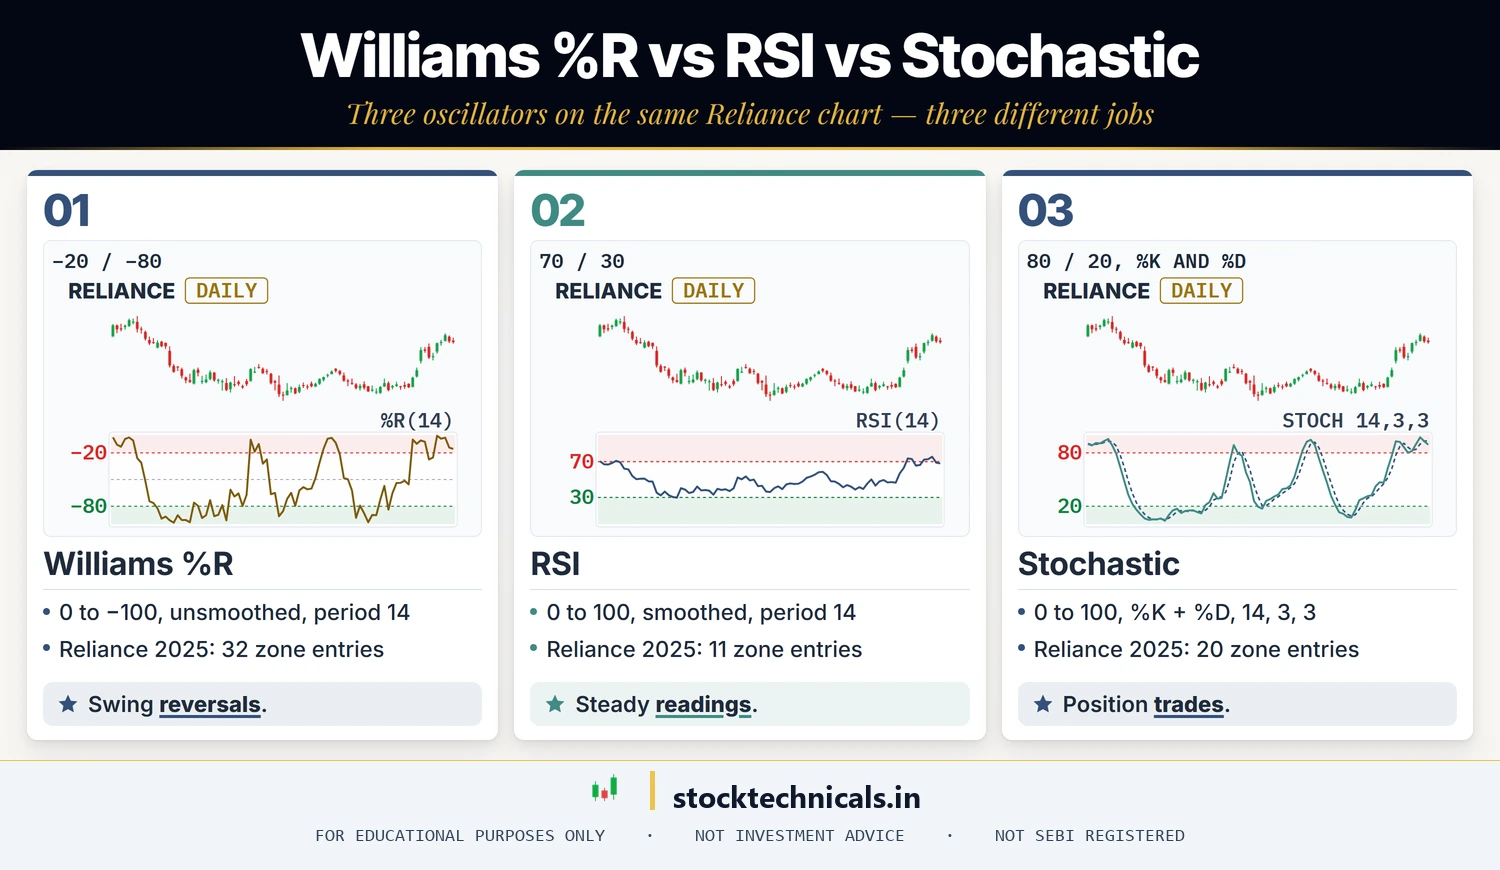
| Feature | Williams %R | RSI | Stochastic |
|---|---|---|---|
| Scale | 0 to −100 | 0 to 100 | 0 to 100 (%K + %D) |
| Smoothing | None | Exponential | Moving average |
| Speed | Fast | Medium | Medium-slow |
| Signal volume | High | Low | Medium |
| Best for | Swing reversals, divergence | Overbought/oversold, divergence | Position trades, smoother bias |
| Default period | 14 | 14 | 14, 3, 3 |
Why does Williams %R use a negative scale?
Larry Williams developed it with an inverted scale that puts strong momentum at the top (near 0) and weakness at the bottom (near −100). It’s a cosmetic choice, not a mathematical necessity — add 100 and you get the Fast Stochastic %K.
Is Williams %R better than RSI?
Not better, just different. Williams %R is faster and less smoothed, so it fires earlier and louder. RSI is steadier and produces fewer but more reliable signals. Most disciplined traders use both: Williams %R for swing-trade timing, RSI for bias confirmation.
Can Williams %R be used for intraday trading?
Yes, on 15-minute and higher timeframes. Below 15-minute the noise ratio rises sharply and signal reliability drops. For scalping specifically, Camarilla pivots or VWAP tend to work better than %R.
Does Williams %R work on indices like Nifty 50 and Bank Nifty?
Yes. Williams %R is instrument-agnostic because it’s derived entirely from price. You can apply it to Nifty 50 and Bank Nifty like any other chart, but it still needs a trend filter.
What’s the best Williams %R setting?
The default 14-period. Shorter settings tend to add noise and longer settings tend to lag. Use 14 and put your energy into trend filtering and risk management instead.
Can I use Williams %R for options trading?
Yes, as a directional signal. Williams %R divergence at a key strike with a MACD histogram flip is a viable signal for buying calls or puts. Don’t use it for straddles or complex spreads where you need volatility forecasts — %R doesn’t measure volatility, only momentum.
What’s the single most useful Williams %R signal for a beginner?
Divergence. It’s visually obvious, fires rarely enough that you can act on each one, and when combined with a 50 EMA trend filter it gives a more workable setup. Failure swings are arguably cleaner but harder to spot live.
Test Your Knowledge
Q1: What scale does Williams %R use?
Q2: A reading of −10 means:
Q3: In a strong uptrend, Williams %R will often:
Q4: Which is the cleanest reversal signal in %R?
Q5: The mandatory companion for Williams %R signals is:
Your next step
Williams %R is almost always stronger when paired with a slower momentum tool. Read RSI Basics next and stack RSI (14) under your %R on the same chart — the combination filters out most of %R’s false signals in trending markets.
The Bottom Line
Williams %R is fast, sensitive, and noisy. In trending markets it stays stuck at the extremes for weeks; in ranging markets it prints signals that mostly work; in chop it prints signals that mostly don’t. A trend filter and a price-action confirmation are not up for debate. Use failure swings and divergence, ignore simple overbought/oversold reads, keep the 14 default, and let %R do what it’s best at: early warnings inside a framework you already trust.
Educational content only — not SEBI-registered investment advice. Momentum oscillators including Williams %R improve probability, they do not remove loss. Signals fail regularly, especially without trend context. Size every trade so a full stop-out costs less than 1% of capital. Never trade with borrowed money.