
Pivot points are pre-calculated support and resistance levels derived from the previous session’s high, low, and close. A Central Pivot (P) sits in the middle, with three resistance levels (R1, R2, R3) above and three support levels (S1, S2, S3) below. Intraday traders use them as objective reference lines for entries, targets, and stops — no drawing, no opinion, same numbers for every trader on the screen.
Intraday traders on Nifty 50, Bank Nifty, and NSE large caps who want mechanical, opinion-free support/resistance levels before the market opens. Also useful for options traders who need clean reference points for strike selection and for swing traders who want a structured weekly or monthly framework.
Support and resistance lines drawn by hand are subjective — everyone’s chart looks a little different. Pivot Points remove the subjectivity. They are calculated from the previous session’s price data using a single formula, and every trader who uses them sees the exact same levels to the rupee. That uniformity is why institutional desks and retail intraday traders both care about them.
The classic formula was developed by floor traders decades before algorithms — it still survives in every modern platform because it works. In this guide you’ll learn how Pivot Points are calculated, how to trade bounces and breakouts, which variants (Fibonacci, Camarilla, Woodie, DeMark) suit which trading styles, and the five rules that keep Pivot trading rule-based instead of reactive.
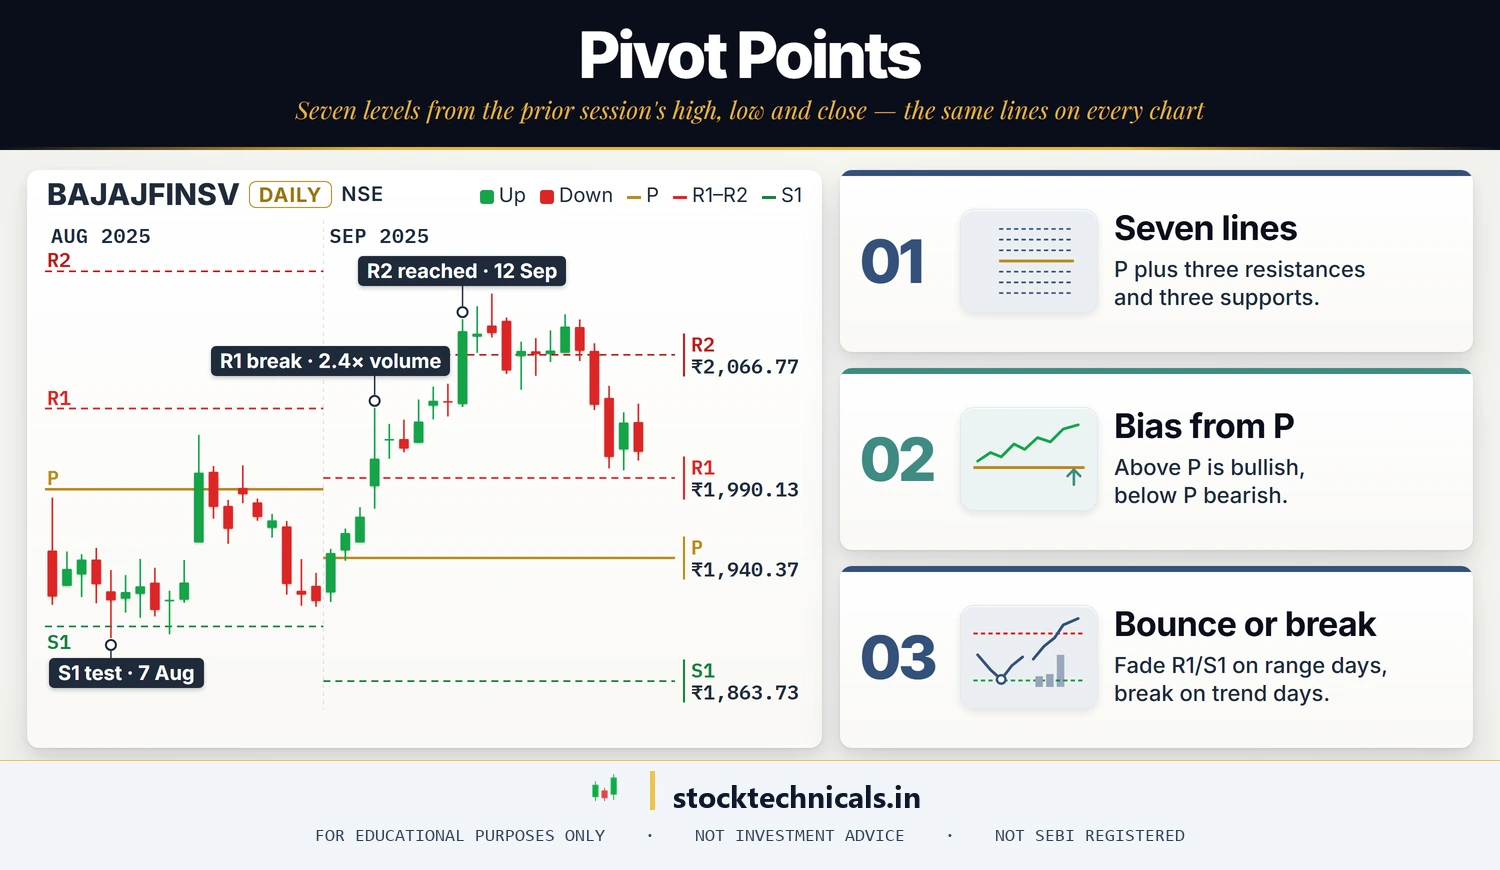
- Pivot formula: P = (High + Low + Close) / 3 — all other levels derive from P.
- Price above P all session = bullish day bias. Price below P = bearish bias. Price flipping around P = chop, stay out.
- R1 and S1 are the most-tested levels; R2/S2 are strong-trend targets; R3/S3 are outlier day extremes.
- Two main trades: bounce off a level (range day), breakout through a level (trend day). Don’t run both in the same session.
- Variants matter: Classic for general use, Fibonacci for confluence with other tools, Camarilla for tight-range intraday scalps.
What Pivot Points are — and why they still work
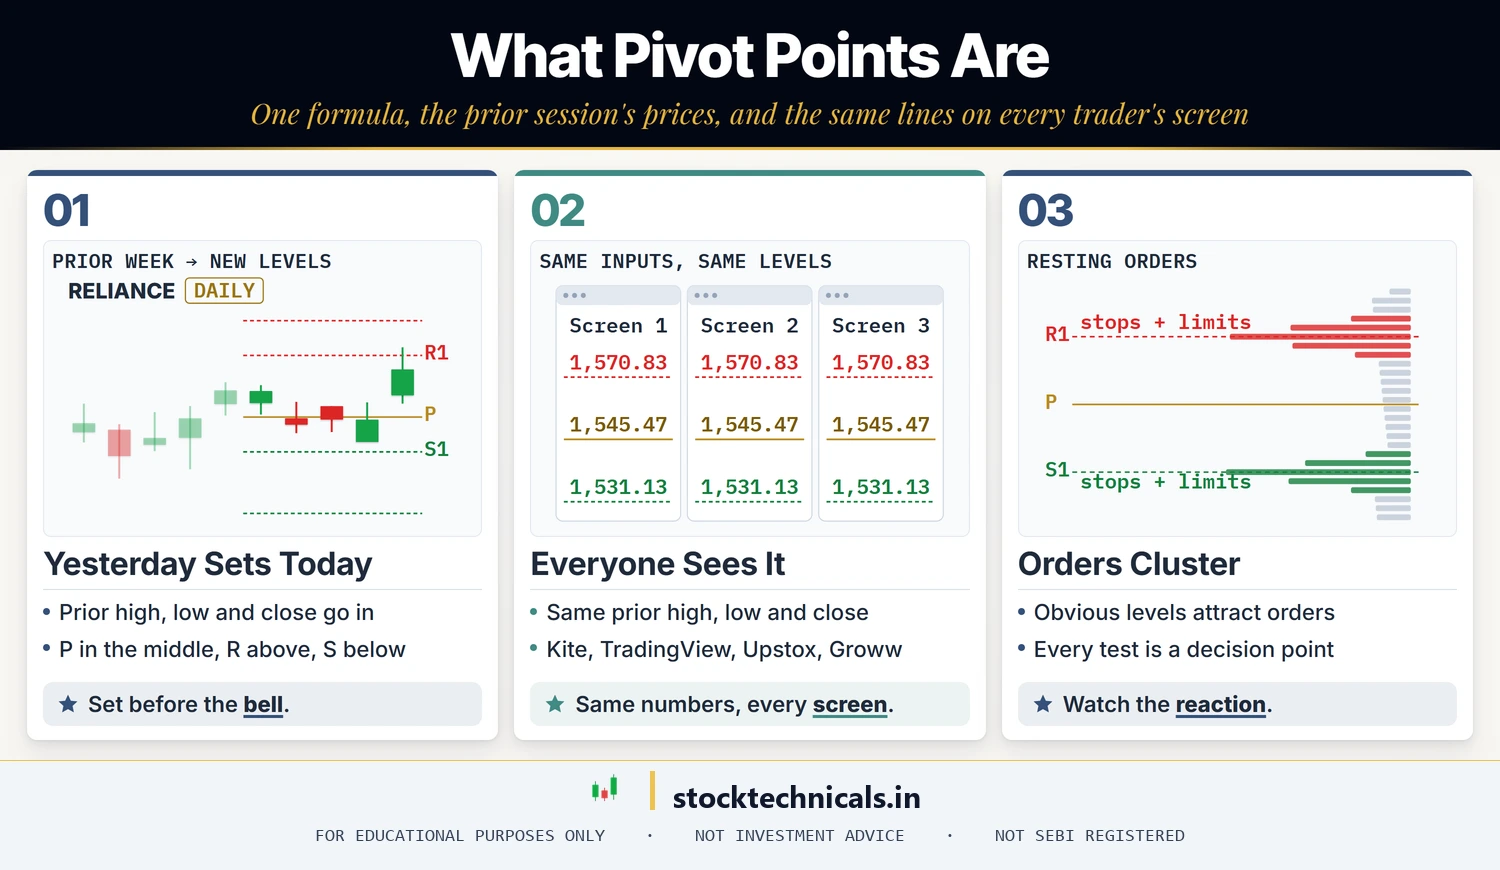
A Pivot Point is a level calculated from the previous trading session’s data that a trader uses as the anchor for the next session’s expected range. The idea is old: floor traders on open-outcry pits would calculate a pivot before the open, mark their resistances and supports, and treat every test of those lines as a decision point.
Two reasons they still work in the algo era:
- Universal agreement. Every major charting platform — Zerodha Kite, TradingView, Upstox, Groww — calculates P, R1, R2, S1 and S2 from the same previous-session high, low and close. When a level matters, everyone sees it.
- Order clustering. Stop-losses and entry limits cluster around R1 and S1 because that’s where the obvious reference is. Institutional algos know this and often engineer moves into those levels to harvest stops.
The classic Pivot Point formula
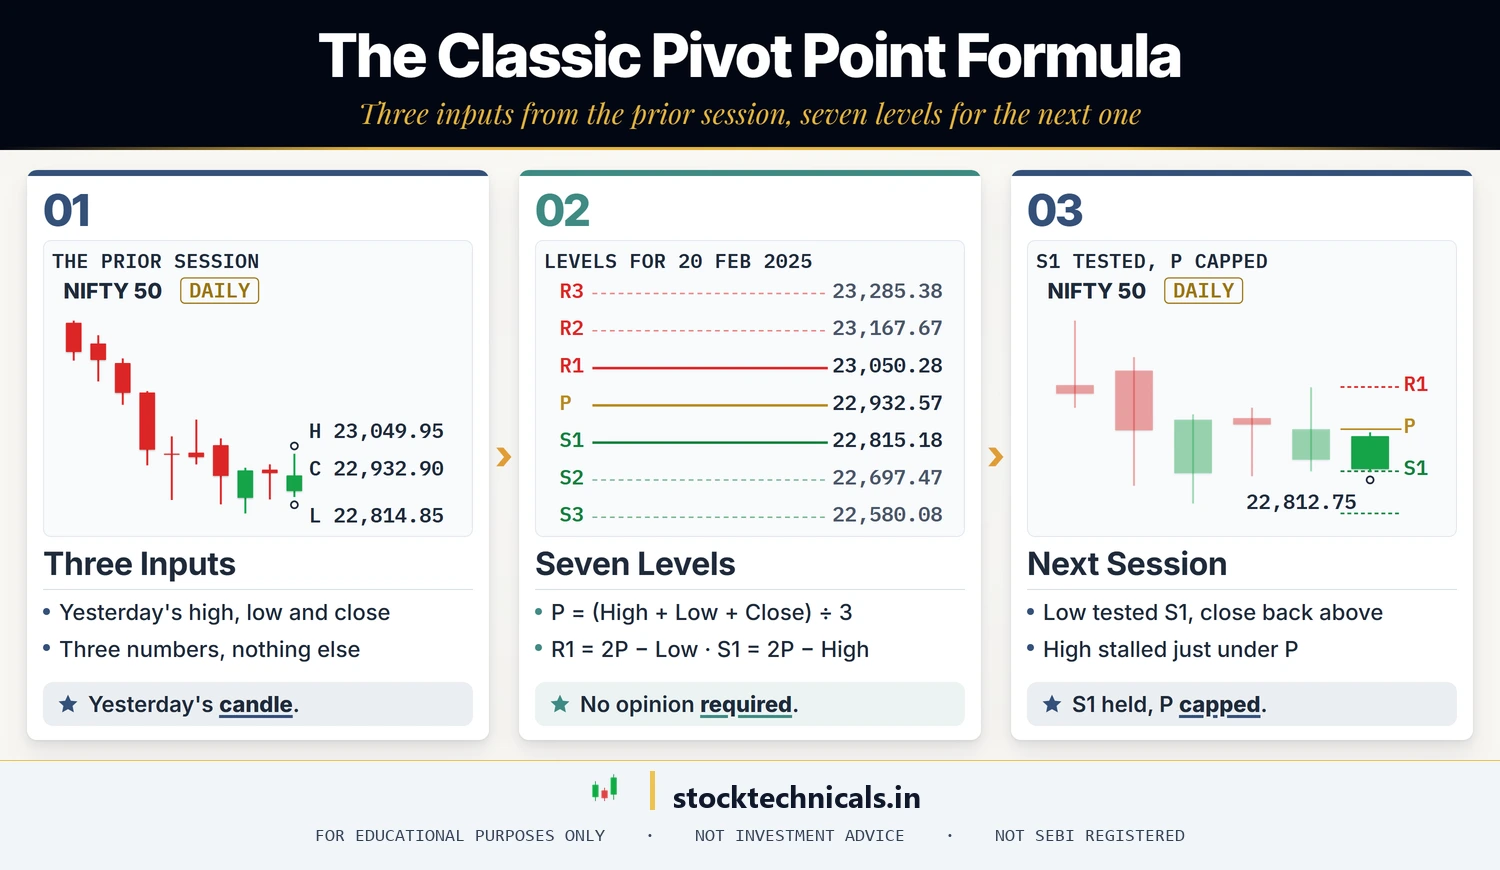
Every classic pivot level comes from three inputs: the previous session’s High, Low, and Close.
- P (Central Pivot) = (High + Low + Close) / 3
- R1 = (2 × P) − Low
- R2 = P + (High − Low)
- R3 = High + 2 × (P − Low)
- S1 = (2 × P) − High
- S2 = P − (High − Low)
- S3 = Low − 2 × (High − P)
Take the Nifty 50 session of 19 Feb 2025, which closed at 22,932.90 points with a high of 23,049.95 and a low of 22,814.85. The pivot calculation for 20 Feb 2025:
- P = (23,049.95 + 22,814.85 + 22,932.90) / 3 = 22,932.57
- R1 = (2 × 22,932.57) − 22,814.85 = 23,050.28
- R2 = 22,932.57 + (23,049.95 − 22,814.85) = 23,167.67
- R3 = 23,049.95 + 2 × (22,932.57 − 22,814.85) = 23,285.38
- S1 = (2 × 22,932.57) − 23,049.95 = 22,815.18
- S2 = 22,932.57 − (23,049.95 − 22,814.85) = 22,697.47
- S3 = 22,814.85 − 2 × (23,049.95 − 22,932.57) = 22,580.08
You now have seven lines mapped before the bell rings. On 20 Feb 2025 Nifty opened at 22,821.10, dipped to a low of 22,812.75 (just 2.43 points under S1) and then bounced; the rebound stalled at 22,923.85, below P. Your own levels will come from yesterday’s Nifty candle, which your platform already knows.
You will never do this math by hand in practice. Every chart platform computes it. The point of knowing the formula is understanding what the lines mean: R1 sits as far above P as P sits above yesterday’s low, R2 is one full day’s range above P, and R3 is a statistical outlier day.
Types of Pivot Points
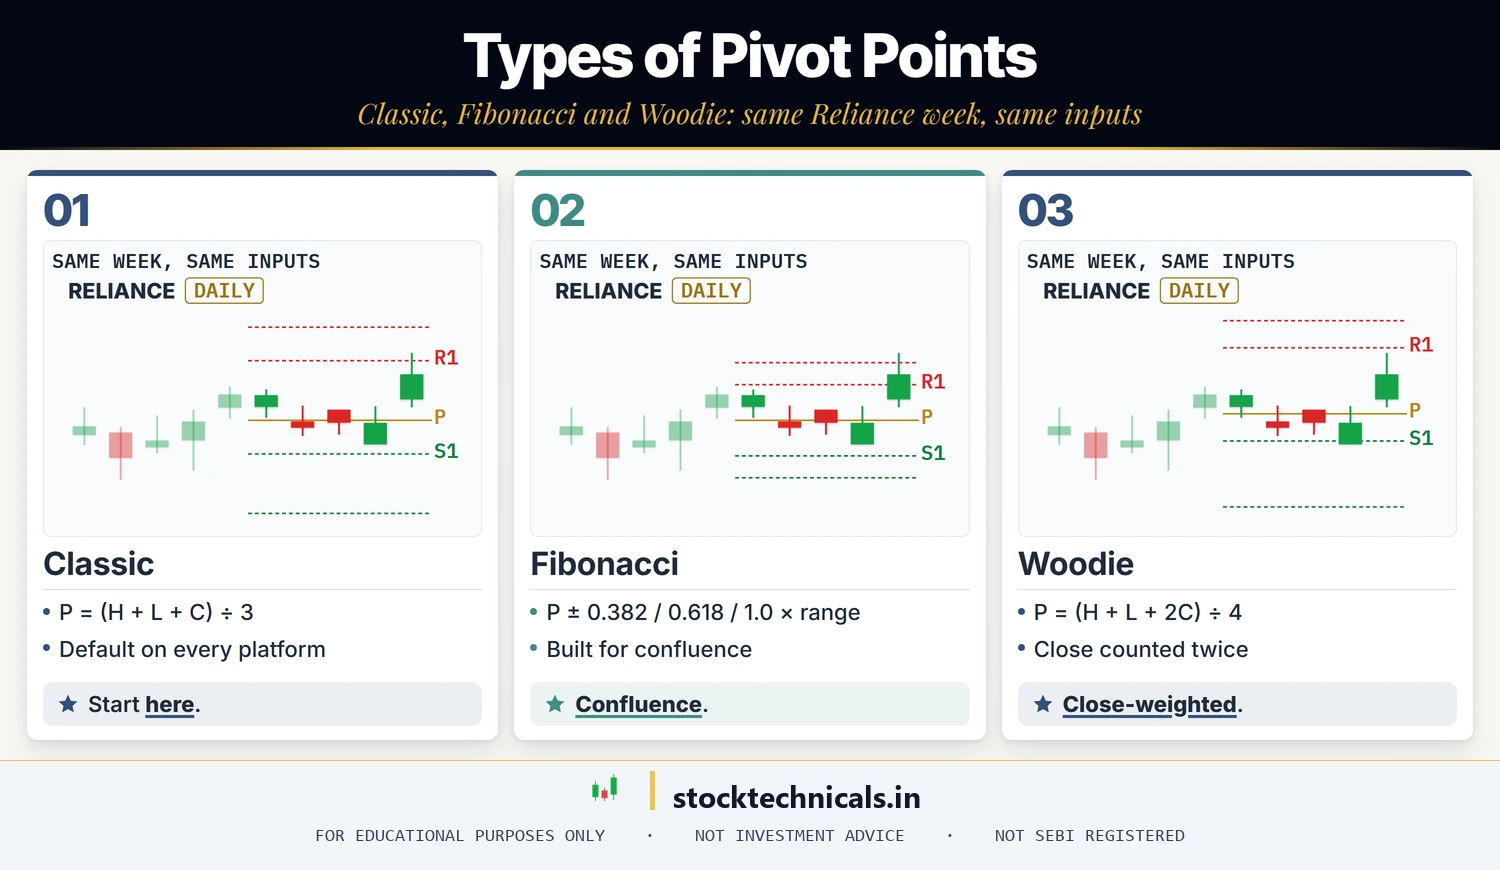

Classic is the default, but four variants are worth knowing because each has a slightly different use case.
Classic / Standard
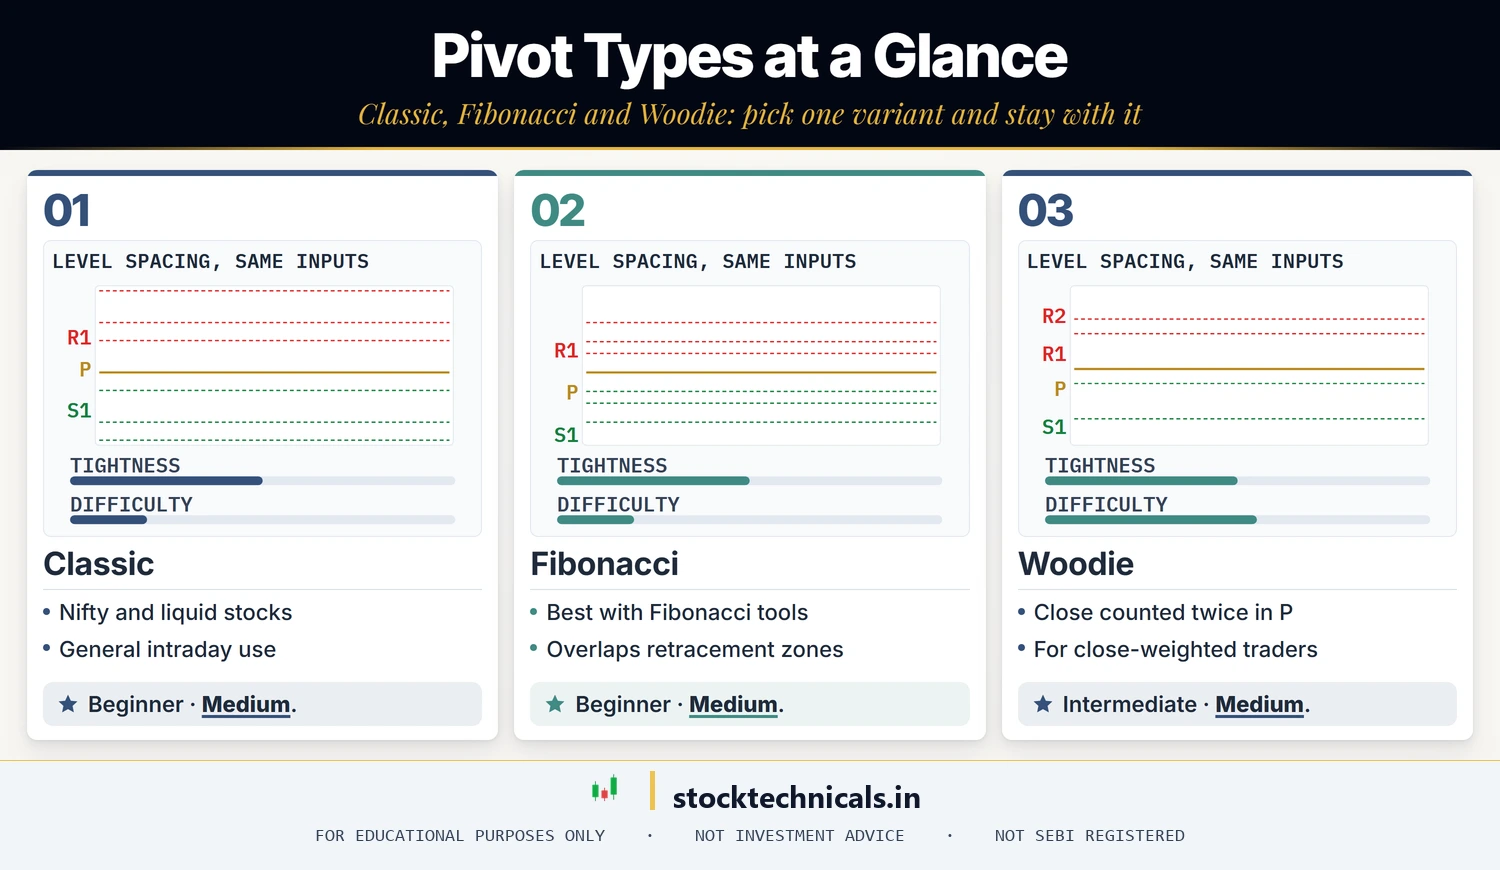
The formula above. Best for general intraday use on liquid instruments like Nifty 50 and Bank Nifty. Every platform offers it, every trader recognises the levels.
Fibonacci Pivots
Replaces the R/S spacing with Fibonacci ratios (38.2%, 61.8%, 100% of the previous day’s range added to or subtracted from P). Useful when you already trade Fibonacci — the levels naturally overlap your existing retracement zones and create confluence.
Camarilla Pivots
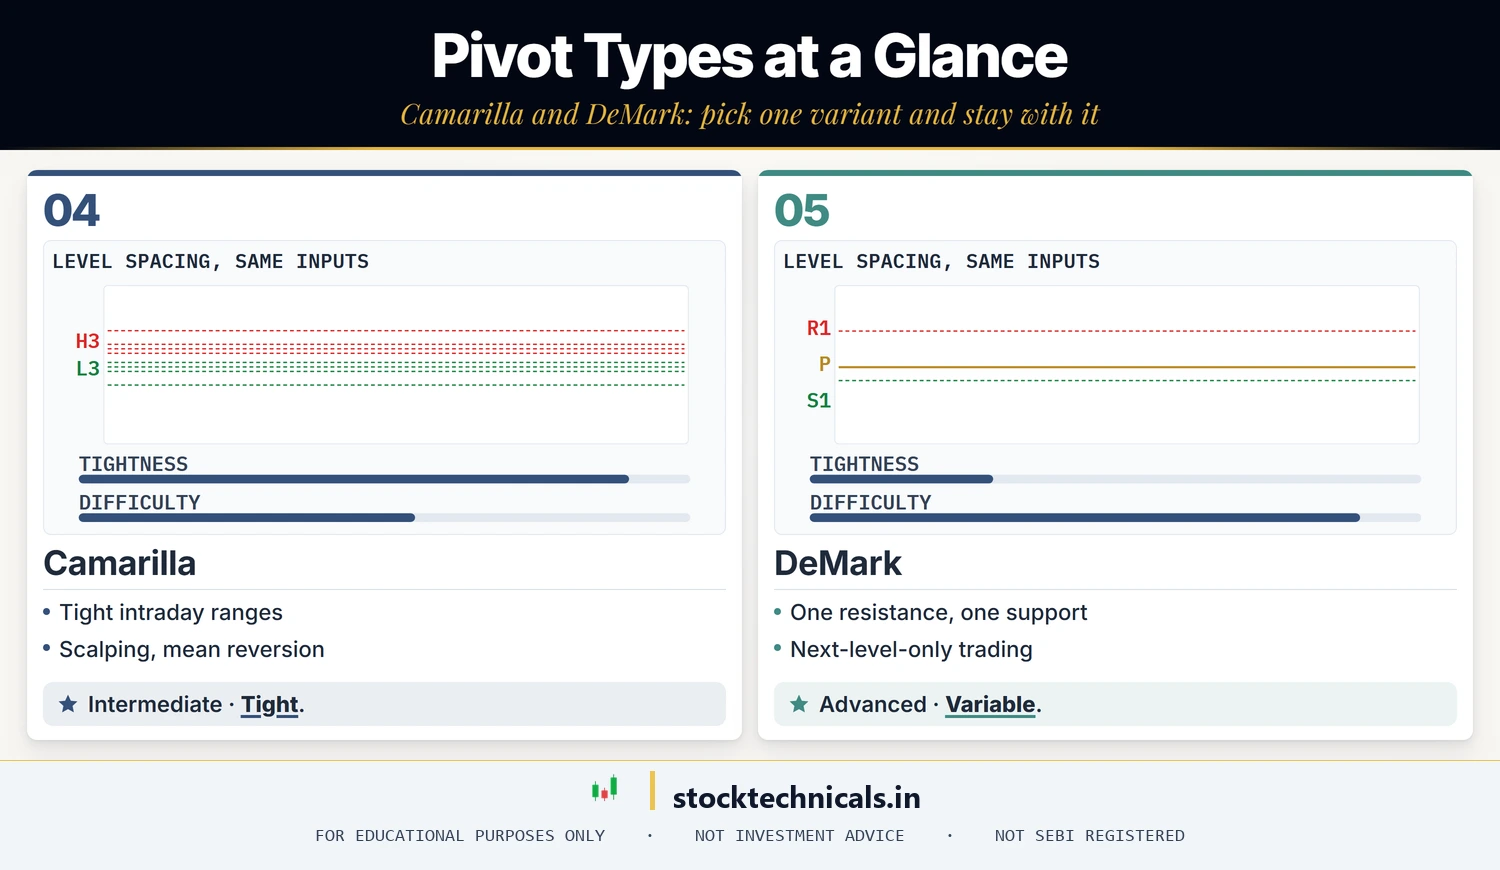
A tight-range calculation that produces four inner levels (H1–H4, L1–L4) spaced closer to P than Classic. Favoured by intraday mean-reversion traders and scalpers. The H3 and L3 lines tend to act as day-session extremes.
Woodie Pivots
Gives the previous session’s close extra weight in the P calculation — P = (High + Low + 2×Close) / 4. Useful when you believe the close price reflects the most accurate fair value. Niche but has loyal users.
DeMark Pivots
Conditional formula that changes based on whether the previous close was above or below the previous open. Only plots one resistance and one support. Used by traders who only care about the next critical level, not a full ladder.
How to read Pivot Points on a live chart
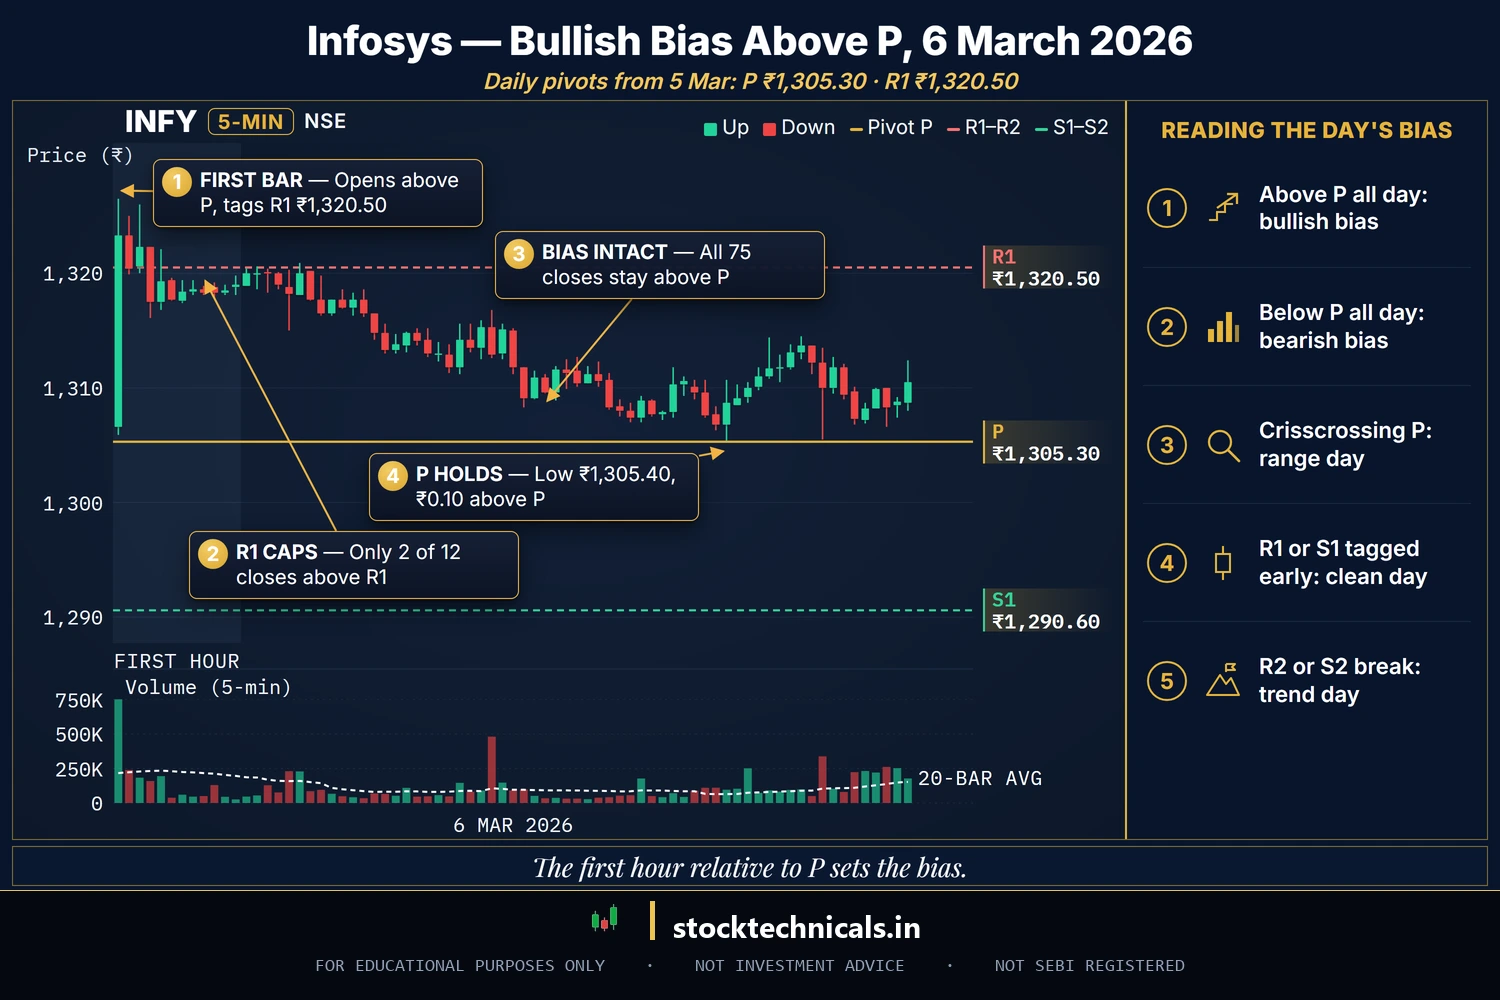
Chart window: 6 Mar 2026 (5-minute bars, daily pivots) · Data refreshed 10 Apr 2026 · Source: NSE (5-minute OHLC)
The first 30 minutes after the open usually tell you the day’s bias:
- Open above P, price stays above P — bullish day. Favour longs at pullbacks to P or S1; targets R1 and R2.
- Open below P, price stays below P — bearish day. Favour shorts at pullbacks to P or R1; targets S1 and S2.
- Price crisscrossing P — range day or indecision. Fade moves at R1/S1 back to P; avoid breakout trades.
- Early break of R2 or S2 — trend day. Stay with the trend, use R1/S1 as trailing reference.
A “clean” pivot day tends to touch R1 or S1 within the first hour. An “outlier” day prints through R2/S2 on news and tests R3/S3 — that’s where trend-following and breakout traders make their biggest R-multiples.
Two Pivot Point strategies that actually work
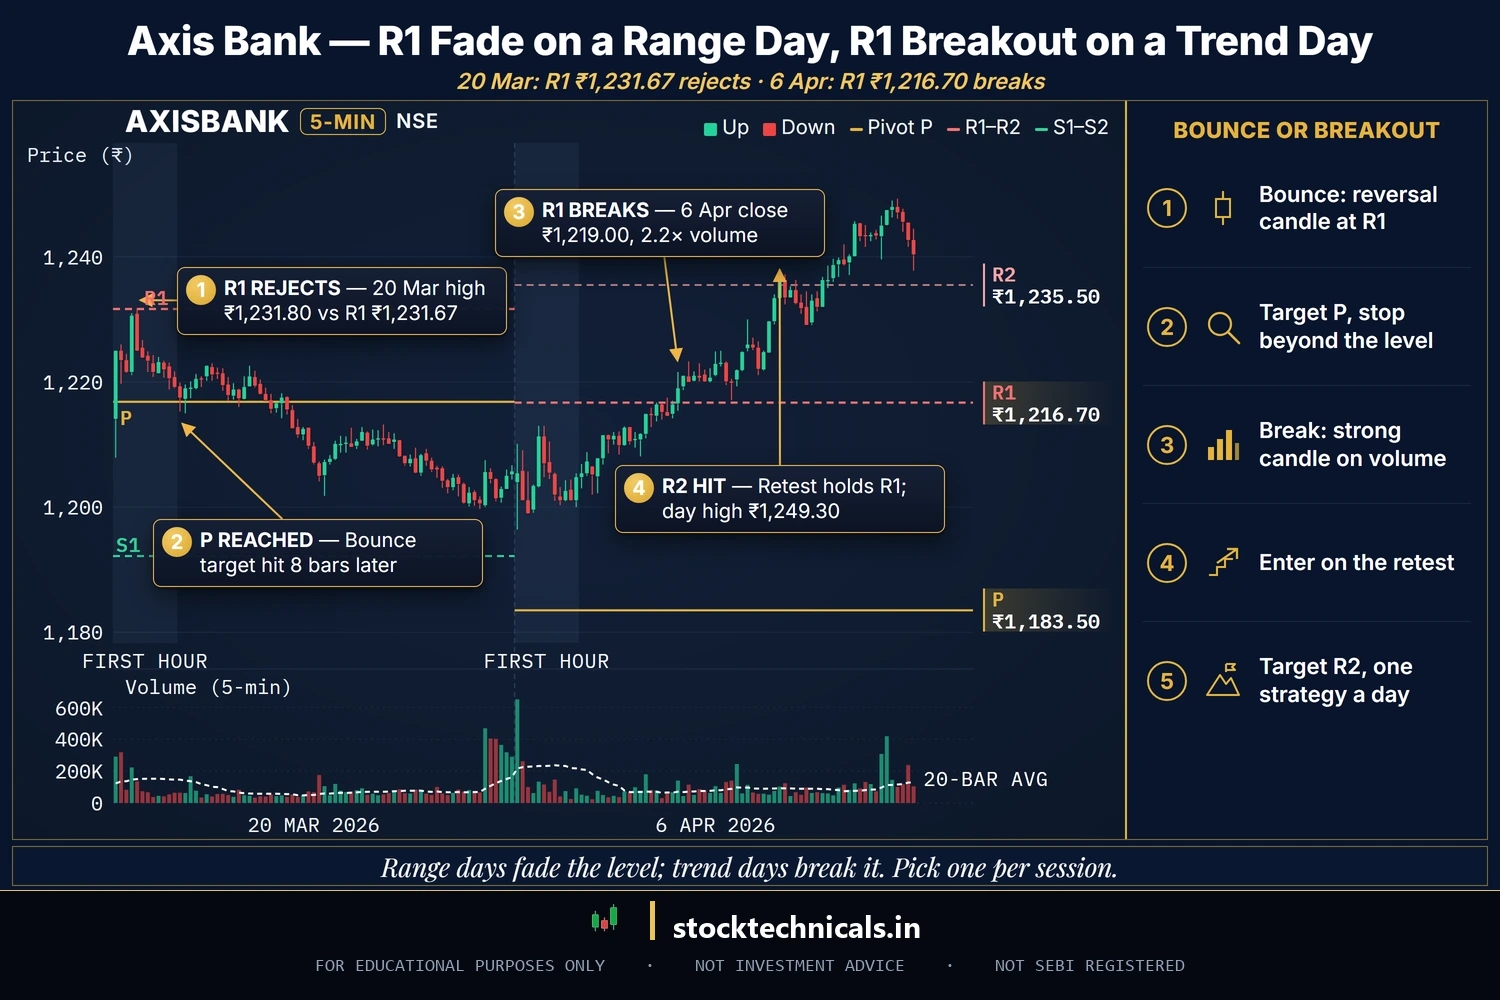
Chart window: 20 Mar 2026 and 6 Apr 2026 (5-minute bars, daily pivots) · Data refreshed 10 Apr 2026 · Source: NSE (5-minute OHLC)
Strategy 1 — The bounce (range day)
Best for days where price respects the levels and rotates inside the P ± R1/S1 range. Setup:
- Price approaches R1 or S1 from the expected side (R1 from below, S1 from above).
- A reversal candle prints — pin bar, bearish/bullish engulfing, or small-body doji at the level.
- Volume is average or lower (not a breakout).
- Entry on the next candle open; stop 0.15–0.30% beyond the level; target P (or opposite side of range).
Strategy 2 — The breakout (trend day)
Best for days where R1 or S1 gives way decisively. Setup:
- Price pushes through R1 (or S1) on a strong candle with clearly above-average volume.
- Retest of the level from the other side holds — the old resistance becomes new support (or vice versa).
- Enter on retest, stop just inside R1/S1, target R2 (or S2); trail to R3/S3 if the trend keeps running.
Pick one strategy per session based on the first 30 minutes. Mixing bounce and breakout inside the same day is how beginners give back every winner.
Set up Pivot Points on your platform
TradingView
- Open your chart. Click the Indicators menu.
- Search “Pivot Points Standard” (the TradingView-built version). Add it.
- Default timeframe is “Auto” — leave it on for intraday, switch to “Weekly” for swing trades.
- In Style, use distinct colours: P neutral grey, R1/S1 yellow, R2/S2 orange, R3/S3 red/green for extremes.
The paid plans add price alerts on individual Pivot levels — worth it for anyone trading Nifty/Bank Nifty intraday.
Zerodha Kite
- Open the chart. Click Studies.
- Add “Pivot Points” from the indicator list.
- Choose “Classic” and “Daily” for standard intraday use.
- Kite’s pivots are built from intraday candles and use a different R3/S3 formula, so levels can differ slightly from TradingView or a manual calculation.
Upstox and Groww also include a Pivot Points indicator in their charts. P, R1/S1 and R2/S2 should match closely, but R3/S3 and small rounding differences vary by platform, so check your own broker’s settings.
Combining Pivots with other indicators
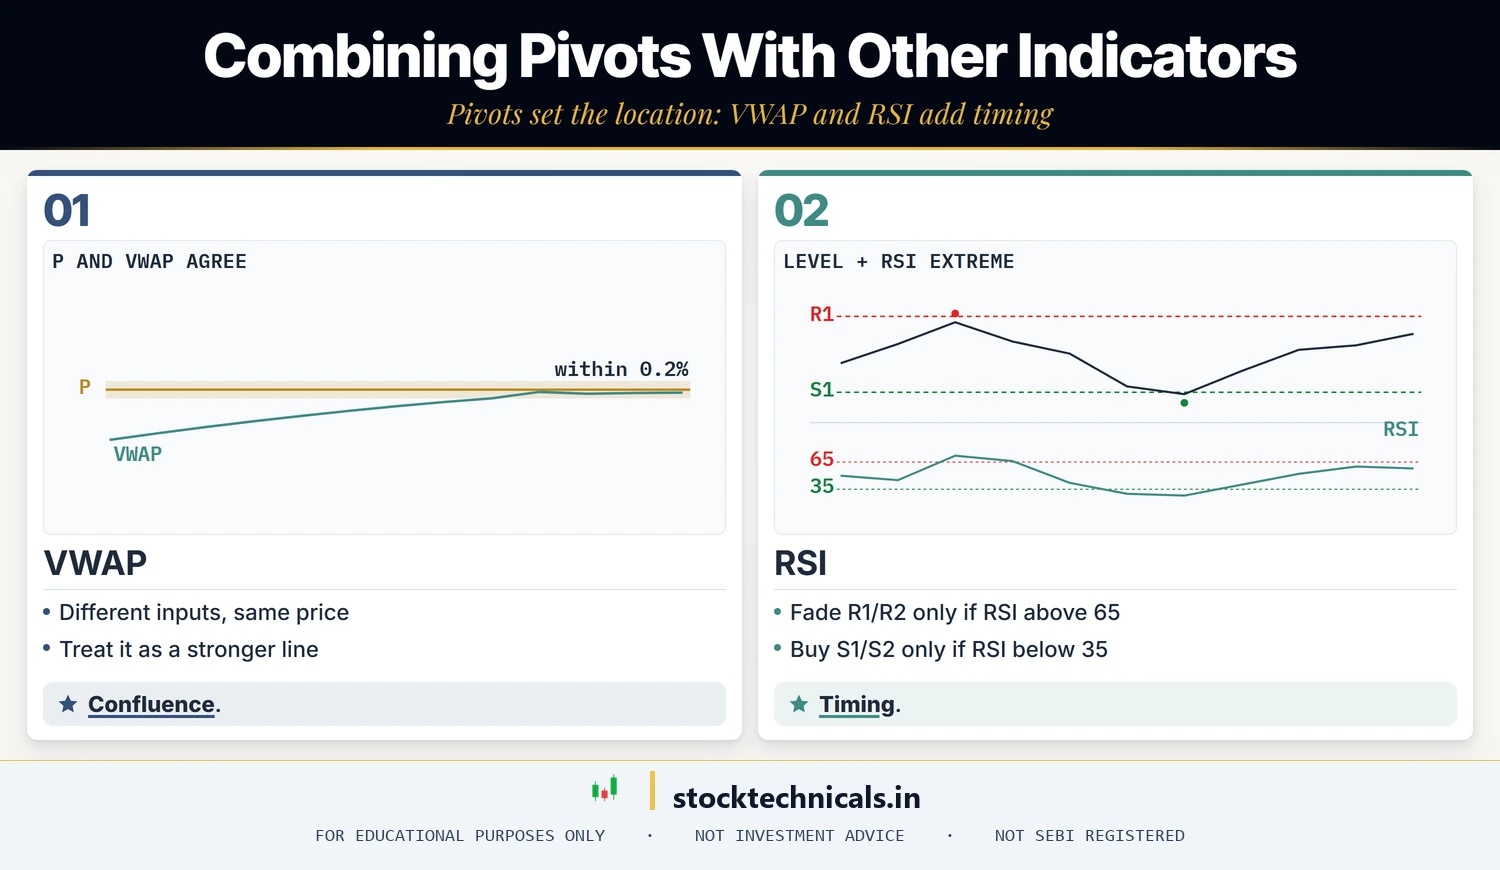
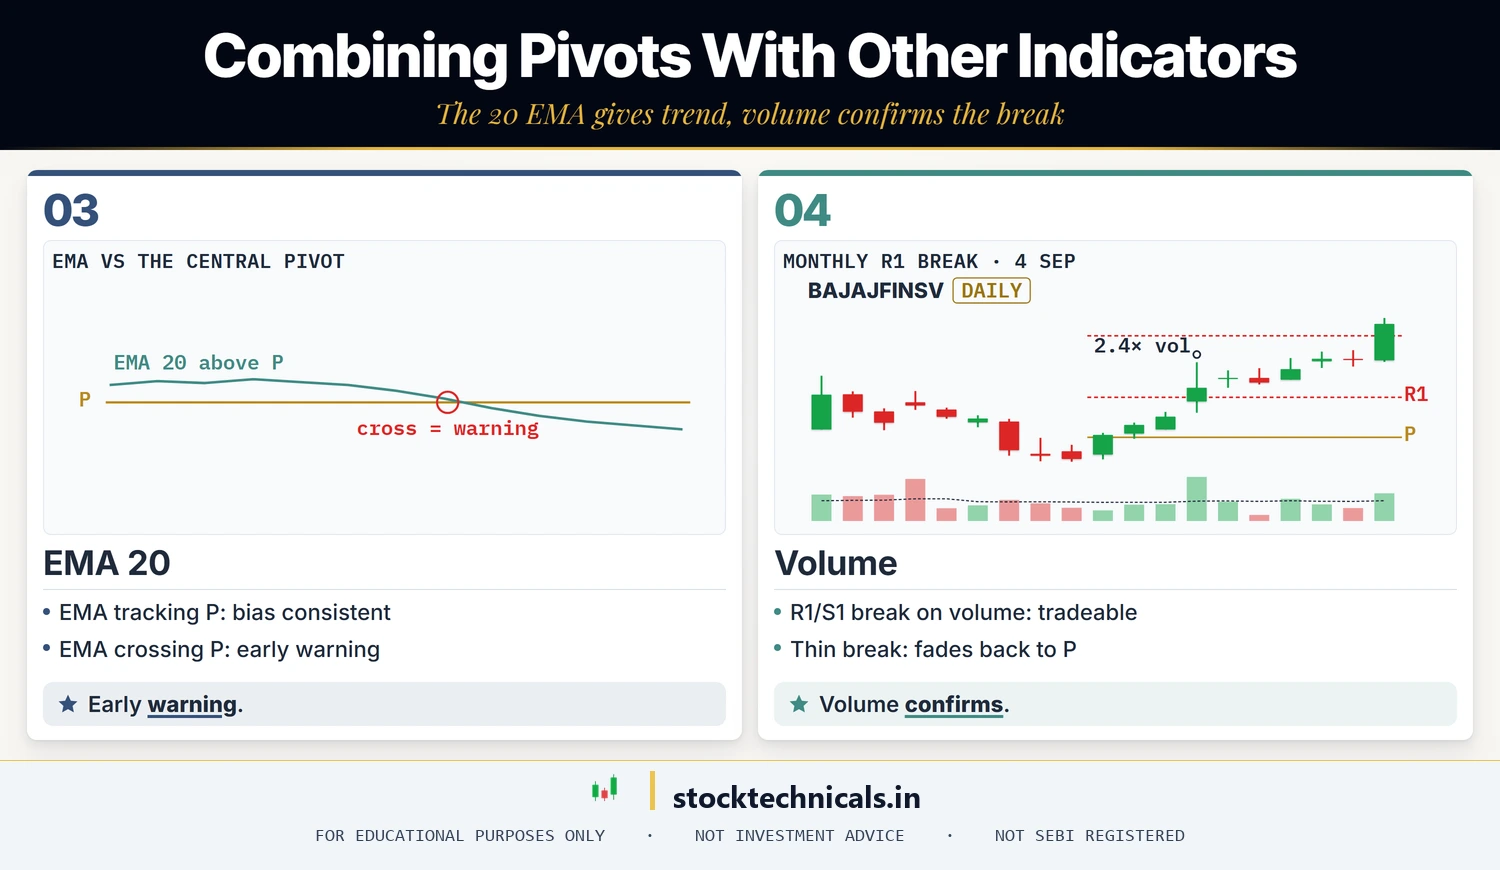
Pivots + VWAP — intraday confluence
When VWAP (see VWAP Explained) aligns within 0.2% of a Pivot level, treat it as a stronger S&R line. The two tools come from different inputs, so agreement is meaningful.
Pivots + RSI
Fade bounces at R1/R2 only when RSI is above 65 (short); buy bounces at S1/S2 only when RSI is below 35 (long). The level gives you the where, RSI gives you the when.
Pivots + EMA 20
When the 20-period EMA tracks the Central Pivot intraday, the trend is consistent with the pivot bias. EMA cross of P is an early warning that the day’s bias is flipping.
Pivots + volume
Breakouts through R1/S1 on volume >1.5× the 20-day average are tradeable. The same breakouts on low volume are probes and should be faded back to P.
Five rules for Pivot Point trading
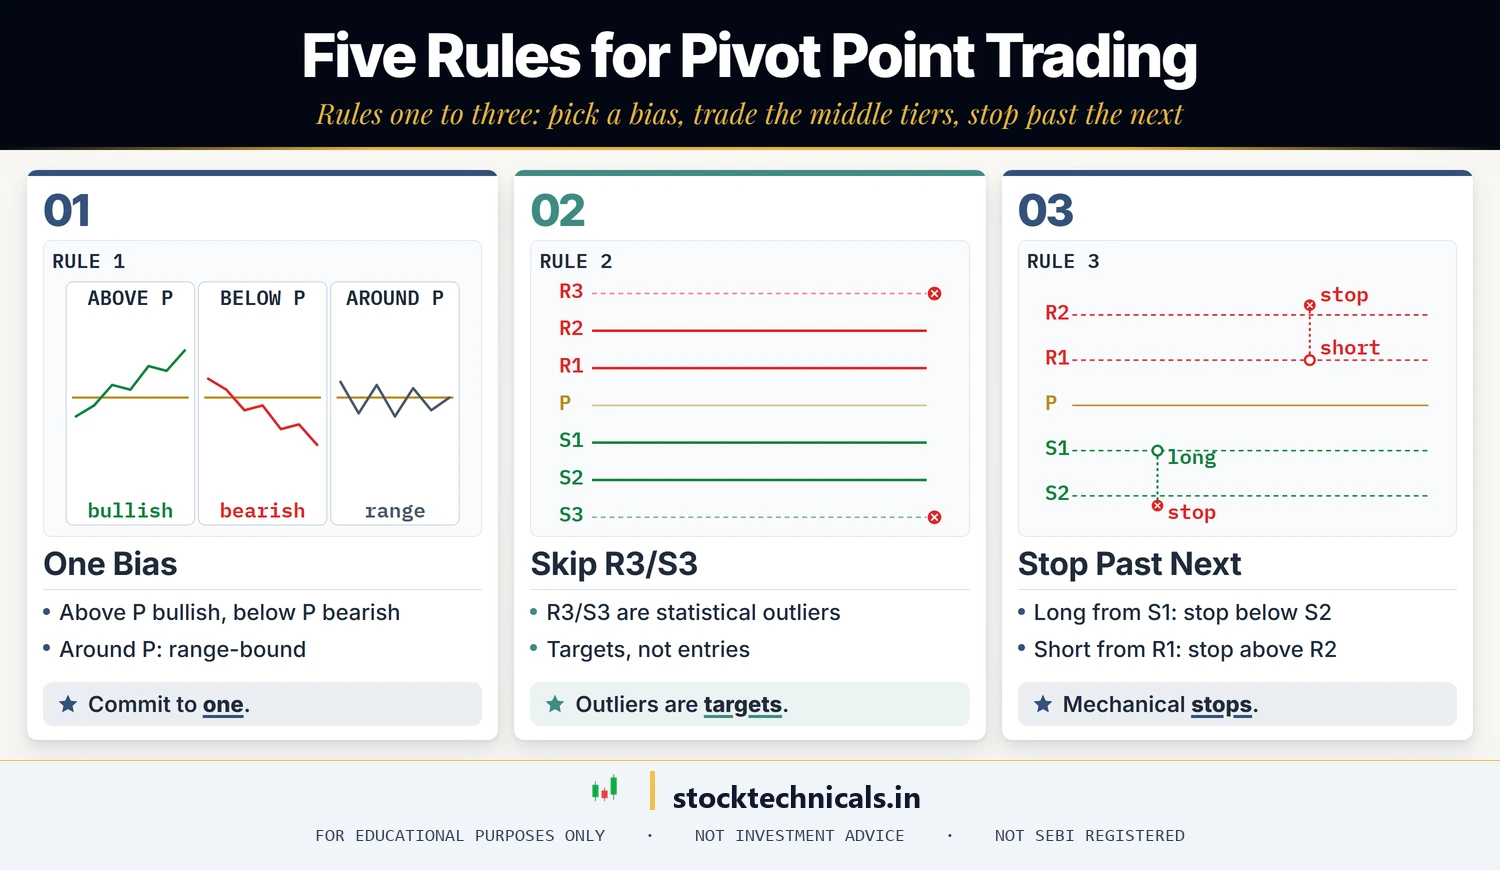
Rule 1 — Pick one bias in the first 30 minutes
Bullish above P, bearish below P, range-bound around P. Commit to one, trade only in that direction for the session. Switching bias mid-session is how small losses become big ones.
Rule 2 — Prefer R1/S1 and R2/S2 over R3/S3
R3 and S3 are statistical outliers. Price rarely reaches them except on news days. Make them targets, not entries.
Rule 3 — Stop-loss always beyond the next level
Long from S1 → stop below S2. Short from R1 → stop above R2. This keeps the stop mechanical and removes the “just one more tick” temptation.
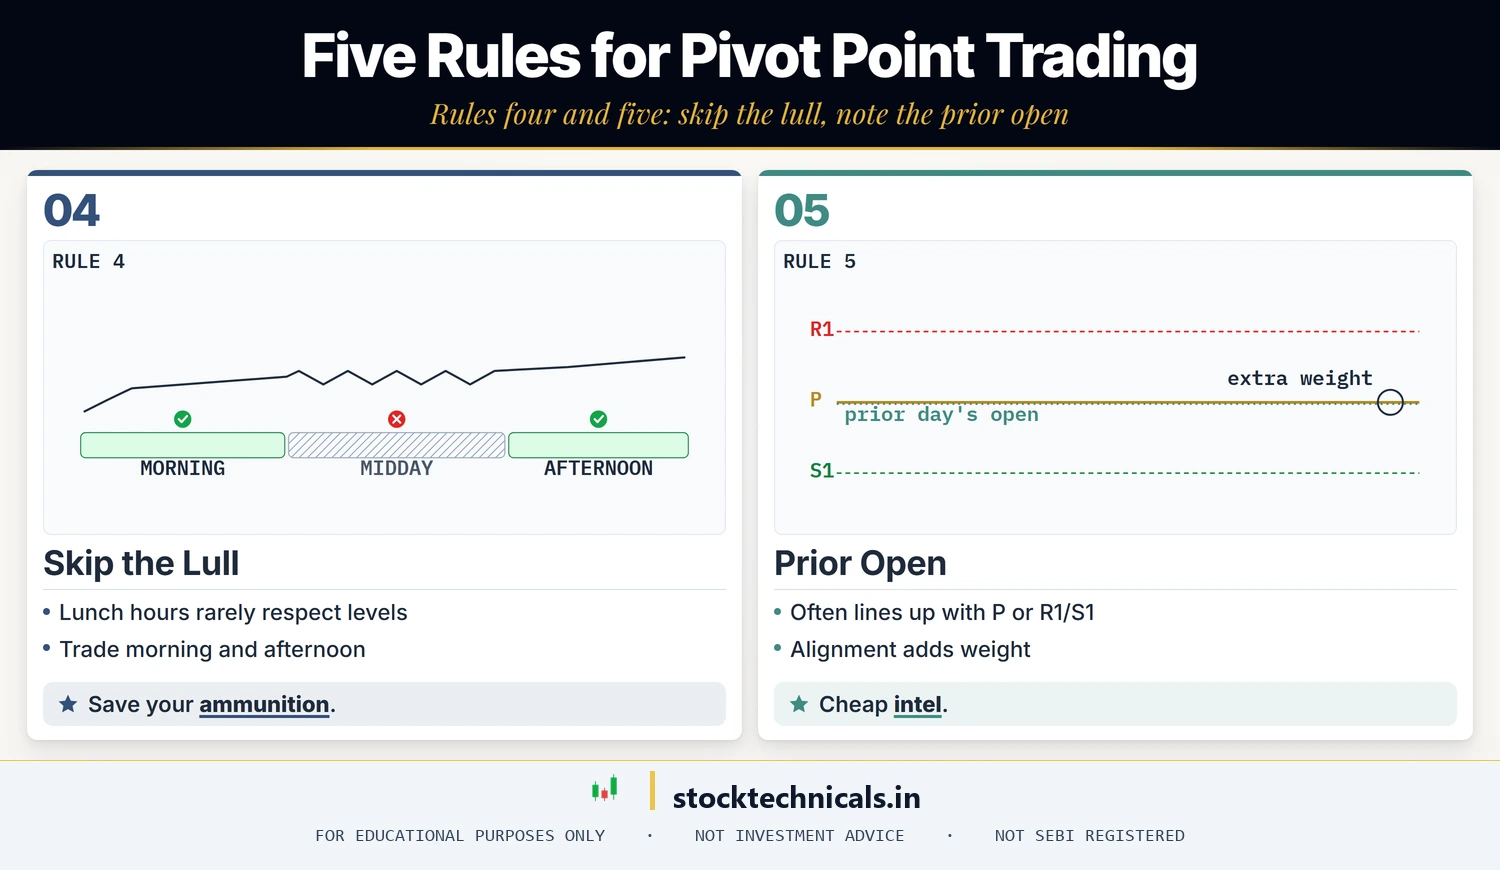
Rule 4 — Never trade the midday lull without a reason
The midday chop on NSE rarely respects Pivot levels cleanly. Save your ammunition for the first hours after the open and the afternoon move.
Rule 5 — Note the previous day’s open too
The prior session’s open often aligns with today’s P or R1/S1. When it does, the level has extra weight. Cheap intel that most Pivot traders skip.
Pre-trade checklist
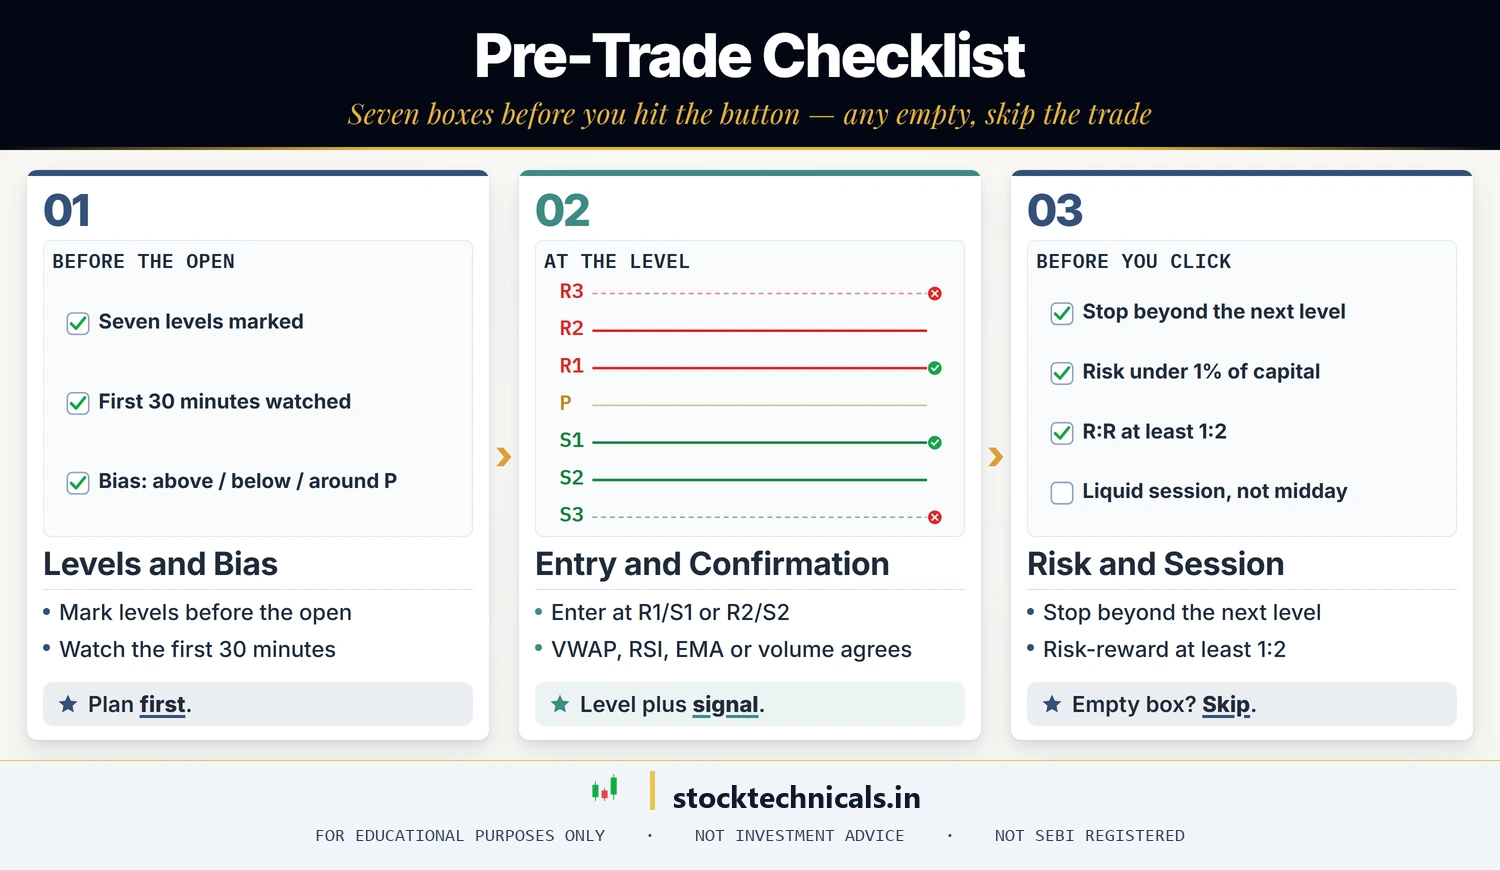
- Have I marked P, R1, R2, R3, S1, S2, S3 before the open?
- Have I watched the first 30 minutes and picked a bias?
- Is my entry at R1/S1 or R2/S2 (not R3/S3 or between levels)?
- Is VWAP, RSI, EMA, or volume adding confluence?
- Is my stop beyond the next pivot level, sized to < 1% of capital?
- Is R:R at least 1:2 on the first target?
- Am I trading the active parts of the session, not the midday lull?
If any checkbox is empty, skip. The next session starts tomorrow with fresh pivots.
Five common Pivot Point mistakes
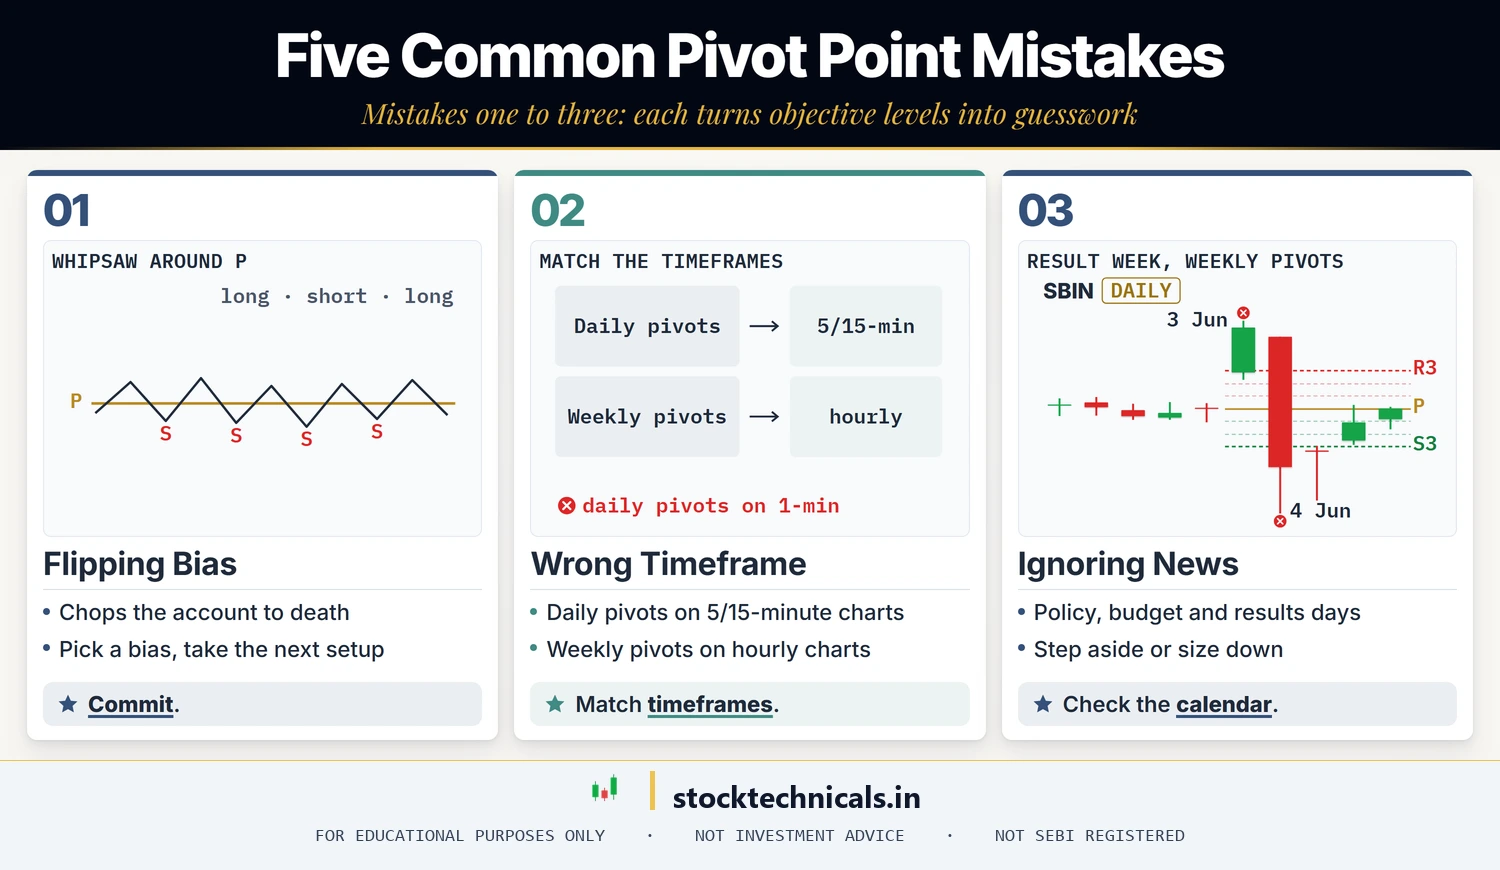
Flipping bias every 15 minutes
Pivots reward patience. Traders who flip long/short around P chop their account to death. Pick a bias, commit, and take the next setup in that direction.
Using daily Pivots on a 1-minute chart
Daily Pivots on a 1-minute chart look like a spaghetti plot. Use daily on 5-minute or 15-minute charts. Use weekly on hourly. Match the Pivot timeframe to the chart timeframe.
Ignoring news events
RBI policy days, budget days, inflation prints, and earnings nights produce outlier moves that blow through all three Pivot tiers in minutes. Know the economic calendar and step aside or size down.
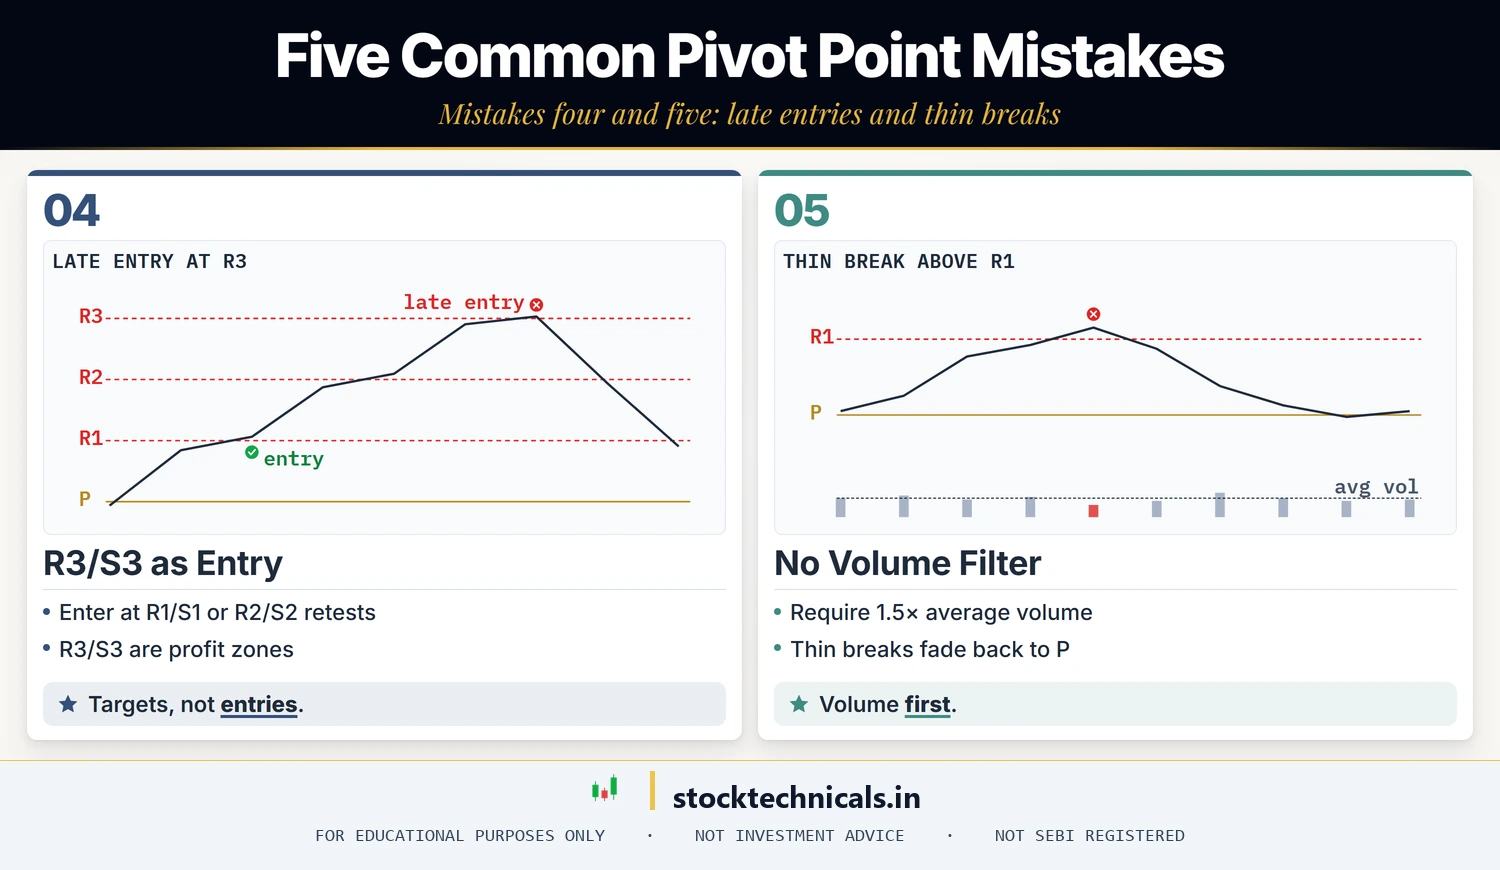
Treating R3/S3 as a trade entry
By the time price reaches R3 or S3, the day’s move is probably exhausted. Enter at R1/S1 or at a retest of R2/S2. Treat R3/S3 as profit zones, not entry zones.
No volume filter on breakouts
Any pivot break without volume is probably a fake-out engineered to trigger stops. Require at least 1.5× average volume on the breakout candle before you commit.
Pivot types at a glance
| Type | Best for | Tightness | Difficulty |
|---|---|---|---|
| Classic | General intraday on Nifty & liquid stocks | Medium | Beginner |
| Fibonacci | Traders who already use Fibonacci tools | Medium | Beginner |
| Camarilla | Scalping, mean reversion | Tight | Intermediate |
| Woodie | Traders who weight the close | Medium | Intermediate |
| DeMark | Next-level-only trading | Variable | Advanced |
Are Pivot Points better than drawn support and resistance?
They’re different tools. Pivots are objective, machine-calculated, and closely matched across platforms. Drawn S&R captures historical structure that formed over weeks or months. Use both: drawn S&R for the big picture, Pivots for intraday trigger points.
Do Pivot Points work on stocks or only on indices?
They work on any liquid instrument. Nifty 50 and Bank Nifty are the cleanest because of volume and institutional participation. Large-cap stocks like Reliance, TCS, HDFC Bank, and Infosys also respect pivots well. Small-caps and illiquid stocks can print through levels on thin volume — less reliable.
Which Pivot type should a beginner start with?
Classic (Standard) pivots. The formula is universal, every platform supports it, and every major broker’s chart gives closely matching numbers for P, R1/S1 and R2/S2. Graduate to Fibonacci or Camarilla only after six months of consistent Classic pivot trading.
How do I use Pivot Points for options trading?
Use R1 and S1 as strike-selection references. For Nifty weekly options, a strangle with strikes near R1 and S1 (centred on P) frames the expected intraday range. For directional trades, buy calls when price breaks above R1 on volume; buy puts when it breaks below S1. Standard pivot rules still apply — stop, size, and a volume filter.
Should I recalculate Pivots after a gap-open?
No. Pivots are calculated from the previous session’s close — they don’t change based on today’s open. A big gap-open often means today’s pivots are further from price than normal, which itself is useful information about volatility and potential mean-reversion.
Can I use weekly or monthly Pivots?
Yes. Weekly Pivots (calculated from the previous week’s H/L/C) are great for swing trades. Monthly Pivots work for positional traders. Match the Pivot timeframe to your holding period — day trader uses daily, swing trader uses weekly, positional uses monthly.
Do Pivot Points repaint or change during the day?
No. Once calculated at market open, the day’s Pivots are fixed for the full session. That’s the whole point — they are a static reference frame you can plan against without worrying about the levels moving.
Test Your Knowledge
Q1: What inputs go into the Central Pivot (P) formula?
Q2: Price is above P all morning. Your day bias should be:
Q3: Which Pivot variant is best suited for intraday scalping and mean reversion?
Q4: You’re long from S1. Where should your stop-loss go?
Q5: R3 and S3 are best used as:
Your next step
Pivots pair brilliantly with VWAP for intraday confluence and with Ichimoku Cloud for higher-timeframe trend bias. Pick one of those, backtest the combination for two weeks on paper, and you’ll have a complete intraday framework.
The Bottom Line
Pivot Points are the most boring indicator on your chart and that’s exactly why they work. Same formula, same levels, same logic every single session. Commit to one bias per day, trade only at R1/S1 or R2/S2, stop beyond the next level, and let the outlier days pay for the range days. Mechanical, repeatable, and impossible to “optimise” your way out of — which is a feature, not a bug.
Educational content only — not SEBI-registered investment advice. Pivot Points and all Technical Analysis tools improve probability, they do not remove loss. Price can and does blow through multiple pivot tiers on news and macro event days. Size every trade so a full stop-out costs less than 1% of capital. Never trade with borrowed money.