Quick Answer: PRICE ACTION TRADING is the method of making trading decisions based purely on raw price movement — candlestick patterns, support and resistance levels, and trend structure — without using any technical indicators. Price is the only leading signal in the market. Every indicator is derived from price data and therefore lags behind it.
PRICE ACTION TRADING is the method of making trading decisions based purely on raw price movement — no indicators, no oscillators, no lagging signals. The chart itself becomes the only tool a trader needs.
This article breaks down exactly how price action works, why experienced traders prefer it over indicator-heavy setups, and how to build a complete price action strategy from scratch. Every concept uses real NSE stock examples that traders can verify on their own charts.
Key Takeaways
- PRICE ACTION TRADING reads raw price bars, candlestick patterns, and market structure — without any indicators on the chart
- Price is the only leading signal in the market — every indicator is derived from price and therefore lags behind it
- The five building blocks of price action are trends, support and resistance, candlestick signals, chart patterns, and volume
- A price action trade requires at least three confluences: trend direction, key price level, and a candlestick signal
- Combining price action with one minimal tool (like the 200 EMA or volume) produces cleaner, higher-probability setups than stacking five indicators
- The biggest mistake price action traders make is trading patterns in isolation — without checking the structure and context around them
What is Price Action Trading

Chart data: Evergreen reference · Last reviewed April 17, 2026

Chart data refreshed on April 17, 2026 · Source: NSE (daily OHLC)
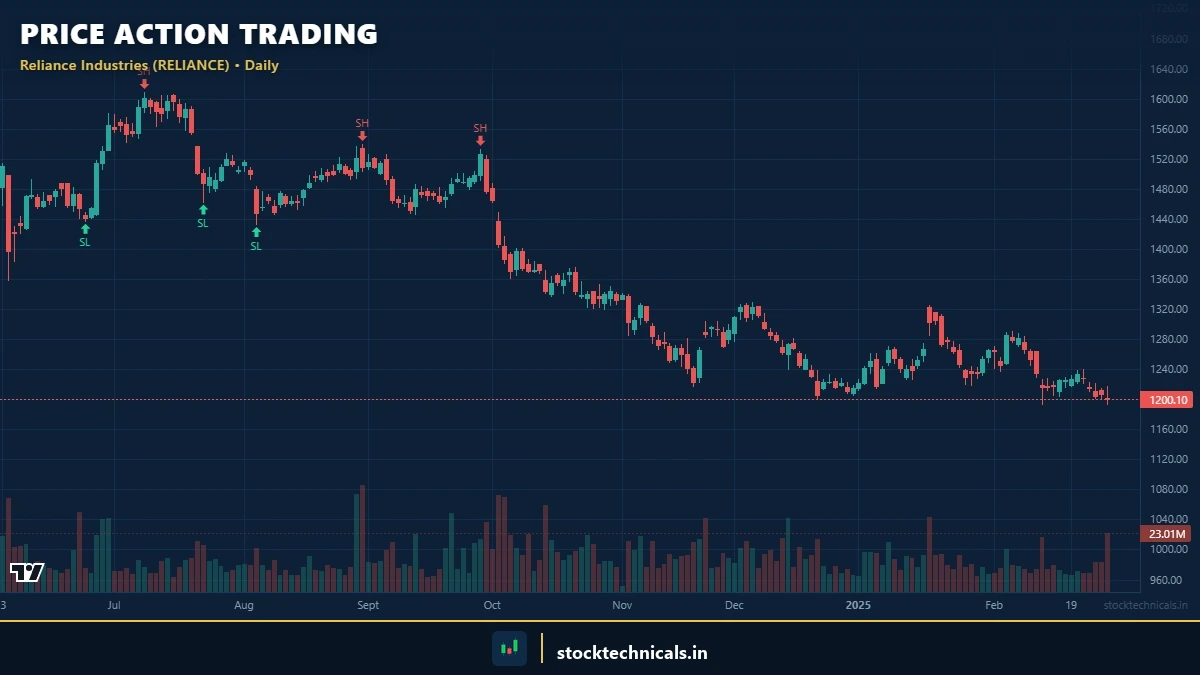
PRICE ACTION TRADING means analyzing and trading based on the raw movement of price on a chart. No RSI. No MACD. No Bollinger Bands. Just candlesticks, price levels, and the structure they create.
The philosophy is straightforward: price reflects everything. Every piece of information — earnings results, institutional buying, retail panic, algorithmic orders — shows up in price before it shows up anywhere else. A candlestick chart already contains all available information. Indicators just repackage that same data with a delay.
When a trader opens a clean chart — just candlesticks on a dark background — that trader is looking at the purest form of market data available. Every candle tells a story: who won the battle between buyers and sellers during that time period, how much conviction existed, and where the balance of power is shifting.
How Price Action Differs from Indicator Trading
Most beginners load their charts with five or six indicators. RSI at the bottom, MACD below that, Bollinger Bands squeezing the candles, a couple of moving averages crisscrossing the chart. The result: a cluttered mess where the actual price movement is barely visible.
Price action strips all of that away. The chart contains only:
- Candlesticks (open, high, low, close for each period)
- Horizontal levels (support and resistance zones)
- Trendlines (connecting swing highs or swing lows)
The Three Core Principles
- Price is the leading indicator — By the time RSI shows “overbought,” price has already moved. Price action traders see the move as it happens, not after a formula confirms it.
- Context determines everything — A bullish engulfing candle at a major support zone means something completely different than the same candle in the middle of nowhere. Location on the chart matters more than the pattern itself.
- Less is more — A clean chart with two or three marked levels gives clearer signals than a chart buried under six overlapping indicators.
Why Price Action Works

Chart window: evergreen · Data refreshed April 17, 2026 · Source: NSE (daily OHLC)
Price action is not a new concept. Traders in the rice futures markets of 18th century Japan used candlestick patterns — the same patterns that NSE traders analyze today on Reliance, HDFC Bank, or Nifty 50 (NSE: NIFTY 50) charts.
The reason price action has survived centuries while indicators come and go: it reads the market directly rather than through a mathematical filter.
Price Is the Only Leading Signal
Every single technical indicator — RSI, MACD, Stochastic, Supertrend — is calculated from price data. They take the open, high, low, close values, run them through a formula, and produce a number or line.
The problem: that calculation introduces lag. A 14-period RSI needs 14 candles of data before it produces a reading. A 50-period EMA smooths out the last 50 candles. By the time these indicators flash a signal, price has already moved.
Price action traders skip the middleman. Instead of waiting for RSI to cross 30, they watch the actual candle forming at a key support level. Instead of waiting for a MACD crossover, they see the engulfing pattern developing in real time.
Works Across All Markets and Timeframes
PRICE ACTION principles apply identically whether a trader is analyzing Nifty 50 on a daily chart, Bank Nifty on a 5-minute chart, Reliance Industries on a weekly chart, or SBI on a 15-minute chart.
The same support and resistance logic, the same candlestick signals, the same trend structure — all of it transfers across instruments and timeframes. A pin bar rejection at support looks the same on a Tata Motors daily chart as it does on a Nifty 15-minute chart.
The Five Building Blocks of Price Action

Chart data: Evergreen reference · Last reviewed April 17, 2026

Chart data refreshed on April 17, 2026 · Source: NSE (daily OHLC)
Price action is not a single technique — it is a framework built on five interconnected components. Each one adds a layer of understanding to what the chart is communicating.
Trends: The Direction of the Market
The first question any price action trader asks: which way is the market moving?
An UPTREND shows a series of higher highs and higher lows. Each swing low is above the previous swing low, and each swing high pushes beyond the previous high. Buyers are in control.
A DOWNTREND shows lower highs and lower lows. Sellers dominate each rally attempt.
A SIDEWAYS market — also called a range — shows price bouncing between a ceiling (resistance) and a floor (support) without making progress in either direction.
The rule is simple: trade in the direction of the trend. In an uptrend, look for buying opportunities at pullback lows. In a downtrend, look for shorting opportunities at rally highs.
Support and Resistance: Where Price Reacts
Support and resistance levels are horizontal zones where price has repeatedly reversed or stalled in the past.
SUPPORT is a price zone where buying interest is strong enough to halt a decline. RESISTANCE is a price zone where selling pressure halts an advance.
The key insight: support and resistance are zones, not exact numbers. A level at ₹2,450 on Reliance does not mean price will reverse at exactly ₹2,450.00. Traders who draw these levels correctly mark zones, not lines.
Candlestick Signals: The Language of Price
Candlestick patterns are the trigger mechanism of price action trading. The patterns that matter most:
- Pin bar (hammer/shooting star) — A candle with a long wick and small body showing rejection of a price level
- Engulfing pattern — A large candle that completely engulfs the previous candle’s body
- Inside bar — A candle whose entire range fits within the previous candle, signaling consolidation
- Doji — A candle with nearly equal open and close, showing indecision
What separates price action traders from candlestick pattern traders: context. A pin bar in the middle of a choppy range means nothing. The same pin bar at a major weekly support level in the direction of the prevailing trend — that is a trade.
Chart Patterns: Structure-Level Signals
Key chart patterns for price action traders:
- Double top and double bottom — Price tests a level twice and reverses
- Head and shoulders — A three-peak reversal structure
- Triangle patterns — Contracting range leading to a breakout
- Flags and pennants — Continuation patterns within a trend
Volume: The Confirmation Layer
While price action purists trade with zero indicators, most experienced traders keep volume visible on their charts. Volume is not an indicator in the traditional sense — it is raw data about how many shares traded.
Volume confirms or questions a price move:
- A breakout above resistance with volume 2-3x the average is genuine
- A breakout on thin volume may be a false breakout
- A pin bar rejection at support with a volume spike shows institutional buying
Key Price Action Setups Every Trader Must Know

Chart data: Evergreen reference · Last reviewed April 17, 2026

Chart data refreshed on April 17, 2026 · Source: NSE (daily OHLC)
These are the four price action setups that produce the most consistent results on NSE stocks.
The Pin Bar at a Key Level
The pin bar — also called a HAMMER at support or a SHOOTING STAR at resistance — is the single most popular price action setup.
What it looks like: A candle with a very long wick (at least 2x the body length) and a small body at one end. The long wick shows that price moved aggressively in one direction but was completely rejected by the close.
How to trade it:
- Identify a clear support or resistance level on the daily or 4-hour chart
- Wait for price to reach that level
- Look for a pin bar with the wick pointing into the level
- Enter above the high of the pin bar (bullish) or below the low (bearish)
- Place the stop loss beyond the wick
- Target the next significant level or use a minimum 1:2 risk-reward ratio
The Inside Bar Breakout
The INSIDE BAR is a candle whose entire range fits within the range of the previous candle (the “mother bar”). It signals compression — a pause before the next directional move.
How to trade it:
- Identify an inside bar forming at a key level or within a trending move
- Mark the high and low of the mother bar
- Enter when price breaks and closes beyond the mother bar’s range
- Stop loss goes on the opposite side of the mother bar
- Target 1.5x to 2x the mother bar’s range, or the next key level
Inside bars are especially effective as continuation patterns within a trend. In an uptrend, an inside bar at a pullback level followed by an upside breakout is a high-probability long entry.
The Engulfing Pattern at Support or Resistance
A BULLISH ENGULFING at support or a BEARISH ENGULFING at resistance is one of the strongest two-candle reversal signals.
How to trade it:
- Price must be at a defined support or resistance zone
- The engulfing candle must be significantly larger than the prior candle
- Enter above the engulfing candle’s high (bullish) or below its low (bearish)
- Stop loss below the engulfing candle’s low (bullish) or above its high (bearish)
- Minimum 1:2 risk-reward
The False Breakout Reversal
False breakouts are created by smart money. Institutional traders push price slightly beyond well-established levels, trigger retail orders, build their position, and then reverse the market.
How to trade it:
- Price pushes slightly beyond a well-established support or resistance level
- The breakout candle is weak — small body, long wick back into range, or low volume
- The next candle reverses strongly back inside the range
- Enter in the direction of the reversal
- Stop loss beyond the false breakout wick
- Target the opposite end of the range
How to Read a Clean Chart: Step by Step
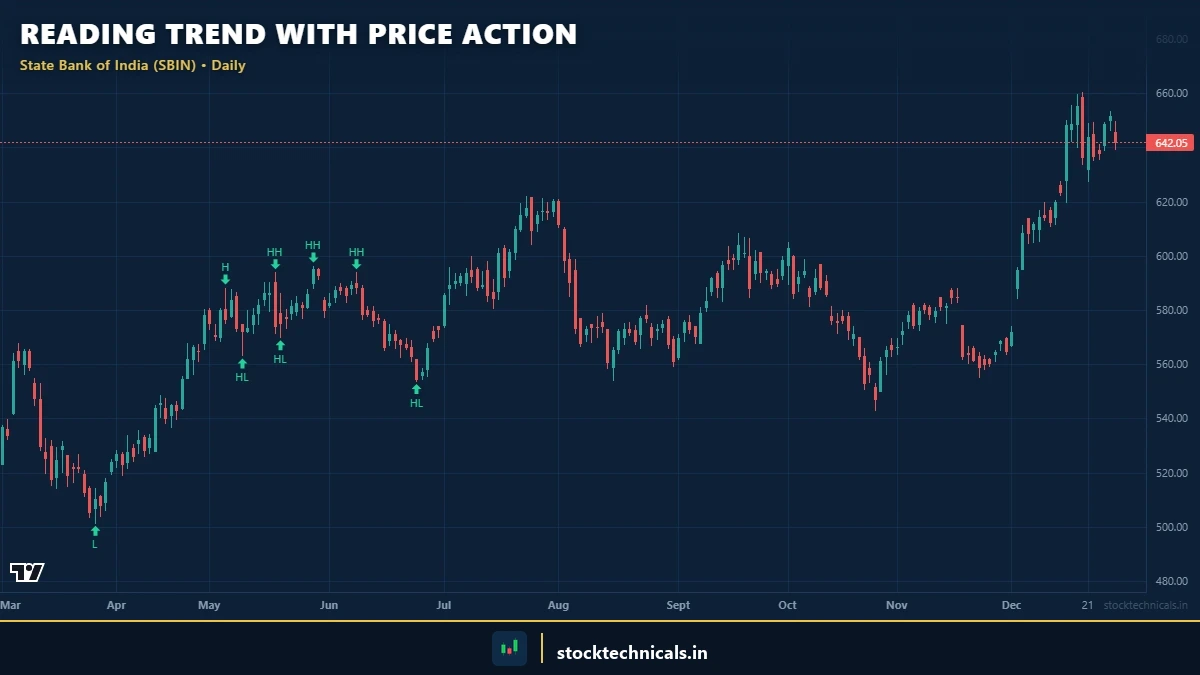
Chart data: Evergreen reference · Last reviewed April 17, 2026
Reading a price action chart follows a systematic top-down process.
Start with the Higher Timeframe
Open the daily or weekly chart first. The higher timeframe reveals the trend direction and major support/resistance zones. This 30-second scan prevents 80% of bad trades.
Mark the Key Levels
Draw horizontal zones at prices where the chart shows obvious reactions — areas where price reversed sharply or stalled for multiple sessions. Most stocks need only 3-5 levels on a daily chart. Keep it clean.
Wait for Price to Arrive at a Key Level
This is the hardest part. Most of the time, price is between key levels — in transit. There is no trade during this phase. Price action trading requires patience. The setup forms when price reaches a key level. Not before.
Look for a Candlestick Signal at the Level
When price arrives at a key level, watch for one of the setups: pin bar, engulfing, inside bar breakout, or false breakout. The signal must form at the level.
Check for Confluence
CONFLUENCE means multiple independent factors agreeing on the same trade direction. A high-probability price action trade has at least three:
- Trend — The trade is in the direction of the prevailing trend
- Key level — Price is at a significant support or resistance zone
- Candlestick signal — A recognizable price action signal has formed at that level
Execute with a Plan
Before entering: define entry price, stop loss (beyond the signal candle’s wick), target (next key level or minimum 1:2 risk-reward), and position size (never more than 1-2% of capital at risk on a single trade).
Price Action vs Indicator Trading: The Honest Comparison

Chart data: Evergreen reference · Last reviewed April 17, 2026

Chart data refreshed on April 17, 2026 · Source: NSE (daily OHLC)
Where Price Action Has the Edge
- No lag — Signals form in real time
- Clean charts — Less visual noise means clearer decisions under pressure
- Universal — Works on any instrument, timeframe, or market condition
- Develops market intuition — Traders build a feel for market psychology
Where Indicators Have the Edge
- Objective rules — Specific numbers remove subjectivity
- Backtestable — Can be coded and tested on historical data
- Beginner-friendly — Easier to follow than reading market structure
- Trend strength measurement — Indicators like ADX quantify trend strength
The Practical Answer: Combine Both
The best approach for most traders: use price action as the primary decision-making framework, and add one minimal indicator for confirmation.
- Price action + 200 EMA — The 200 EMA acts as a dynamic support/resistance level. Longs above, shorts below.
- Price action + volume — Volume confirms the conviction behind a price move.
Setting Up a Price Action Chart

Chart data: Evergreen reference · Last reviewed April 17, 2026
On TradingView
TradingView is the best free platform for price action trading:
- Open the chart for the stock (e.g. NSE:RELIANCE)
- Remove all indicators — click on each indicator name and select “Remove”
- Keep only the candlestick chart and volume bars
- Optionally add the 200 EMA (set period to 200)
- Use the horizontal line tool to mark key support and resistance zones
- Save the template as “Price Action Clean” for future use
For detailed setup instructions, see the complete TradingView setup guide.
On Zerodha Kite
- Open ChartIQ (full chart mode)
- Remove all default studies/indicators
- Set chart type to “Candle”
- Use drawing tools to mark horizontal support and resistance levels
- Switch between timeframes using the toolbar (D for daily, W for weekly)
Common Mistakes in Price Action Trading

Chart data refreshed on April 17, 2026 · Source: NSE (daily OHLC)
Trading Patterns Without Context
The single biggest mistake. A trader sees a pin bar and enters immediately — without checking whether it is at a key level, whether the trend supports the direction, or whether the timeframe makes sense. A pin bar in the middle of a range, far from any support or resistance, is not a setup. It is noise.
Overcomplicating the Chart
Some traders strip away indicators but add 15 horizontal lines, six trendlines, and Fibonacci levels at every swing. Keep it clean: three to five key levels on a daily chart, one or two trendlines, nothing more.
Ignoring the Higher Timeframe
A long setup on the 5-minute chart means nothing if the daily chart shows a strong downtrend. Rule: align the lower timeframe trade with the daily trend direction.
Chasing Instead of Waiting
The setup forms when price comes to the level — not when the trader decides they want to trade. Some of the best price action traders take only 3-5 trades per week because they wait for price to reach their predefined levels.
Using Too Small a Timeframe
Price action works best on the daily and 4-hour charts. Beginners should start with the daily chart exclusively — fewer but higher-quality signals.
The The Bottom LineAbout Price Action Trading

Chart data refreshed on April 17, 2026 · Source: NSE (daily OHLC)
Price action is not a shortcut. Traders who switch from indicators to naked charts expecting instant results are in for a reality check. Price action takes longer to learn than indicator-based trading — there are no specific numbers to follow. Traders must develop the skill to read charts, which comes only through months of screen time.
The payoff: once a trader can genuinely read price, that skill never goes away. Markets change, indicators fall in and out of fashion, but price action remains because price is the market.
Here is what matters: start with the daily chart. Mark three to five key levels. Wait for price to arrive. Look for a candlestick signal. Check the trend. If everything aligns, take the trade with a defined stop loss and target. If it does not align, do nothing.
Capital protection first, everything else second. Traders who survive long enough to develop genuine price action reading skills will have an edge that no indicator can replicate. For a complete risk framework, see Risk Management Basics.
Every satisfying trade started as a boring wait.
Test Your Knowledge: Price Action
Real Talk: No chart pattern, indicator, or strategy works 100% of the time. The SEBI study showing 93% of F&O traders lose money is not a scare tactic — it is a filter. Most of that 93% traded without a stop-loss, sized positions too large, or chased signals without understanding context. Risk no more than 1-2% of capital per trade. Keep a trading journal. The market rewards patience and discipline — not speed or boldness.
External Resources
- TradingView — Professional Charting Platform
- NSE India — National Stock Exchange
- Zerodha Varsity — Free Trading Education
- SEBI — Securities and Exchange Board of India
What is the defining characteristic of price action trading?
Why is price considered a leading signal compared to indicators?
What are the minimum confluences for a high-probability price action trade?
A pin bar at support is most significant when:
What is the biggest mistake price action traders make?
Frequently Asked Questions
| Tool | Indicator-based | Price action-based |
|---|---|---|
| Reading entries | RSI/MACD signals | Candlestick patterns + structure |
| Stop placement | Indicator level | Below/above swing high/low |
| Target setting | Fibonacci/projection | Prior support/resistance level |
| Decision speed | Wait for crossover | Read candle as it forms |
| Lag | Several candles | Real-time |
What is price action trading in simple terms?
Price action trading is the method of making buy and sell decisions by reading raw price movements on a chart — candlestick patterns, support and resistance levels, and trend structure — without using any technical indicators like RSI, MACD, or Bollinger Bands.
Is price action trading better than using indicators?
Neither is universally better. Price action provides faster, lag-free signals and develops deeper market understanding. Indicators provide objective, backtestable rules. Most experienced traders combine price action as the primary framework with one or two minimal indicators for confirmation.
Can beginners learn price action trading?
Beginners can and should learn price action, but it requires patience. Start with the daily chart, learn to identify trends and support/resistance levels, and practice spotting candlestick signals at key levels. It takes several months of consistent screen time to develop reliable reading skills.
What timeframe is best for price action trading?
The daily chart is best for learning and produces the highest-quality signals. The 4-hour chart is suitable for active swing traders. For intraday, the 15-minute chart works when combined with daily chart context. Avoid 1-minute charts — too much noise.
How many indicators should a price action trader use?
Zero to two. Pure price action uses no indicators. Most practical price action traders add either the 200 EMA as a trend filter or keep volume visible on the chart. Never add more than two overlays to a price action chart.
What are the best price action patterns to learn first?
Start with the pin bar (hammer/shooting star) at key support and resistance levels. Then learn the engulfing pattern and inside bar breakout. These three setups cover the majority of high-probability price action trades.
Does price action work on Nifty and Bank Nifty?
Price action works on all liquid instruments including Nifty 50, Bank Nifty, and any NSE stock with sufficient trading volume. The key requirement is liquidity — price action is less reliable on illiquid penny stocks.
How long does it take to become profitable with price action?
Most traders need six months to one year of focused practice to read price action consistently. This includes daily chart analysis, journaling every trade, and reviewing missed setups. The skill develops through repetition and honest self-assessment.
The Price Action Trader’s Decision Tree
Effective price action trading isn’t intuition — it’s a consistent decision framework applied to every setup. The following is the decision tree I run before every trade. If any step fails, the trade is skipped.
Step 1: Identify the higher timeframe trend. On the weekly chart, are we making higher highs and higher lows (uptrend), lower highs and lower lows (downtrend), or neither (range)? If the higher timeframe is trending, trades only go in the trend direction. If the higher timeframe is ranging, trades go from range-low support to range-high resistance.
Step 2: Identify the key level being tested. On the daily chart, is price currently at support, resistance, a prior breakout level (role reversal setup), or mid-range (no setup)? No level = no trade.
Step 3: Read the candle at the level. Look for: hammer/engulfing/doji (reversal signals), marubozu (continuation signals), or consolidation (wait-and-see). A neutral candle = no trade yet.
Step 4: Confirm volume. Is volume at the level significantly above or below average? Above-average volume = conviction (real signal). Below-average = noise (skip).
Step 5: Define entry, stop, target. Entry: close of confirmation candle. Stop: beyond invalidation level (not random percentage). Target: next opposite S/R zone. R:R minimum 1:2 or skip.
Running this decision tree takes 30-60 seconds per setup. Traders who skip steps 1-2 and rely on the candle alone (step 3) lose money at a statistically predictable rate. Every step exists for a reason — and every reason traces back to a losing trade I took by skipping that step in the early years.
Screen Time: The Unavoidable Cost of Price Action Skill
Price action trading has one uncomfortable truth that no course or book discloses clearly: it requires screen time. Recognising patterns, feeling when a level is truly being tested versus probed, sensing when volume is genuinely confirming versus masking — these come from watching thousands of charts, not from reading rules.
Here’s the honest timeline. In your first 500 hours of chart time, you’ll see every setup as either perfect or useless, with no gradations. In hours 500-1500, you’ll start to notice textures — the difference between a real breakout and a stop-hunt, the look of a trend that’s getting tired, the feel of capitulation on a panic bar. In hours 1500-3000, you’ll develop pattern recognition that runs below conscious reasoning — you’ll ‘know’ something is off about a setup before you can articulate why.
Shortcut rule: replay mode on TradingView. Load a stock’s daily chart, click the replay tool, and practice reading the chart bar-by-bar going forward. 30 minutes a day, 5 days a week, 50 weeks a year = 125 hours. Multiply that over 3 years and you’ll have 375 dedicated hours — a solid start without risking a single rupee.
My own practice from 2015-2017: I replayed three years of Nifty daily data, bar by bar, writing predictions for the next 5 bars before advancing. After 300-400 stocks, my predictions were right 45% of the time. After 600-800 stocks, 58%. That practice, more than any book or course, built my price-action intuition. It’s boring work. It’s also non-negotiable.
The trader who has put in 2,000 hours of chart reading will systematically outperform the trader who has read 50 books and put in 200 hours. Pattern recognition cannot be taught — only trained. Accept the timeline or pick a different method.
The Bottom Line on Price Action Trading
Price action is the oldest trading method in markets — tape-readers on the NYSE floor in 1920 were doing what we do now. The fundamentals haven’t changed: price goes up when buyers are more aggressive than sellers, and down when sellers are more aggressive. Everything else is commentary.
The appeal of indicators is that they feel scientific — RSI 30 means oversold, Supertrend green means bullish. But indicators are mathematical derivatives of price; they lag by design. A 14-period RSI is averaging 14 bars of price; by the time it signals, 10-12 bars of the move have already happened. Price action has no lag because it IS the price.
That said, price action trading is HARDER than indicator trading because it requires judgment. There’s no green arrow telling you when to buy. You have to read the chart, assess the setup, size the position, execute the entry. My recommendation for new traders: start with indicators for structure, but every week spend an hour reading pure candle charts without any overlays. Over 12 months, your eye develops.
Continue Learning
- For foundations: How to Read Stock Charts and What Are Candlestick Charts
- For structure: Swing Highs and Lows and Support and Resistance
- For execution: Volume in Trading and What is a Breakout
Markets are brutal, capital is finite, and no single trade should risk more than 2 percent of the account.
Price action doesn’t eliminate risk — it just removes the illusion of protection that indicators provide. Every candle pattern can fail; every S/R level can break. Size each trade assuming the setup fails, and you’ll survive the inevitable bad reads.