
Paper trading is executing a strategy with fake money on live market data to test your plan and your discipline before risking real capital. It is the single most effective way to kill bad habits safely. The catch: paper trading only helps if you treat every simulated trade exactly like a real one — same position size, same journal, same discipline.
New traders before they fund a real account, and existing traders testing a new strategy. If you’ve lost money in your first live month and need a reset, paper trading at 100% of your intended size is how you rebuild edge without bleeding more capital.
Paper trading gets dismissed as “not real” by traders who tried it lazily and found it did nothing for them. Done properly, with the same position size, journal, and discipline you would use live, it is the fastest way to prove — or disprove — that a strategy has an edge for you before real money is at stake.
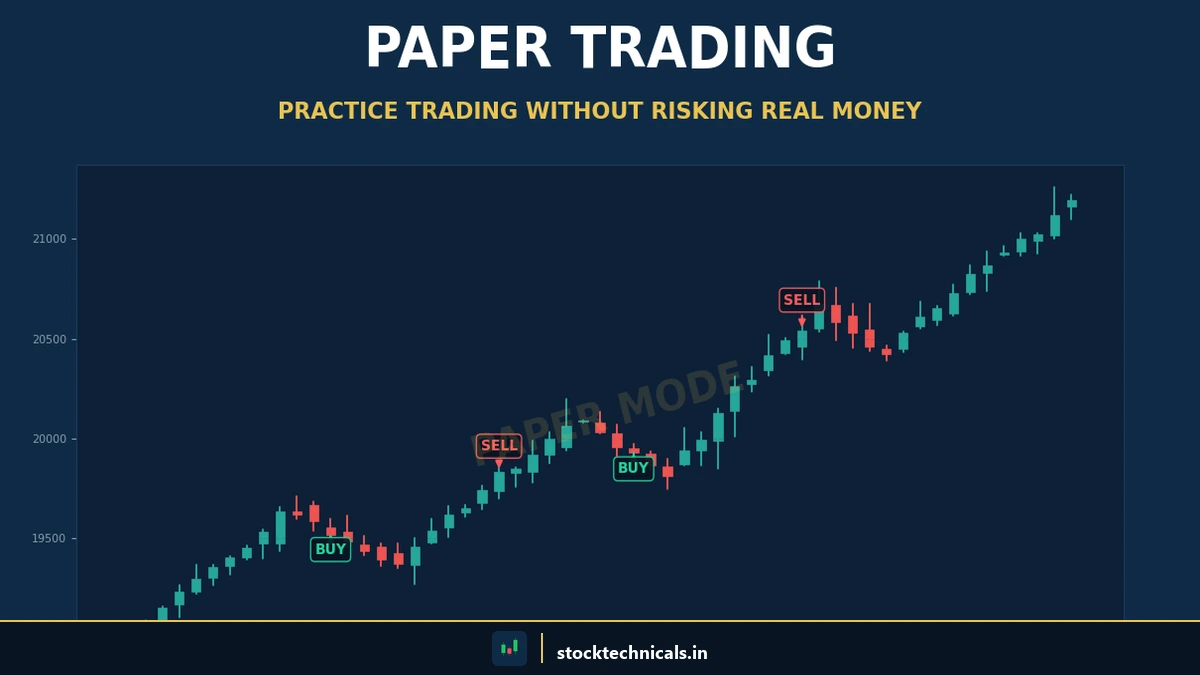
- Paper trading = live market data + simulated execution + real-sized positions + full journal.
- Minimum 30 trades across at least 30 trading days before moving to real capital.
- Readiness criteria to go live: > 50% win rate (if system targets that), > 1:2 average R-multiple, zero rule violations in last 10 trades.
- Start live at 25% of intended size. Scale to full size over four weeks of clean execution.
- TradingView Paper Trading (free on every plan), Sensibull’s virtual trading for options (free for Zerodha users), or a disciplined spreadsheet simulator provide enough realism — Zerodha itself does not offer a paper-trading account.
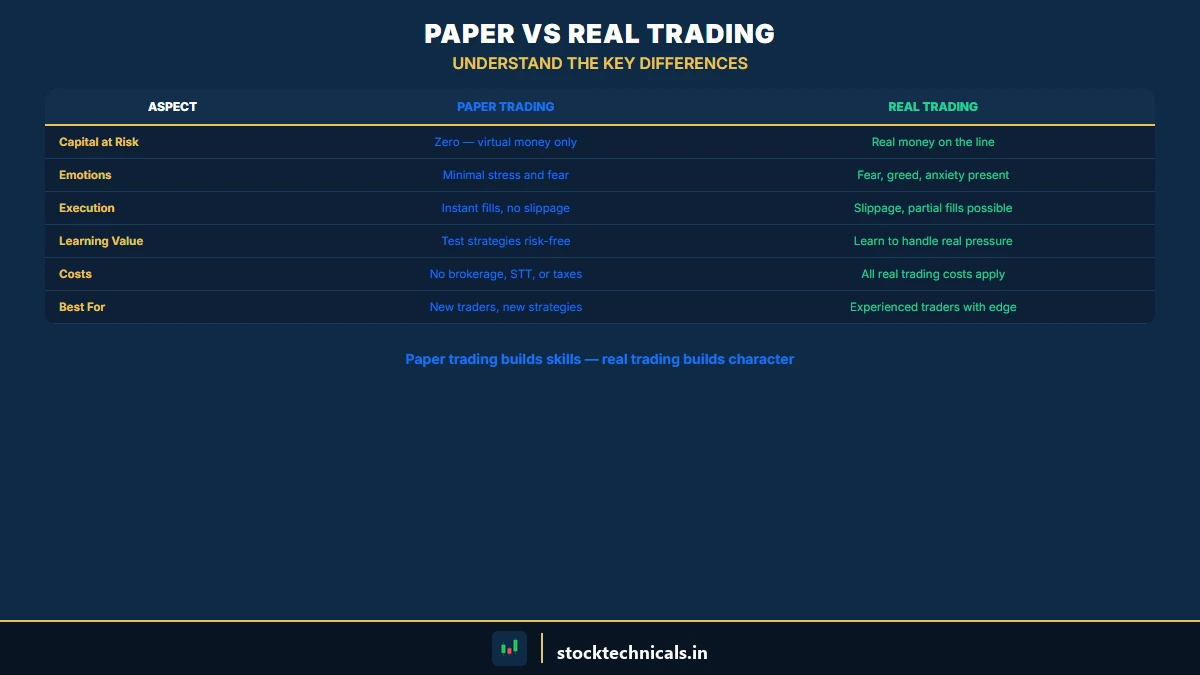
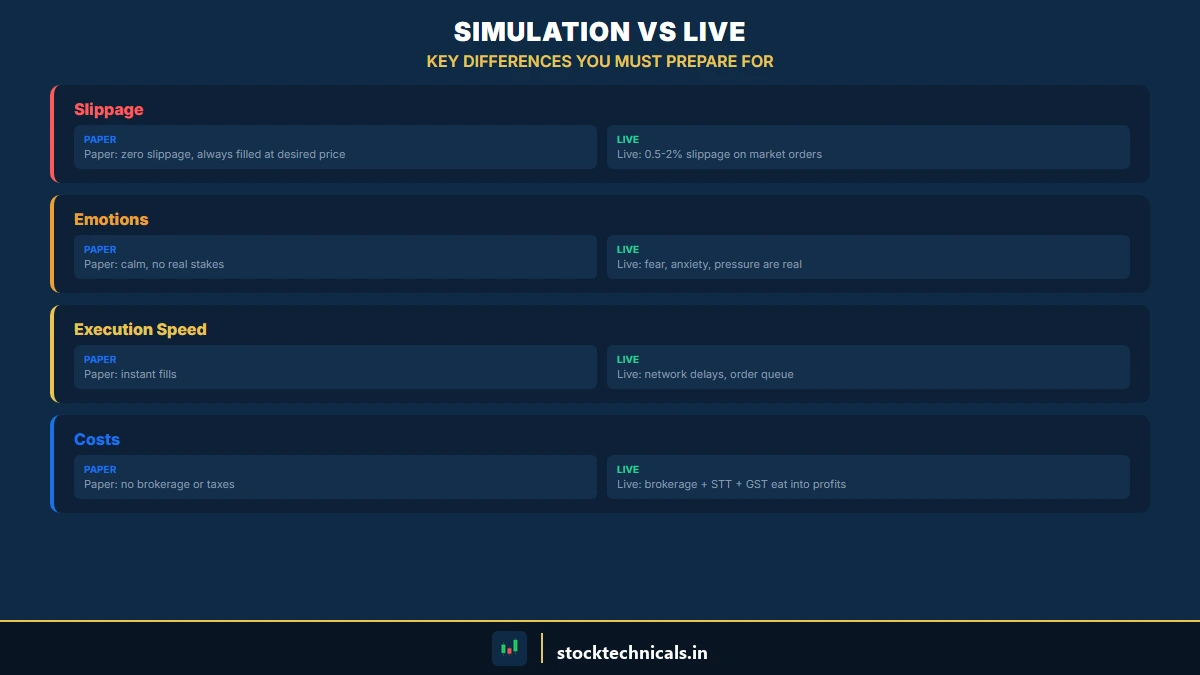
Paper trading vs real trading — what’s actually different
- Slippage — real execution prints sometimes 0.05–0.2% worse than the mid-price. Paper simulators usually fill at bid/ask or mid. Simulate a conservative 0.1% slippage penalty manually.
- Psychology — the real brain treats fake money differently. Paper trading cannot fully prepare for a ₹30,000 red P&L on a live account. Going live at 25% size bridges the gap.
- Brokerage and taxes — most simulators skip these. Track them manually: STT, stamp duty, GST, brokerage. They’re 10–25 basis points of each trade round-trip.
- Market impact — not meaningful at retail size on Nifty/Bank Nifty but can matter on small-caps. Prefer paper-trading on instruments where impact is negligible at your planned size.
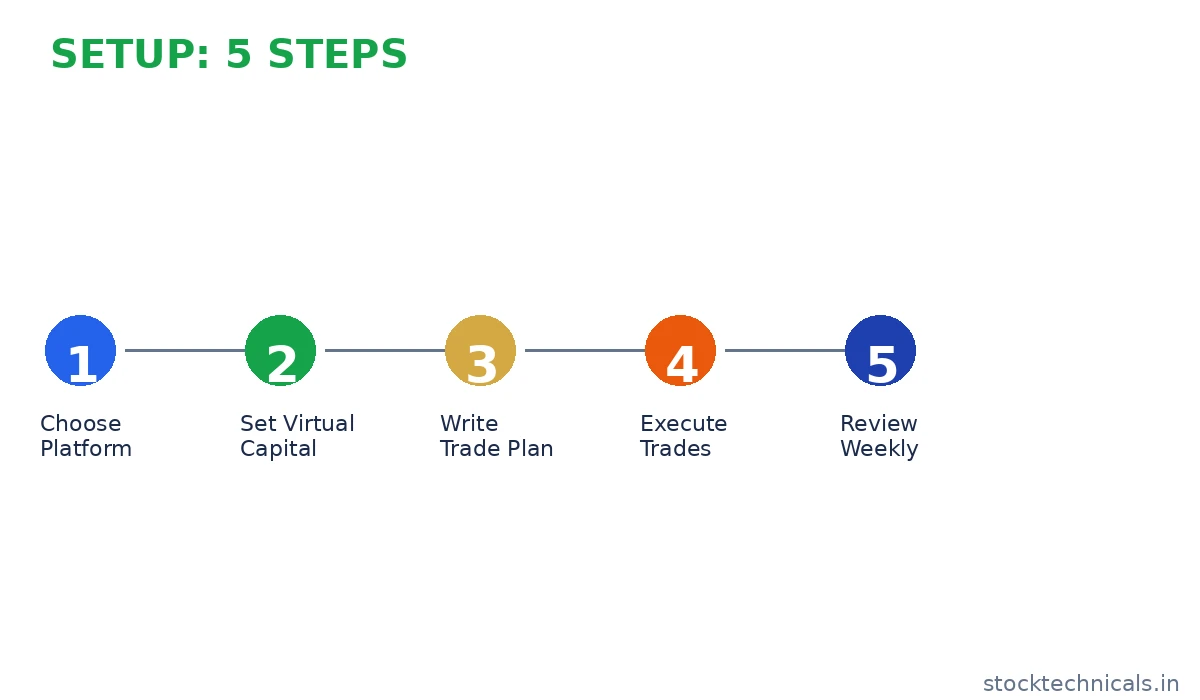
Setting up paper trading in five steps
- Pick your platform. TradingView Paper Trading (free), Sensibull’s virtual trading for options (free for Zerodha users), or a spreadsheet-only manual simulator all work. Consistency matters more than features.
- Fix starting capital at the exact amount you plan to go live with — say ₹5,00,000. Smaller or larger creates unrealistic P&L feelings.
- Use your actual position-size formula. If your plan is 1% risk per trade, that’s ₹5,000 max loss per trade — size every paper trade to that.
- Journal every trade. Entry, exit, R-multiple, rule violations, pre-trade emotion. Identical format to the journal you’ll keep live.
- Record slippage and brokerage manually on each trade. Deduct from P&L so your simulated account mirrors real friction.
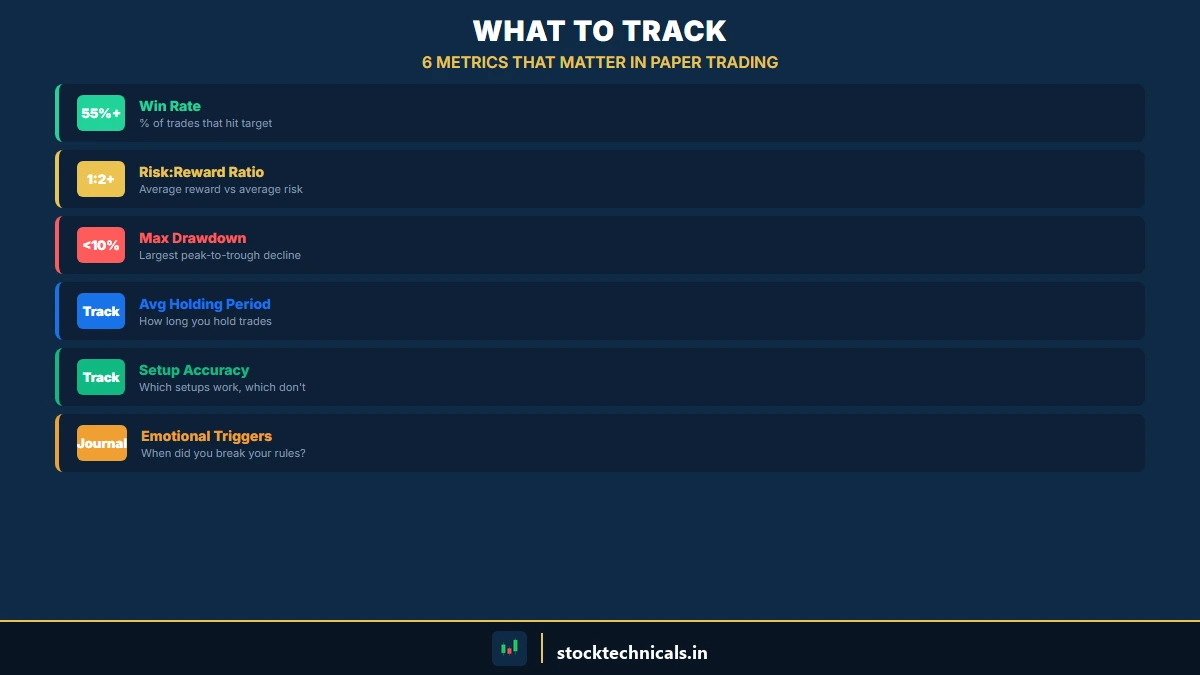
What to track during paper trading
- Win rate — percentage of trades that closed profitably. Varies by strategy; 40–60% is typical for balanced systems.
- Average R-multiple — average win size divided by average loss size. > 1:2 is the minimum for most retail strategies to be profitable after friction.
- Rule-violation rate — percentage of trades where you broke your own plan. Target < 10%.
- Maximum consecutive losses — the emotional stress test. You’ll face this live; better to face it in simulation first.
- P&L curve shape — a steady rise beats a jagged zig-zag with the same endpoint. Smooth curves correlate with real-world sustainability.
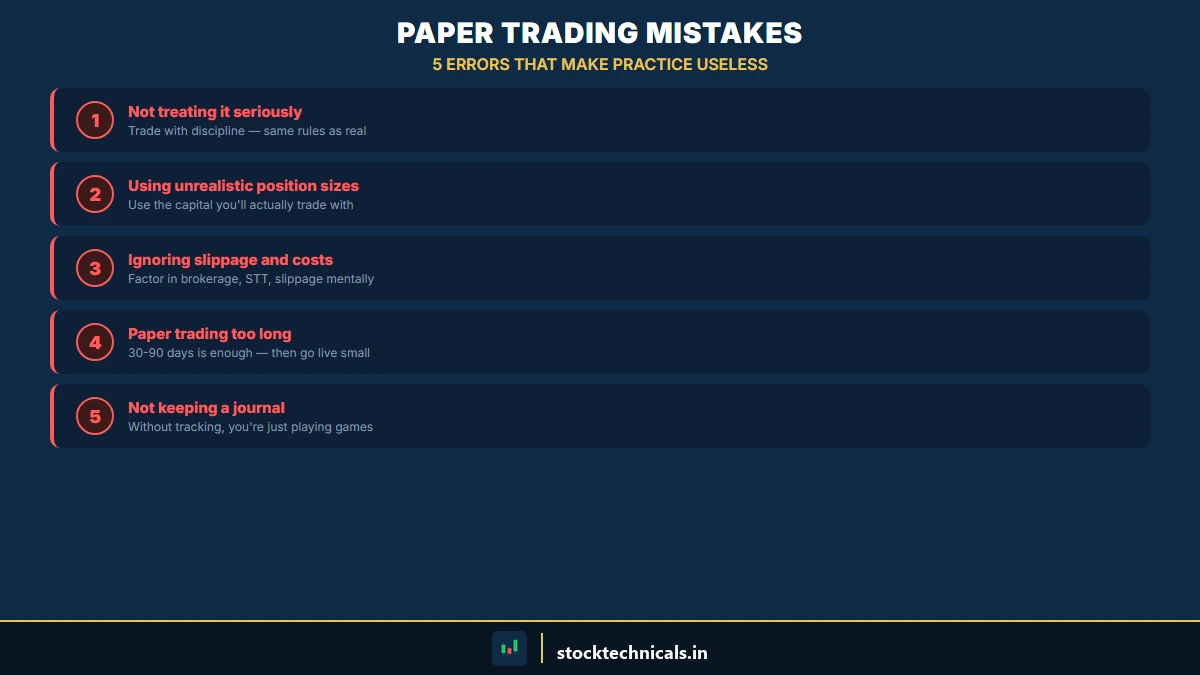
Five paper trading mistakes that waste the whole exercise
Sizing bigger than real
Taking ₹50,000 paper positions when your real plan says ₹5,000 makes the P&L feel unreal. Match size exactly.
Skipping the journal
Paper trading without a journal just generates numbers. The journal is where you learn the patterns — skipping it means simulating without learning.
Ignoring slippage and brokerage
Strategies that look profitable on paper often lose money live because paper skipped friction. Deduct 10–20 basis points per round-trip trade.
Cherry-picking setups
Paper traders often take only the “best” setups and skip the questionable ones, producing a fake win rate. Take every signal your rules generate, including the ones that look doubtful.
Going live too early
Twenty paper trades is not enough. Minimum 30 trades, minimum 30 days. Going live sooner means the first losing streak you face is with real money, not fake.
The 10-week transition timeline
- Weeks 1–4 — paper trade at full intended size, 30+ trades, full journal, slippage/brokerage deducted.
- Week 5 — review readiness criteria (win rate, R-multiple, rule-violation rate). Go/no-go decision.
- Weeks 6–7 — live trade at 25% of intended size. Minimum 10 real trades.
- Weeks 8–9 — if rule violations < 10%, scale to 50% of intended size.
- Week 10+ — full size. Quarterly rebuilds as needed.
Paper trading vs backtesting
- Backtesting — running your strategy against past data. Fast (can evaluate years in minutes), free of emotion, but prone to curve-fitting and survivorship bias.
- Paper trading — running your strategy against live data in real time. Slow (one session per day), but captures real decision-making friction.
- Both together — backtest first to confirm the idea has statistical edge on historical data, then paper-trade to confirm you can execute it in real time without deviating.
Five rules for effective paper trading
Rule 1 — Match real size exactly
If real plan says ₹5,000 risk per trade, paper risk is ₹5,000. Not ₹50,000. Not ₹500.
Rule 2 — Deduct friction every trade
10–20 basis points per round-trip trade. Write it into the P&L manually. If your strategy can’t profit after friction, find out on paper, not live.
Rule 3 — Take every signal, not just confident ones
Cherry-picking fakes your win rate. Take every signal your rules fire; the ones that look shaky are the real test.
Rule 4 — Full journal, same as live
Entry, exit, R-multiple, emotion, rule violations. The journal is the deliverable, not the P&L.
Rule 5 — 30 days and 30 trades minimum
Anything less is statistically unreliable. One week of winners doesn’t prove anything; one month with 30 trades starts to.

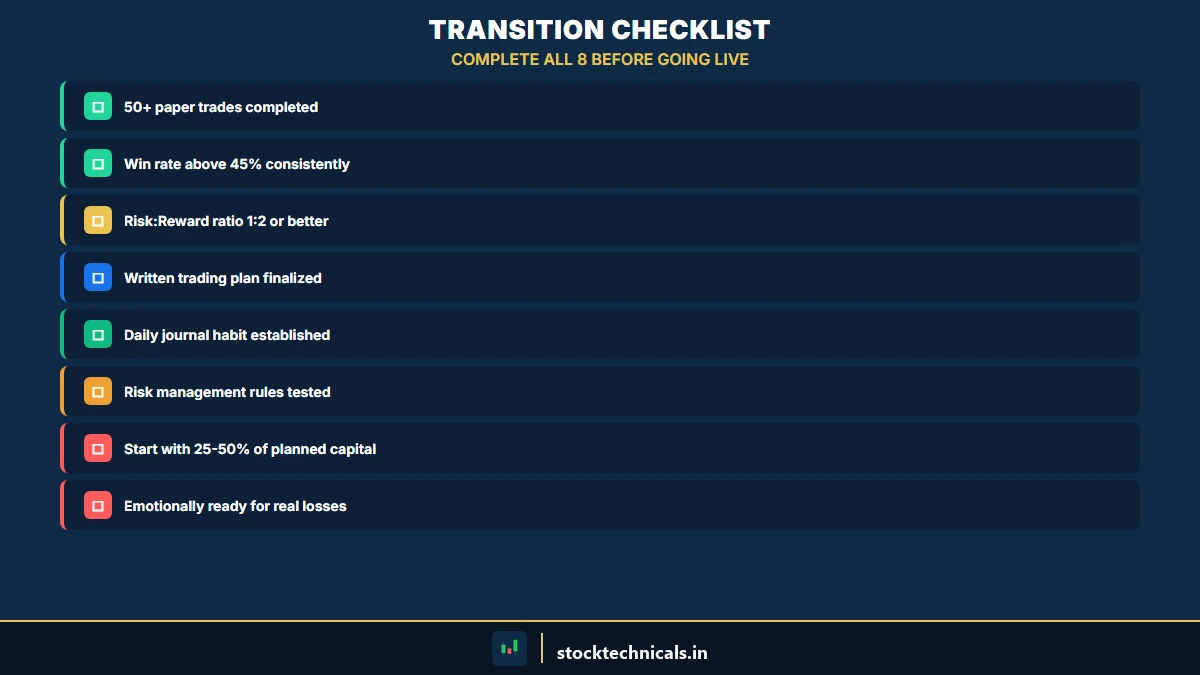
Readiness checklist to go live
- At least 30 paper trades across 30 trading days?
- Win rate within the range your strategy expects (roughly 40–60%)?
- Average R-multiple > 1:2 after friction deducted?
- Rule-violation rate below 10%?
- Survived at least one three-loss streak without breaking discipline?
- Journal complete for every paper trade?
- Plan is written, printed, and ready for the live-trading phase?
- First live trade is at 25% of intended size, not 100%?
Any no = stay on paper. Going live early is the most expensive shortcut in trading.
How long should I paper trade before going live?
Minimum 30 trades across 30 days. 60 trades is when most strategies reveal genuine edge.
Is paper trading really the same as real trading?
About 80%. The gap is emotional. Going live at 25% of intended size bridges the gap without risking full capital.
Which paper platform is best for Indian markets?
TradingView Paper Trading (free, NSE/BSE symbols), Sensibull virtual trading (options), or TradingView’s Bar Replay for stepping through past sessions. Any works if you’re disciplined.
Can I skip paper trading with small real money?
No. Small real money still generates emotion and friction. Paper first, then go live at 25% of intended size.
Paper wins but live loses — why?
Size mismatch, cherry-picking, or unaccounted friction. Review your journal; the pattern will be obvious.
Paper-trade new strategy with live experience?
Yes. Experience on one strategy doesn’t transfer to another. 30 trades on paper for any new system.
How do I simulate slippage?
Deduct 0.05–0.1% from entry and exit prices. Manual but accurate.
Test Your Knowledge
Q1: Minimum paper trading duration before going live?
Q2: Paper trade position size should be:
Q3: When going live, start at what size?
Q4: Which is NOT a valid reason to skip paper trading?
Q5: Slippage simulation during paper trading should subtract about:
Your next step
If your paper trading is hitting the readiness criteria, read How to Build a Trading Plan to make sure your plan is printed and visible before you fund a real account.
The Bottom Line
Paper trading works if you do it seriously: real size, full journal, every signal taken, friction deducted, 30 trades minimum. The transition plan is 25% size for two weeks, 50% for two weeks, then full. Skipped or sloppy paper trading is why first-year live accounts typically end below starting capital. Paper the strategy until it’s boring — then go live small.
Educational content only — not SEBI-registered investment advice. Paper trading performance does not guarantee live results. Emotional and execution differences mean live accounts typically underperform simulated ones until size is matched exactly. Size every trade so a full stop-out costs less than 1% of capital. Never trade with borrowed money.