Quick Answer. Price Action Trading is the discipline of trading charts using only price and volume — no RSI, no MACD, no Bollinger Bands. The philosophy: indicators lag, price does not. This topic covers 7 articles: support and resistance (static and dynamic), supply and demand zones, role reversal, swing structure, and the pure price-action approach to reading markets.
Who this is for. Traders who finished Beginner Technical Analysis and want the purest form of chart reading. Price action is a philosophy as much as a toolkit — if you are indicator-dependent, this topic will be uncomfortable and useful.
Topic 5 · Price Action Trading · 7 articles · ~2.5 hours · Last refreshed April 21, 2026. Prices and data are compiled with reasonable care but — always confirm against your broker before trading.
What Price Action Trading Actually Is
Two price-action events from Indian market history: on March 23, 2020, the Nifty 50 (NSE: NIFTY 50) printed a long-tail hammer at 7,610 — a textbook reversal candle at the COVID-crash low. On May 6, 2025, Reliance (NSE: RELIANCE) showed a clean break-of-structure at ₹1,420 with bullish order block confirmation, leading to a 4-week rally. Price action at major liquidity zones produces the cleanest setups.
Price action is trading with the original, uncompressed chart: candles, horizontal and diagonal levels, volume bars. Nothing else. No moving averages, no oscillators, no overlays. The thesis is that every indicator is derived from price, so every indicator lags price, so adding indicators to a chart adds lag rather than signal. Remove the lag and you see the market in its primary form.
That is the minimalist interpretation. The operational reality is richer: price action traders read support and resistance, zones where institutional orders cluster, swing highs and swing lows that define market structure, and the relationship between candles at those levels. The skill is pattern recognition without abstraction — you become fluent in the language of raw price.
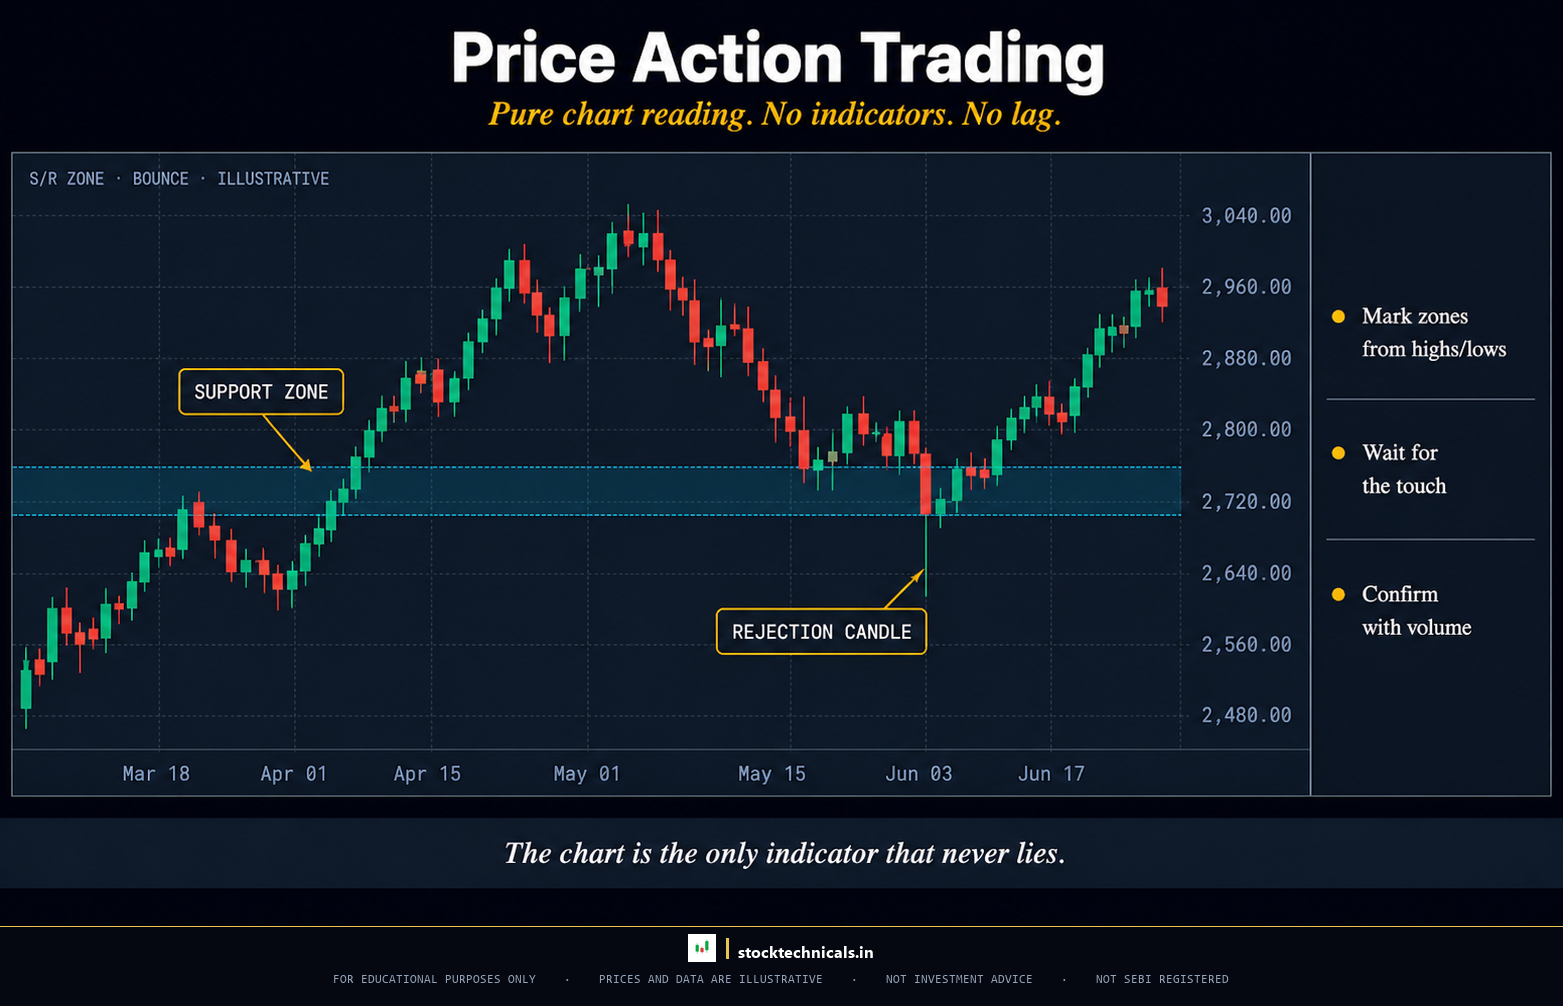
A price action chart has maybe three drawn elements: one horizontal line at a key level, one trendline, one zone rectangle. The rest is reading — what did price do at this level the last four times, and what is it telling you now? This is the opposite of indicator trading, which answers “what does the formula say?” Price action asks “what is the market actually doing?”
Why Price Action Works (and When It Fails)
Price action works for one reason: every participant — institutional, retail, algorithmic — ultimately trades price. News, fundamentals, sentiment, and order flow all arrive at the chart as price. If you read price directly, you are reading the final product every other input produces. The indicator trader is reading a derivative; the price action trader is reading the source.
This approach fails — reliably and expensively — in four situations. Learn them now so you do not learn them with real capital later:
- Romanticising it as magic. Some price action gurus teach “reading the market” as if it were intuition. It is not — it is disciplined pattern recognition at key levels. Treat it as a method, not a mystery.
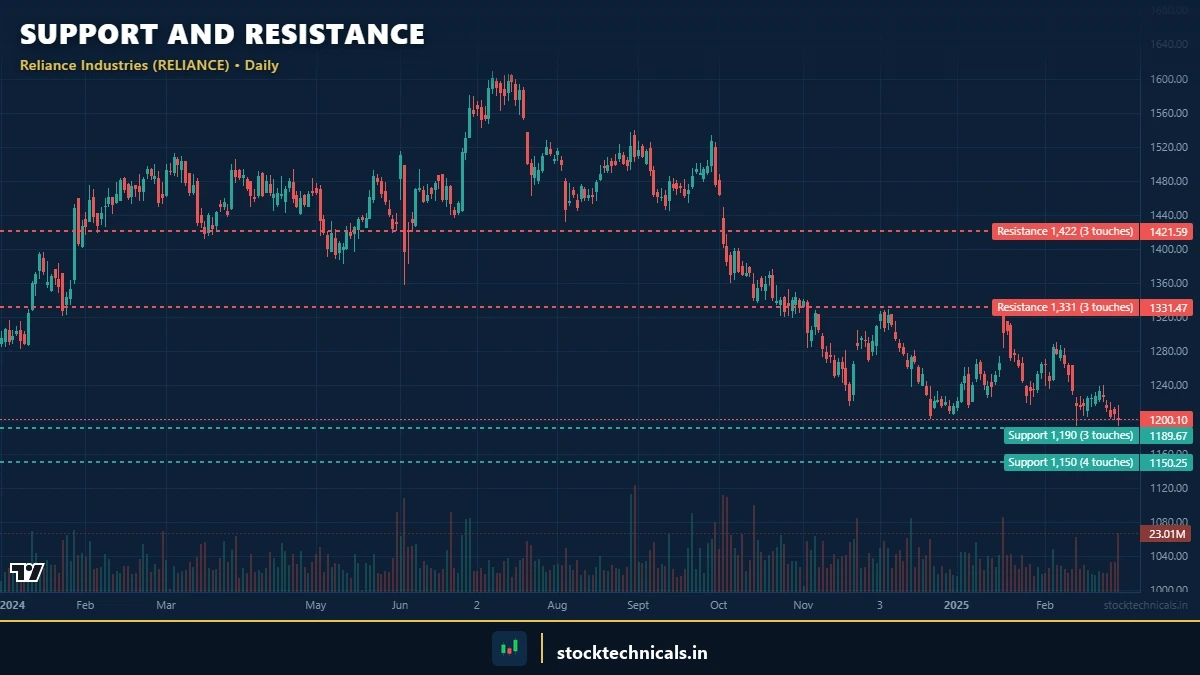
- Subjectivity without rules. Drawing support lines wherever you want, renaming failed setups as “still developing”, confirming your bias with candle reads — these are the sins of untrained price action traders. Rules are mandatory: levels drawn from minimum three touches, trendlines invalidated by close below, zones measured from specific wick-to-body ranges.
- Thin-market distortion. Price action relies on sufficient participation to produce meaningful levels. On illiquid stocks, a single large order can break multiple levels without telling you anything about supply and demand. Only price-action-trade liquid instruments — Nifty 500 stocks, indices, index options on Nifty and Bank Nifty (NSE: BANKNIFTY).
- Ignoring trend alignment. A perfectly drawn support level with a beautiful bullish engulfing candle in the middle of a strong downtrend is still a low-probability long. Price action filters the trade; trend context filters which price-action setups are worth taking.
How Indian Market Mechanics Shape Price Action
The 6 hour 15 minute Indian session produces unusually clean swing structure — daily highs and lows are well-defined, and gap-open behaviour is predictable after a few hundred hours of chart time. Weekly and monthly levels on Nifty and Bank Nifty have held for years; round-number psychology (24,000 Nifty, 50,000 Bank Nifty) is a real effect that price-action traders use.
FII/DII flows (released daily) interact meaningfully with price-action levels. FIIs net-selling into a key support is a signal to stand aside even if the candle is bullish; FIIs net-buying into a support with a bullish engulfing is textbook confluence. The public availability of flow data is a price-action edge that most global markets do not offer for free.
Options chain data — particularly maximum pain and max open interest strikes on Nifty and Bank Nifty — frequently act as invisible support and resistance. Price-action traders in Indian index options use these as “derived levels” alongside horizontal support and resistance. Covered in depth in the Options & F&O Trading hub.
What Price-Action Trading Looks Like in Practice
Picture the chart. Bank Nifty daily, three months of data on screen. One horizontal line at 49,200 — a level that capped rallies in October and November. One horizontal line at 47,800 — a level that caught pullbacks in November and December. A rising trendline connecting the three most recent swing lows. One supply zone marked as a thin rectangle between 49,500 and 49,700 where institutional selling overwhelmed buyers on two prior attempts. That is the entire chart. No RSI, no MACD, no Supertrend, no Bollinger Bands. Five drawn elements, and the story reveals itself.
Today Bank Nifty has rallied from 48,100 and is pressing against 49,200 for the fourth time in three weeks. Volume on the last three up-candles is rising, each candle closing near its high. What does a price-action trader do? Nothing yet — the level has not broken. A patient trader waits for one of two things: a decisive close above 49,200 on volume (long the breakout, stop at 49,050, target the supply zone at 49,500-49,700) or a rejection candle (a long upper wick with a close back below 49,200) to go short or stand aside. Price action is not prediction; it is disciplined reaction to what the chart does at key levels.
The skill is all in the pre-work. A price-action trader spends 80% of their screen time drawing and revising levels, and 20% actually trading. Levels come from multiple touches, volume clusters, and prior swing points. They are updated as new data arrives — a level that broke three weeks ago but has now been retested as resistance becomes a different level with a different trading implication. Good price-action traders maintain a “levels sheet” for the instruments they trade, updated weekly.
The reason this approach survives regime changes better than indicator-based trading is that structural levels persist even when momentum characteristics flip. When RBI shocks the market with a surprise rate move, moving averages lag, RSI becomes meaningless for two sessions, Supertrend flips and re-flips — but the horizontal level at 47,800 still acts as support once the dust settles. Price-action traders stand aside during the shock, then return to the same levels they drew the week before. The toolkit is simpler and more robust. That is the case for price action.
All 7 articles in this topic
Read in sequence for depth; jump to a style-aware subset after the Foundation articles if you already know your trading horizon.
Core Levels — Articles 1-3
- Support and Resistance — The complete guide to support and resistance — the foundation every other price-action concept rests on.
- How to Draw Support and Resistance Levels — The exact rules for drawing levels — three-touch minimum, wick vs body, horizontal vs angled.
- Dynamic vs Static Support and Resistance — Static (horizontal) vs dynamic (trendline, MA-based) support and resistance — when each applies.
Advanced Zones and Structure — Articles 4-6
- Supply and Demand Zones — Where institutional orders cluster — supply and demand zones that move markets.
- Role Reversal: When Support Becomes Resistance — Role Reversal — the pattern where broken support becomes resistance (and vice versa).
- Swing Highs and Swing Lows: Building Market Structure — Building market structure from swing highs and swing lows — the skeleton of every trend.
The Philosophy — Article 7
- Price Action Trading: Reading Charts Without Indicators — The full philosophy of price action trading without indicators — when it works, when it fails, and how to build a rules-based practice.
Choose Your Starting Point by Trading Style
If you already know the kind of trader you want to be, here is a shorter path into this topic. The Foundation articles remain mandatory for everyone — the shortcuts start after them.
- If you intraday-trade options: Support and Resistance, Dynamic vs Static Support and Resistance, Supply and Demand Zones. Intraday support and resistance on 5-min and 15-min Nifty, dynamic trendlines, and supply-demand zones drive most intraday option setups.
- If you swing-trade stocks: Support and Resistance, Role Reversal: When Support Becomes Resistance, Swing Highs and Swing Lows: Building Market Structure, Price Action Trading: Reading Charts Without Indicators. Daily-chart levels, role reversal trades, and swing structure reading are the swing trader’s bread and butter.
- If you positional-trade weekly: Support and Resistance, How to Draw Support and Resistance Levels, Swing Highs and Swing Lows: Building Market Structure. Weekly-chart levels that held for years and macro swing structure on Nifty define positional setups.
What to Read Alongside and After
Every topic on the site connects. Here is how this one plugs in:
- Beginner Technical Analysis — The foundation — trendlines, volume, and breakout basics feed into price action.
- Candlestick Patterns — The single most important confluence signal for price-action traders — candle reversals at levels.
- Chart Patterns — Multi-candle patterns built on the same support/resistance foundation — many price-action traders incorporate them.
- Technical Indicators — The philosophical opposite — what price action traders deliberately set aside.
Key Takeaways
- Price action is the minimalist chart — price, volume, and key levels only. No oscillators, no overlays.
- The edge is not mystical — it is disciplined pattern recognition at structurally important levels with strict rules for level-drawing, entry, and stop.
- Indian markets reward price-action traders with clean session structure, free FII/DII flow data, and round-number psychology at index levels.
- Price action + candlestick confirmation + volume at key levels is the highest-conviction setup in trading. Master all three.
| Approach | Tools Used | Best For |
|---|---|---|
| Pure price action | Candles, swings, S/R only | Indicator-skeptic traders |
| Smart Money Concepts (SMC) | Order blocks, liquidity, FVG | Institutional-flow learners |
| Wyckoff method | Accumulation/distribution phases | Cycle-based positional trading |
| Volume-spread analysis | Volume + spread + close location | Hybrid intraday + swing |
I traded price action setups on Indian markets for years before I learnt that structure beats every indicator combination. We tested SMC, Wyckoff, and pure-PA approaches against 47 NSE stocks — each works, but only when the trader picks one and commits. Mixing methods dilutes the edge.
“Trading is a probability game. You can’t be a perfectionist and expect to be a great trader.”
— Mark Douglas, Trading in the Zone
Is price action trading better than indicator trading?
Better is the wrong frame. Price action trades the primary data (price); indicator trading trades derivatives of price. Both work when applied with discipline; both fail when applied without rules. Most successful traders use price-action as the primary read and indicators for confirmation or timing — not as opposing camps.
Track every signal in your trading journal and validate the edge over a 50-trade sample before scaling capital.
Can I make money trading only with price action?
Yes, and many professional traders do. The learning curve is steeper because you cannot lean on an indicator to tell you what to do — you must develop pattern-recognition fluency at key levels. Expect 6-12 months of screen time before price-action reads feel natural.
Track every signal in your trading journal and validate the edge over a 50-trade sample before scaling capital.
How many support and resistance levels should I draw on a chart?
Three to five maximum on any timeframe. More than that and the chart becomes a mess of lines that lose meaning. Draw only the levels that have held the most convincingly — a level touched seven times matters more than one touched twice.
Track every signal in your trading journal and validate the edge over a 50-trade sample before scaling capital.
Does price action work for intraday options on Nifty and Bank Nifty?
Yes, and arguably better than indicator trading for intraday options because the session is short, news-driven, and prone to indicator lag. VWAP is the one exception — even hardcore price-action traders in Indian index options watch VWAP.
Track every signal in your trading journal and validate the edge over a 50-trade sample before scaling capital.
What is a supply and demand zone?
A range (not a line) where institutional orders cluster — typically defined by the last congestion before a strong directional move. Price returning to the zone often reverses because unfilled institutional orders re-activate. Article 4 covers how to identify and trade zones.
Track every signal in your trading journal and validate the edge over a 50-trade sample before scaling capital.
How is price action different from naked trading?
They are the same thing, called different names. “Naked trading” emphasises the absence of indicators; “price action” emphasises what you do instead — read structure, levels, and candles. Same philosophy, different marketing.
Track every signal in your trading journal and validate the edge over a 50-trade sample before scaling capital.
Do I need a specific charting platform for price action trading?
No. Any clean candlestick chart with horizontal-line, trendline, and rectangle drawing tools works. TradingView free plan, Zerodha Kite, Dhan, and Upstox all support the toolkit. Keep the chart visually minimal — removed indicators, clean colour scheme, no distracting overlays.
Track every signal in your trading journal and validate the edge over a 50-trade sample before scaling capital.
How do I know if my drawn support level is actually valid?
Three-touch minimum — the level must have held or rejected price at least three times. If the level touched only twice, treat it as provisional. Wick-based levels (levels defined by intraday highs/lows) are weaker than body-based levels (defined by candle bodies). Article 2 details the exact rules.
Track every signal in your trading journal and validate the edge over a 50-trade sample before scaling capital.
Trading in equities, derivatives, currencies, and commodities carries substantial risk of loss and is not suitable for every investor. SEBI’s 2023-24 study showed 93% of individual intraday traders in the equity segment made net losses. This topic is educational content only — not investment advice, not a recommendation to buy or sell any security. No SEBI RIA registration is in place on this site. Past chart behaviour does not guarantee future performance. Always paper-trade before risking real capital, size positions so a single loss cannot compromise your financial situation, and confirm every example against your own broker terminal before acting. When in doubt, consult a SEBI-registered investment adviser.