Every charting platform offers both Simple Moving Averages and Exponential Moving Averages with the same default period — 20 days. Same input, same number, same line colour. But when a trend reverses, one of them turns before the other, and that matters in real Rupees.

Chart window: Feb 2020 – Jun 2020 · Data refreshed April 17, 2026 · Source: NSE (daily OHLC)
Key Takeaways
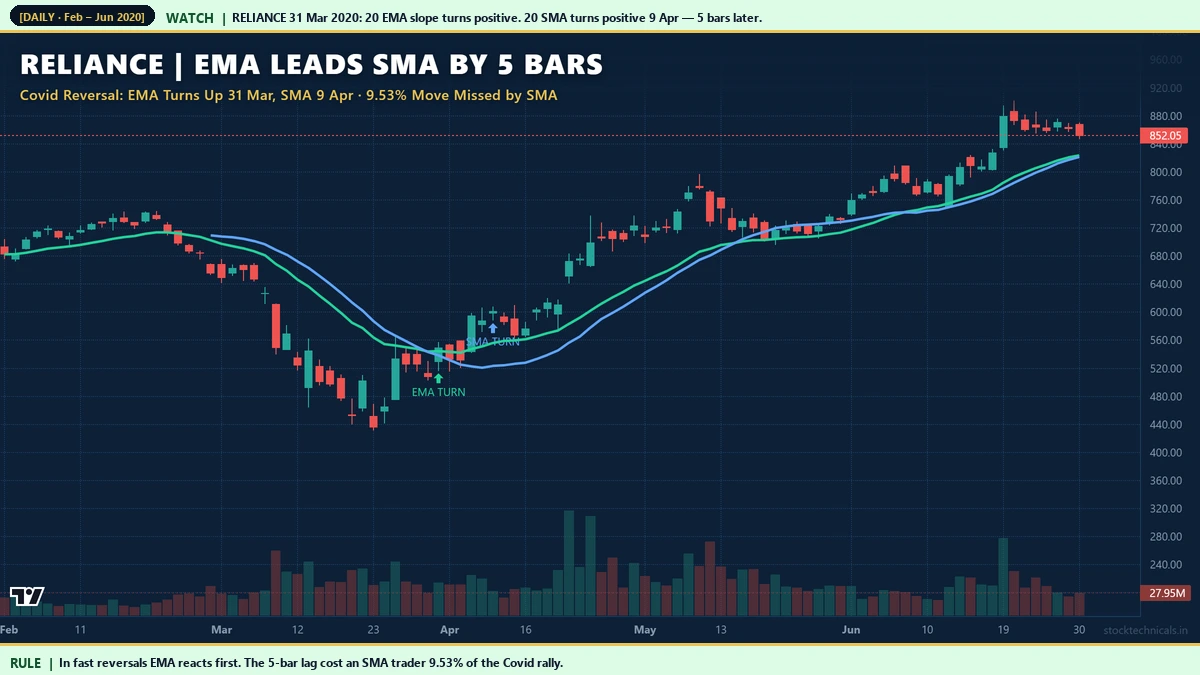
- EMA reacts to reversals first. On Reliance at the March 2020 Covid bottom, EMA turned up on 31 March. SMA did not turn up until 9 April — 5 bars later. The stock rose 9.53 percent during those 5 bars.
- SMA wins in choppy markets. When price oscillates around the moving average without trend, SMA’s smoothing reduces whipsaws. EMA produces more false signals in noise.
- The gap grows with reversal gradualness. Sharp reversals give EMA a 3-5 bar lead. Grinding bottoms (like Bank Nifty June 2022) extend that lead to 9 bars or more.
- For swing and position trading in trending markets, use EMA. For day trading in choppy intraday markets or for long-term position filters in range-bound stocks, use SMA.
- Both converge during steady trends. HDFC Bank mid-2023 showed nearly identical SMA and EMA signals. The difference only surfaces at turns and in noise.
The Core Difference in One Chart
A Simple Moving Average is an average in the literal mathematical sense: add up the last N closes and divide by N. Every price bar gets exactly the same weight. An Exponential Moving Average, by contrast, uses a recursive formula that silently fades older bars. The newest bar gets a big weight; the bar from 10 days ago gets a small weight; the bar from 40 days ago is nearly forgotten but not quite.
The mathematical difference sounds subtle. The practical difference is stark at every trend reversal.

Chart data: Evergreen reference · Last reviewed April 17, 2026
The Formulas, Compared
SMA(n) = (C1 + C2 + ... + Cn) / n

EMA(today) = (Close_today × α) + (EMA_yesterday × (1 − α))
   where α = 2 / (n + 1)
For a 20-period average: the SMA assigns 5 percent weight to every one of the last 20 bars (1/20 each). The EMA assigns 9.52 percent weight to today, 8.62 percent to yesterday, 7.8 percent to two days ago — a smooth exponential decay — and only trace weight to bars older than 40 sessions.

Chart data: Evergreen reference · Last reviewed April 17, 2026
Example: Reliance at the 2020 Covid Reversal
The Lag Scales with Reversal Speed
The EMA-leads-SMA principle is not a fixed number of bars. The lag grows with how gradual the reversal is. Sharp V-shaped bottoms give EMA a 3-5 bar advantage. Rounded U-shaped bottoms can stretch that to 9 bars or more.

Chart window: Apr 2020 – Aug 2020 · Data refreshed April 17, 2026 · Source: NSE (daily OHLC)
On Bank Nifty (NSE: BANKNIFTY)’s May 28, 2020 reversal — a sharp V-bottom after post-lockdown panic — the gap was 3 bars. The index rallied 7.1 percent during those 3 sessions.

Chart window: Apr 2022 – Sep 2022 · Data refreshed April 17, 2026 · Source: NSE (daily OHLC)
The same index at a very different kind of bottom — the slow, grinding reversal of June 2022 — stretched the lag to 9 bars. Bank Nifty’s EMA turned up on 27 June, SMA not until 8 July. An investor watching only SMA was nine days late to that reversal.
Side-by-Side: Same Stock, Same Period

Chart window: Jan 2024 – Jun 2024 · Data refreshed April 17, 2026 · Source: NSE (daily OHLC)
On Nifty 50 H1 2024, overlaying the 20 EMA and 20 SMA makes the behaviour visible on every bar. The EMA hugs price, tracking each directional change within 2-3 sessions. The SMA floats behind, catching up slowly. In steady trend phases the two lines converge; at reversals they fan apart and the EMA points the way first.
When SMA Actually Wins
The EMA is not universally better. In choppy sideways markets, its speed is a liability. When price oscillates around the MA line without sustaining direction, the EMA crosses back and forth more often than the SMA, generating more false signals.

Chart window: Jan 2022 – Jun 2022 · Data refreshed April 17, 2026 · Source: NSE (daily OHLC)

Chart data: Evergreen reference · Last reviewed April 17, 2026
Interactive Tool: SMA vs EMA Comparator
Toggle between four market scenarios — sharp reversal, choppy market, steady uptrend, single price spike — and see how SMA and EMA each respond. Adjust the period and noise sliders to test different lookbacks and volatility conditions. The stats show peak values and standard deviation for each MA, quantifying which one is more responsive and which one is smoother.
When Both Work: Steady Trends

Chart window: Apr 2023 – Oct 2023 · Data refreshed April 17, 2026 · Source: NSE (daily OHLC)
When a stock trends smoothly and steadily, both SMAs and EMAs track the move with equal quality. HDFC Bank from April to October 2023 rose in an orderly fashion; the 20 EMA and 20 SMA produced the same actionable signals throughout. The difference only matters at turns and in noise. In steady phases, you can pick whichever one you prefer aesthetically.
Same Principle, Longer Period

Chart window: Jul 2022 – Sep 2023 · Data refreshed April 17, 2026 · Source: NSE (daily OHLC)
The EMA-leads-SMA principle is period-agnostic. At the 50-period setting that position traders use, Bank Nifty’s 50 EMA turned up first at the mid-2022 regime change; the 50 SMA followed. The magnitude is larger but the behaviour is identical. Pick the MA type based on your market state; pick the period based on your holding time.
A Practical Rule Book
- Swing trading a trending stock: use 20 EMA. Faster reversal detection pays off.
- Day trading an intraday choppy session: use 20 SMA or 9 SMA. Smoother signal reduces whipsaw losses.
- Long-term position filter on a range-bound sector (FMCG, pharma): use 50 SMA. The smoothness matters more than reaction speed.
- Long-term position filter on a trending sector (banking, metals in upcycle): use 50 EMA. Turns react to cycle change first.
- 200 EMA vs 200 SMA: by 200 bars the difference is negligible. Use either as the bull/bear regime line.
Common Mistakes
Mistake 2: Mixing SMA and EMA periods across a strategy. Pick one MA type and one period, test it, and stick with it. Switching mid-trade adds confusion, not information.
Mistake 3: Assuming the lag is constant. Sharp reversals give EMA a 3-5 bar lead. Gradual reversals give 9+ bars. Size your position accordingly.
Mistake 4: Using SMA on daily charts because "it is the standard." The standard on Indian retail daily charts is actually EMA — Kite, TradingView, Angel One all default to EMA for 20/50/200. If you are using SMA by habit, check whether you are actually better served by EMA.
Related Reading
- EMA Basics — the deep dive on Exponential Moving Averages.
- Moving Average Crossovers — how crossovers of two MAs signal trend changes.
- MAs for Trend Confirmation — stacking multiple periods for higher conviction.
- What is a Trend? — MAs only work in trending markets.
Quick Quiz: SMA vs EMA
Five questions to check your grasp. No login, no score saved — just instant feedback.
1. The core difference between a Simple Moving Average and an Exponential Moving Average is …
2. A trader wants the smoother line that lags more — useful for defining the big-picture trend on HDFC Bank daily. The better choice is …
3. Which scenario favours an EMA over an SMA?
4. During a sharp breakout on TCS, the SMA and EMA separate visibly. This happens because …
5. A common misconception about SMA vs EMA is …
| Aspect | SMA (Simple) | EMA (Exponential) |
|---|---|---|
| Calculation | Equal weight to all candles | Recent candles weighted more |
| Lag | Higher | Lower |
| Best timeframe | Daily, weekly | Hourly, intraday |
| Whipsaw risk | Lower (smoother) | Higher (reacts fast) |
| Common settings | 50, 100, 200 | 9, 20, 50 |
“The trend has changed when the slowest-moving average bends.”
— Stan Weinstein, Secrets for Profiting in Bull and Bear Markets
Is EMA always better than SMA?
No. EMA wins in trending markets because it reacts to reversals 3-9 bars faster. SMA wins in choppy markets because its smoothing reduces whipsaw losses. Match the MA type to the market state.
Why do Indian brokers default to EMA?
Because trending markets are where moving averages add the most value, and EMAs catch reversals faster. On Kite, TradingView, and Angel One, the default 20/50/200 moving averages are EMAs for this reason. Traders can switch to SMA in settings.
How many bars does EMA lead SMA?
On sharp V-shaped reversals: typically 3-5 bars. On gradual U-shaped bottoms: 7-9 bars or more. On the Reliance March 2020 Covid reversal, the lag was 5 bars and Reliance rose 9.53 percent in that window.
Should I use SMA for day trading?
Only if the intraday market is choppy. In trending intraday sessions, EMA still wins. Check your chart: if price has crossed the 20 MA less than 4 times in the last 100 bars, the market is trending and EMA is the right choice.
Is the 200 EMA different from the 200 SMA?
At 200 bars the difference is mathematically tiny. The recent-bar weight in a 200 EMA is only 1 percent, so the exponential decay has almost no visible effect versus the SMA. Use either as the long-term regime line.
Can I use both SMA and EMA together?
Yes. A common setup is 20 EMA for entry timing and 50 SMA for trend filter. The EMA catches reversals first; the SMA confirms the larger trend is intact. This combines speed with smoothness.
Does the EMA vs SMA choice matter on weekly charts?
Less than on daily charts. Weekly data already smooths intraweek noise, so the lag difference between EMA and SMA is smaller in absolute bar count but still exists. For weekly timeframes, EMA remains the marginally better choice for trend traders.
The Bottom Line
SMA and EMA are not rivals. They are tools with different personalities. The SMA is slow, steady, and smooth — a good long-term friend. The EMA is fast, reactive, and noisy — a good short-term ally. The mistake is treating them as interchangeable and using whichever happens to be on your chart by default.
The practical rule: in trending markets, use EMA at your holding period (20 for swing, 50 for position). In choppy markets, use SMA of the same period or stand aside. In steady trends, both work and you can pick on aesthetic preference.
The Reliance 2020 example is the case for EMA in one chart: 5 bars of lead time at a generational reversal, 9.53 percent of move captured versus missed. Multiply that across the many reversals your swing-trading career will see, and the EMA’s speed compounds into real returns. In choppy markets, though, the same speed turns into whipsaw losses — which is why the tool choice has to match the market state.
Watch your own charts for one week. Mark the reversals. Count the lag. Then pick the MA that matches the regime you actually trade in.
Risk Notice
Trading in equities, derivatives, and index products carries substantial risk of loss. The examples in this article are historical and do not guarantee future returns. Price data is sourced from NSE daily OHLC feeds; back-testing any strategy on your own data is essential before deploying capital. This content is educational only. It is not an investment recommendation, a tip, or a solicitation to trade any specific security. Consult a SEBI-registered advisor before acting on any information here. Size every trade at 1 percent of your total capital and never trade money you cannot afford to lose.