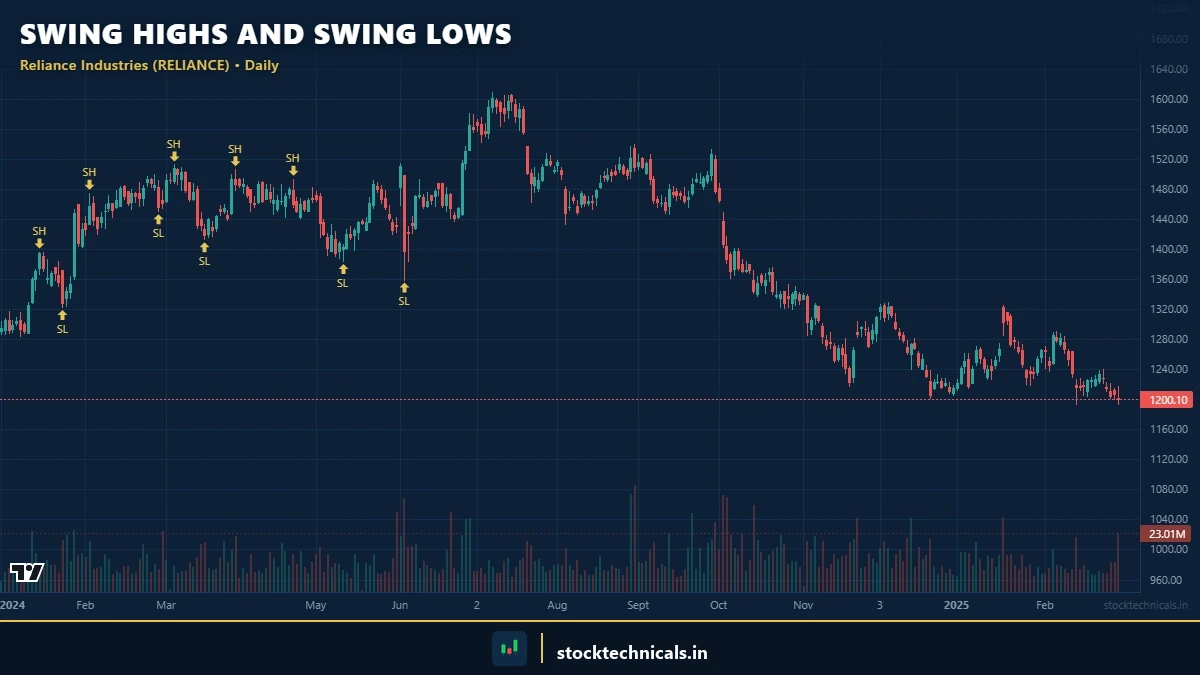
Every candlestick chart tells a story. But without knowing how to read the rhythm of peaks and valleys, that story stays hidden. SWING HIGHS and SWING LOWS are the structural anchors that make price action readable. They define trends, signal reversals, and give traders objective reference points for entries and exits.
Think of swing points like mountain peaks and valley floors on a topographic map. Once mapped, the terrain becomes navigable. Without them, a chart is just noise.
This article breaks down exactly what swing highs and swing lows are, how to identify them using two proven methods, and how their sequence builds the market structure that professional traders rely on every single day.
Quick Answer: Swing highs are temporary price peaks where a rally reverses into a decline. Swing lows are temporary troughs where a decline reverses into a rally. Together they define market structure: higher highs and higher lows confirm an uptrend, lower highs and lower lows confirm a downtrend.
Key Takeaways
- SWING HIGHS are local peaks where price made a higher high than candles on both sides. SWING LOWS are local troughs where price made a lower low than candles on both sides.
- The sequence of swing points defines MARKET STRUCTURE: Higher Highs + Higher Lows = uptrend, Lower Highs + Lower Lows = downtrend.
- A BREAK OF STRUCTURE (BOS) happens when price violates the existing swing point sequence — the earliest signal of a potential trend reversal.
- Use the 5-bar method on daily charts for structure analysis and the 3-bar method on intraday charts for timing entries.
- Always trade WITH the higher timeframe structure. Place stops beyond the most recent swing point that defines the current trend.
What Makes Swing Points the Skeleton of Every Chart

Chart data: Evergreen reference · Last reviewed April 17, 2026
Strip away every indicator, every moving average, every oscillator. What remains is price action — and at its core, price action is just a sequence of swing highs and swing lows.
Here is why swing points matter more than any indicator:
- Trend definition becomes objective. No guessing whether a stock is trending up or down. The swing point sequence tells the truth.
- Support and resistance levels are born at swing points. Every significant level traces back to a prior swing high or swing low.
- Entries and exits get logical anchors. Instead of entering trades based on feelings, traders use swing points to time positions.
- Stop loss placement becomes precise. Swing lows in uptrends and swing highs in downtrends provide natural stop loss levels.
- Trend reversals become visible before indicators catch on. A break of swing point structure often leads traditional indicators by several candles.
Professional traders on platforms like TradingView spend more time mapping swing points than looking at any indicator panel. The reason is simple: indicators are derived from price, but swing points ARE price.
What Is a Swing High

Chart data: Evergreen reference · Last reviewed April 17, 2026
A SWING HIGH is a candlestick (or bar) that has a higher high than the candles immediately before and after it. It represents a local peak where buyers ran out of momentum and sellers took temporary control.
The formal definition: A swing high forms when a candle’s high is higher than the highs of a specified number of candles on both the left and right side.
Characteristics of a Valid Swing High
- The high of the swing candle exceeds the highs of candles on both sides
- It marks a point where buying pressure peaked and selling pressure began
- Volume often spikes at swing highs, especially in distribution zones
- The candle body shape matters less than the actual high price reached
- Multiple candles can share the same high — the last one before prices drop is the swing high
What Is a Swing Low
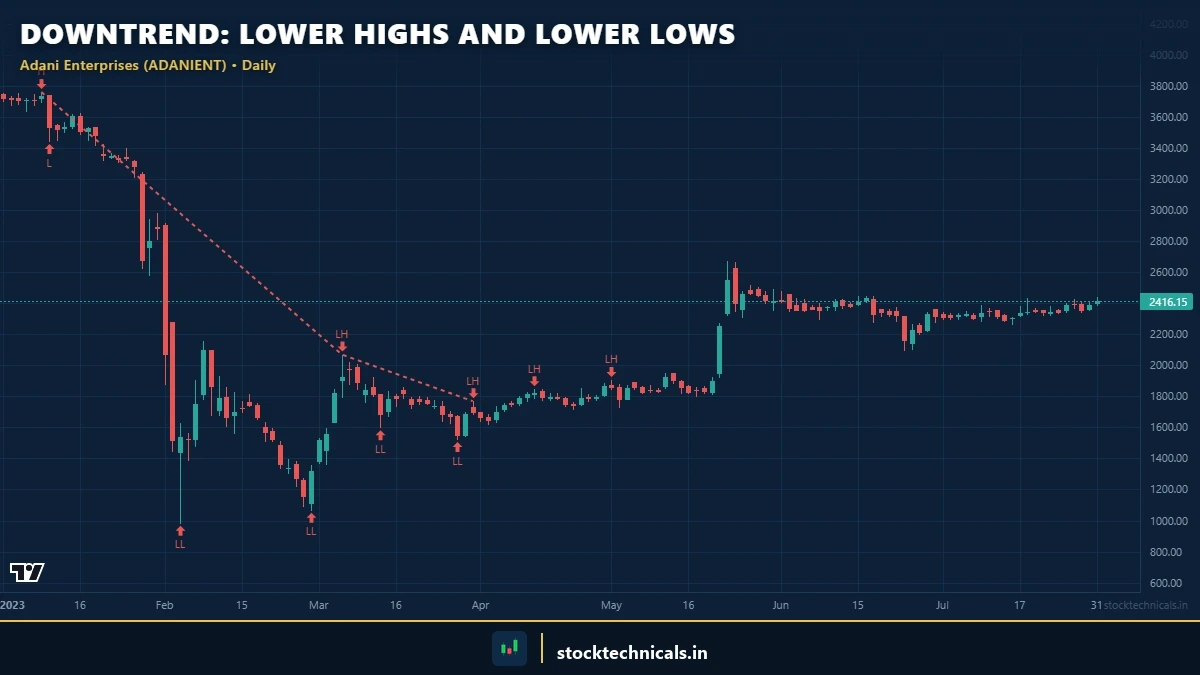
Chart data: Evergreen reference · Last reviewed April 17, 2026

Chart data refreshed on April 17, 2026 · Source: NSE (daily OHLC)
A SWING LOW is the mirror image — a candlestick with a lower low than the candles immediately before and after it. It marks a local trough where sellers ran out of ammunition and buyers stepped back in.
Characteristics of a Valid Swing Low
- The low of the swing candle is below the lows of candles on both sides
- It marks a point where selling pressure peaked and buying pressure returned
- Volume spikes at swing lows often indicate accumulation by smart money
- In supply and demand zone terms, swing lows form at demand zones
- The candle that marks the swing low often has a long lower wick, showing rejection of lower prices
| Feature | Swing High | Swing Low |
|---|---|---|
| Price position | Local peak (higher than neighbours) | Local trough (lower than neighbours) |
| Market force | Buying exhaustion | Selling exhaustion |
| What follows | Price moves down (at least temporarily) | Price moves up (at least temporarily) |
| In uptrends | Gets progressively higher (Higher Highs) | Gets progressively higher (Higher Lows) |
| In downtrends | Gets progressively lower (Lower Highs) | Gets progressively lower (Lower Lows) |
| Stop loss use | Place stop above swing high (short trades) | Place stop below swing low (long trades) |
How to Identify Swing Points on Charts

Chart data: Evergreen reference · Last reviewed April 17, 2026
Chart data refreshed on April 17, 2026 · Source: NSE (daily OHLC)
Not every minor bump on a chart qualifies as a swing point. The challenge is filtering meaningful swing points from noise. Two widely used methods solve this problem.
The Three-Bar Method
The simplest and most popular approach. A swing high requires at least one lower high on each side. A swing low requires at least one higher low on each side.
Rules for 3-bar swing high:
- Bar B has a higher high than Bar A (the bar immediately before)
- Bar B has a higher high than Bar C (the bar immediately after)
- Bar B is the swing high
The 3-bar method is sensitive. It catches many swing points, including minor ones. This makes it suitable for intraday trading on 5-minute or 15-minute charts where traders need frequent reference points.
The Five-Bar Method
A stricter filter. Requires TWO lower highs on each side for swing highs, and TWO higher lows on each side for swing lows.
Rules for 5-bar swing high:
- Bar C has a higher high than Bars A and B (two bars before)
- Bar C has a higher high than Bars D and E (two bars after)
- Bar C is the swing high
The 5-bar method filters out noise and identifies only the significant swing points. It is better suited for daily and weekly charts where traders want to see the big picture.
Which Method to Use
| Factor | 3-Bar Method | 5-Bar Method |
|---|---|---|
| Sensitivity | High (catches minor swings) | Low (only major swings) |
| Best timeframe | Intraday (5m, 15m) | Swing/Positional (Daily, Weekly) |
| Noise level | More false signals | Fewer false signals |
| Trade frequency | Higher | Lower |
| Use case | Scalping, intraday momentum | Swing trades, position trades |
Most experienced traders use the 5-bar method on daily charts for structure analysis and drop to the 3-bar method on intraday charts for timing entries within that structure.
Market Structure: Reading the Swing Point Sequence

Chart data: Evergreen reference · Last reviewed April 17, 2026
This is where swing points become truly powerful. Individual swing highs and lows are data points. The SEQUENCE of those data points defines MARKET STRUCTURE — the backbone of every trending move and every reversal.
Uptrend Structure: Higher Highs and Higher Lows
An uptrend is defined by a series of HIGHER HIGHS (HH) and HIGHER LOWS (HL). Each swing high exceeds the previous swing high. Each swing low is above the previous swing low. The market is making progress upward in a staircase pattern.
What this means for trading: In an HH/HL structure, the bias is bullish. Traders look for buying opportunities at or near Higher Lows, with stops below the most recent HL. The trend is intact as long as the pattern of HH/HL continues.
Downtrend Structure: Lower Highs and Lower Lows
A downtrend is defined by a series of LOWER HIGHS (LH) and LOWER LOWS (LL). Each swing high fails to reach the level of the previous swing high. Each swing low breaks below the previous swing low.
In an LH/LL structure, the bias is bearish. Short sellers look for entries near Lower Highs, with stops above the most recent LH. The downtrend remains valid as long as LH/LL continues.
Structure Break (BOS): When Trends Reverse
A BREAK OF STRUCTURE (BOS) happens when the market violates its existing swing point sequence. This is arguably the single most important signal in price action trading.
Bullish BOS (downtrend to uptrend): Market has been making LH/LL. Price rallies and breaks above the most recent Lower High. The LH/LL sequence is broken. New potential uptrend begins if followed by a Higher Low.
Bearish BOS (uptrend to downtrend): Market has been making HH/HL. Price drops and breaks below the most recent Higher Low. The HH/HL sequence is broken. New potential downtrend begins if followed by a Lower High.
A BOS is not a guarantee of reversal. Sometimes the market fakes a structure break and resumes the prior trend — a false breakout. Confirmation matters. Wait for the first pullback after BOS to form a new swing point that confirms the new direction.
Trading with Market Structure

Chart data: Evergreen reference · Last reviewed April 17, 2026
Chart data refreshed on April 17, 2026 · Source: NSE (daily OHLC)
Understanding market structure is one thing. Trading it profitably requires rules.
The Structure-Based Entry Method
- Identify the current market structure on the higher timeframe (daily chart)
- Determine the bias: HH/HL = bullish bias, LH/LL = bearish bias
- Wait for a pullback to the most recent swing point level
- Enter in the direction of the structure on the lower timeframe (15-minute or hourly)
- Place stop loss beyond the swing point used for entry
- Target the next swing point in the direction of the trend
Stop Loss Placement Using Swing Points
Swing points provide the most logical stop loss levels because they represent the boundary of the current structure:
- Long trades: Stop below the most recent swing low (the Higher Low that defines the uptrend)
- Short trades: Stop above the most recent swing high (the Lower High that defines the downtrend)
- Add a small buffer (0.2-0.5% beyond the swing point) to avoid premature stop-outs on wicks
If the stop is hit, it means the market structure has changed — the trade thesis is invalidated, and exiting is the correct action.
Multi-Timeframe Swing Analysis
Single-timeframe analysis is incomplete. The same stock can show an uptrend on the daily chart and a downtrend on the 15-minute chart. Multi-timeframe swing analysis resolves this conflict.
The Three-Screen Method for Swing Points
- Screen 1 (Weekly): Identify the major trend structure (HH/HL or LH/LL). This sets the directional bias.
- Screen 2 (Daily): Map intermediate swing points within the weekly structure. These define tradeable support and resistance zones.
- Screen 3 (Hourly/15-min): Find entry-level swing points for precise timing. Enter only in the direction confirmed by Screens 1 and 2.
The best trades happen when weekly, daily, and intraday swing structures all align in the same direction. These high-confluence setups are rare but extremely reliable.
Combining Swing Points with Support, Resistance, and Volume
Swing points become even more powerful when confirmed by other price action tools.
Swing Points as Dynamic Support and Resistance
Every swing high is a potential resistance level. Every swing low is a potential support level. When a prior swing high is broken and price pulls back to that level, it often acts as support — the classic role reversal concept.
Volume Confirmation at Swing Points
- Swing highs with high volume: Strong distribution. Sellers are active. The swing high is likely significant.
- Swing highs with low volume: Weak peak. May be retested and broken later.
- Swing lows with high volume: Strong accumulation. Buyers are active. The swing low is likely to hold.
- Swing lows with low volume: Weak trough. May break down on the next test.
Common Mistakes When Reading Swing Points
Marking Too Many Swing Points
Every minor wiggle is not a swing point. Over-marking creates confusion and generates false structure reads. Solution: Stick to one method (3-bar or 5-bar) consistently. Use the 5-bar method on daily charts to filter noise.
Ignoring the Higher Timeframe
A swing low on the 5-minute chart is meaningless if the daily chart shows a bearish BOS. Always check the higher timeframe structure before trading lower timeframe swing points.
Trading Against Structure
The most expensive mistake. If the daily structure shows LH/LL, buying every swing low on the 15-minute chart is fighting the current. Trade WITH the structure of the higher timeframe, not against it.
Expecting Exact Levels
Swing points are zones, not exact prices. A swing low at ₹1,850 does not mean price will bounce exactly at ₹1,850 on the next visit. It may reverse at ₹1,842 or ₹1,860. Use zones, not lines.
Platform Guide: Marking Swing Points
On TradingView
Open TradingView, load any NSE stock on the daily chart, and use the horizontal line tool to mark each swing high and swing low. Color-code them: green for swing lows, red for swing highs. Label each as HH, HL, LH, or LL.
TradingView also has built-in indicators like “Pivot Points High Low” that automatically detect swing points using configurable lookback periods. Search for it in the Indicators menu.
Practice Routine
- Open a daily chart of Nifty 50 or any liquid stock
- Start from the left side of the chart
- Mark every swing high with a red horizontal line at the high price
- Mark every swing low with a green horizontal line at the low price
- Label the sequence: HH, HL, LH, LL
- Identify every BOS point where the structure shifted
- Repeat on 3 different stocks daily for two weeks
Quick Reference: Five Rules for Swing Point Trading
- Structure first, trade second. Always identify the market structure on the higher timeframe before looking for entries on the lower timeframe.
- Trade with the structure, never against it. If daily structure shows HH/HL, only look for long entries. If it shows LH/LL, only look for short entries.
- Confirm with volume. A swing point without volume confirmation is weak. The strongest swing points form with volume spikes.
- Place stops beyond the swing point. Long stops go below the most recent swing low. Short stops go above the most recent swing high. If the stop is hit, the structure has changed — exit without hesitation.
- Wait for BOS confirmation before switching bias. One failed swing point does not make a trend reversal. Wait for a confirmed Break of Structure AND a pullback that forms a new swing point in the new direction.
The The Bottom Line Most traders lose money because they trade against the structure. They see a stock falling and think “it must bounce here.” It does not — because the structure says Lower Highs and Lower Lows. Read the structure. Trade the structure. Everything else is gambling.
Keep the capital alive. The market is open tomorrow.
Real Talk: No chart pattern, indicator, or strategy works 100% of the time. The SEBI study showing 93% of F&O traders lose money is not a scare tactic — it is a filter. Most of that 93% traded without a stop-loss, sized positions too large, or chased signals without understanding context. Risk no more than 1-2% of capital per trade. Keep a trading journal. The market rewards patience and discipline — not speed or boldness.
What is a swing high in trading?
A swing high is a candlestick whose high price exceeds the highs of candles on both its left and right side. It marks a local peak where buying pressure temporarily exhausted and price began to decline. Swing highs serve as potential resistance levels and are used to map market structure.
What is the difference between a swing high and a swing low?
A swing high is a local peak (higher high than neighbouring candles), while a swing low is a local trough (lower low than neighbouring candles). Swing highs mark points of buying exhaustion, while swing lows mark points of selling exhaustion. Together, their sequence defines whether a market is in an uptrend, downtrend, or range.
What does HH/HL mean in trading?
HH stands for Higher High and HL stands for Higher Low. When a chart shows a series of Higher Highs and Higher Lows, it indicates an uptrend. Each peak exceeds the previous peak, and each trough is above the previous trough, forming a staircase pattern moving upward.
What is a Break of Structure (BOS)?
A Break of Structure occurs when price violates the existing swing point sequence. In a bullish BOS, price breaks above the most recent Lower High during a downtrend. In a bearish BOS, price breaks below the most recent Higher Low during an uptrend. BOS is the earliest signal of a potential trend reversal.
Should I use the 3-bar or 5-bar method for identifying swing points?
Use the 5-bar method on daily and weekly charts for structure analysis as it filters noise and shows only significant swing points. Use the 3-bar method on intraday charts (5-minute, 15-minute) for timing entries within the structure identified on higher timeframes.
OrsLeo — Six blown accounts. Started with NTPC IPO in 2004, then a stock market website in 2007, made ₹50,000 in a single day on futures in 2017, and lost it all in the same day. A lot of hard-earned lessons between then and now.
I started StockTechnicals.in to be the resource I wish existed when I was figuring this out. Everything here — from indicators to strategies — is built on one principle: capital protection first. I don't share theories; I share actionable setups that traders can apply on Monday morning.
Risk management shows up at the start and end of every article on this site, because if a trader can't stay in the game, they can't win it.
Test What Traders Have Learned
Q1: What defines a swing high using the 3-bar method?
Q2: In an uptrend, what pattern do swing points form?
Q3: What is a Break of Structure (BOS)?
Q4: Where should a long trade stop loss be placed?
Q5: Which swing point method is better for daily chart structure analysis?
Test Your Knowledge
1. What defines a SWING HIGH?
2. In an uptrend, what pattern do swing points form?
3. What does a BREAK OF STRUCTURE (BOS) signal?
4. How do traders use swing lows in an uptrend?
5. Higher highs but EQUAL lows suggest:
What qualifies as a swing high or swing low?
A SWING HIGH forms when a candle’s high is higher than the highs of the candles on both sides of it — price rises to a peak and then falls back. A SWING LOW forms when a candle’s low is lower than the lows of the candles on both sides — price drops to a trough and then bounces. These pivot points map the market’s structure.
How many bars are needed to confirm a swing point?
The standard definition requires at least one bar on each side (a 3-bar pattern), but many traders use a 5-bar lookback — two bars on each side of the pivot candle — for more reliable swing points. Higher bar counts filter out minor fluctuations but may delay the signal. The choice depends on the timeframe and trading style.
What does a break of structure (BOS) mean?
A BREAK OF STRUCTURE occurs when price moves beyond a prior swing point in the direction of the trend. In an uptrend, BOS happens when price breaks above the most recent swing high. In a downtrend, BOS occurs when price breaks below the most recent swing low. Each BOS confirms that the current trend remains intact.
Can swing highs and lows be used on intraday charts?
Yes, swing highs and lows work on every timeframe from 1-minute charts to monthly charts. Intraday traders commonly identify swing points on 5-minute and 15-minute charts to map short-term structure. However, swing points from higher timeframes (daily, weekly) carry more significance and often act as stronger support and resistance levels.
How do swing points relate to trend identification?
Swing points are the foundation of trend identification. An UPTREND is defined by a series of higher swing highs and higher swing lows. A DOWNTREND shows lower swing highs and lower swing lows. When this pattern breaks — for example, an uptrend making a lower low — it signals a potential trend change or reversal.
No setup works without a stop-loss.
Protect your capital. Everything else follows.
Swing Structure as a Trend Diagnostic
Swing points are the vocabulary of market structure, and market structure is the single most important input to trend direction. Forget moving averages, MACD, ADX — all of them are derivatives. The raw signal is the sequence of swing highs and swing lows on the chart.
Uptrend structure: higher swing highs AND higher swing lows, unbroken. One broken lower low ends the uptrend. Strict definition — do not soften it.
Downtrend structure: lower swing highs AND lower swing lows. One broken higher high ends the downtrend.
Range: alternating swing highs and swing lows at roughly equal levels. The range is intact until one side breaks decisively.
Transition: the moment structure shifts. Example: in an uptrend, price prints a lower high (first warning) but holds the prior swing low. Structure is now ‘uncertain’ — possibly topping, possibly just pausing. If the next bar breaks the prior swing low, trend has flipped to downtrend. If the next swing high exceeds the prior swing high, the uptrend resumes.
Practical application: before every trade, identify the current structure on the daily chart. Long trades only in confirmed uptrends or at confirmed range lows. Short trades only in confirmed downtrends or at confirmed range highs. ‘Uncertain’ structure = no trade.
Swing-Based Stop Placement
One of the best uses of swing points is stop placement. A well-placed stop has two qualities: (1) it’s beyond a clear invalidation level, so a stop-out means your setup is actually wrong, and (2) it’s tight enough that risk-reward stays favourable.
For long trades: stop just below the most recent daily swing low. If that swing low breaks, the uptrend structure is violated — your trade thesis is invalid. Example: if you’re long Reliance (NSE: RELIANCE) at ₹1,280 and the most recent swing low is ₹1,260, your stop is ₹1,255-1,258 (just below the swing low). Not ₹1,245 (random percentage), not ₹1,265 (inside the swing — too tight).
For short trades: stop just above the most recent daily swing high. Same logic in reverse.
For range trades: stop beyond the range boundary you’re trading from. Long at range low = stop below range low. Short at range high = stop above range high.
Why swing-based stops beat percentage-based stops: swings are objective — either the level is broken or it isn’t. Percentages are arbitrary — stopping out 2% below entry has no relationship to whether your setup is invalid. You’ll routinely get stopped out on stops that had ‘no reason to break’ by percentage logic but made perfect structural sense for the market.
One refinement: for volatile stocks (ATR more than 2% of price), add a 0.5-1% buffer beyond the swing point. For stable stocks (ATR less than 1% of price), 0.2-0.3% buffer is enough. The buffer absorbs fake wicks without widening the stop so much that risk-reward breaks.
The Bottom Line on Swing Highs and Lows
Swing points are the vocabulary of market structure. If you can identify swing highs and swing lows correctly on any chart, you can determine trend — and if you know the trend, you know which direction to trade. That’s 80% of the technical analysis job done with one rule.
Most traders fail at this because they use intraday wicks or single-bar spikes as ‘swing points’. The rule is 3 bars on each side — minimum. Anything less is noise. On Nifty daily, the real swing highs happen 3-4 times a month, not 3-4 times a day.
The broken swing low / swing high is the most actionable signal in the market. When Reliance broke its ₹1,200 swing low on a closing basis in September 2023 (after testing the level intraday in August), the uptrend that had been intact since November 2022 was done — and the stock proceeded to drop ₹50+ over the next six weeks. No indicator would have told you that earlier than the structure break did.
Continue Learning
- For basics: What is a Trend and Dow Theory
- For execution: Support and Resistance and Price Action Trading
- For advanced structure: What is a Breakout and What is a Pullback
Markets are brutal, capital is finite, and no single trade should risk more than 2 percent of the account.
Trading against swing-point structure is betting against the market’s primary direction. If you’re long and the most recent swing low breaks, exit — don’t rationalise. The structure told you the trend is done; your P&L account will confirm it if you ignore the signal.