
Every profitable trader you have ever studied — from Jesse Livermore to Rakesh Jhunjhunwala — followed one principle before anything else: identify the trend and trade with it. Between June 2023 and September 2024, the Nifty 50 (NSE: NIFTY 50) climbed from 18,487.80 to 26,277.35 — a 42 percent gain in sixteen months. Traders who correctly identified that uptrend early had the market working in their favour on every trade. Traders who fought the trend spent those same sixteen months bleeding capital.
Quick Answer: A trend is the direction of price over time, defined by the sequence of swing highs and swing lows. An uptrend prints higher highs and higher lows, a downtrend prints lower highs and lower lows, and a sideways market prints neither. Identifying the trend before placing any trade is the single most important step in technical analysis — on NSE stocks like Reliance, Nifty 50, or Bank Nifty, the trader who trades with the trend has the market working for them, not against them.
This guide teaches you how to identify all three types of market trends — uptrend, downtrend, and sideways — using real price data from stocks listed on the NSE. You will learn the exact rules that define each trend, how to spot swing points, how to confirm trends with volume and moving averages, and how to recognise when a trend is about to change. Every chart in this article uses NSE data so you can cross-check the numbers yourself.
Key Takeaways
- Trends are the foundation of all technical analysis: an uptrend makes higher highs and higher lows, a downtrend makes lower highs and lower lows, and a sideways market trades within a horizontal range
- Swing highs and swing lows are the building blocks: every trend is a sequence of these turning points, and tracking them tells you the trend direction without any indicator
- Volume confirms what price suggests: healthy trends show expanding volume on moves in the trend direction and contracting volume on pullbacks
- Multi-timeframe alignment increases probability: when the weekly, daily, and intraday charts agree on direction, the setup is strongest
- Trends end with structural breaks, not predictions: wait for the pattern of highs and lows to actually change before assuming a reversal
What is a Trend?
A trend is the general direction in which a stock’s price is moving over a period of time. It is the single most important concept in technical analysis because it answers the first question every trader must ask before placing an order: is this stock going up, going down, or going nowhere?
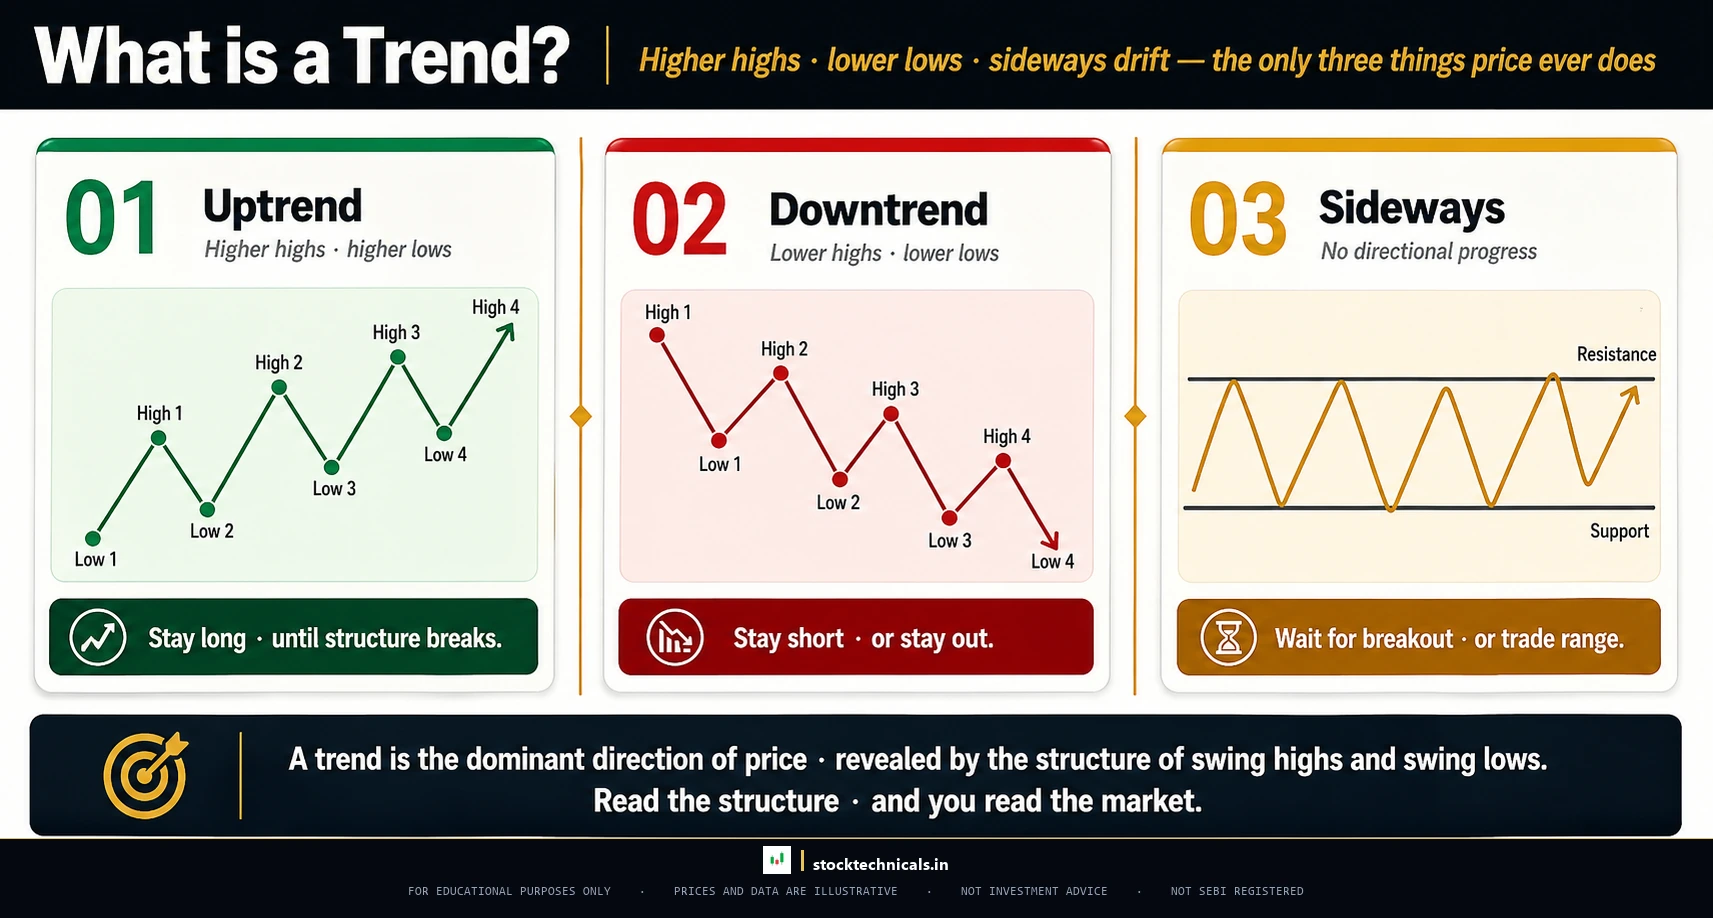
Markets do not move in straight lines. Prices zigzag — they advance, pull back, advance again, pull back again. A trend exists when those zigzags create a pattern of progressively higher peaks and higher troughs (uptrend) or progressively lower peaks and lower troughs (downtrend). When there is no such progression — when peaks and troughs stay roughly at the same level — the market is sideways.
Understanding trends matters because trading with the trend gives you a statistical edge. When you buy in a confirmed uptrend, the broad momentum of the market is pushing your position higher. When you short or avoid a stock in a confirmed downtrend, you stay out of the path of selling pressure. Fighting the trend is the single most expensive mistake a trader can make.
Charles Dow, the father of technical analysis and founder of the Wall Street Journal, established this principle over a century ago in what is now called Dow Theory: markets move in trends, and those trends persist until something changes them. Every modern trading strategy — whether based on moving averages, chart patterns, or price action — is built on this foundation.
Three Types of Trends Every Trader Must Recognize
Every market condition falls into one of three categories. Recognising which one you are in determines everything — your strategy, your position size, even whether you should trade at all.
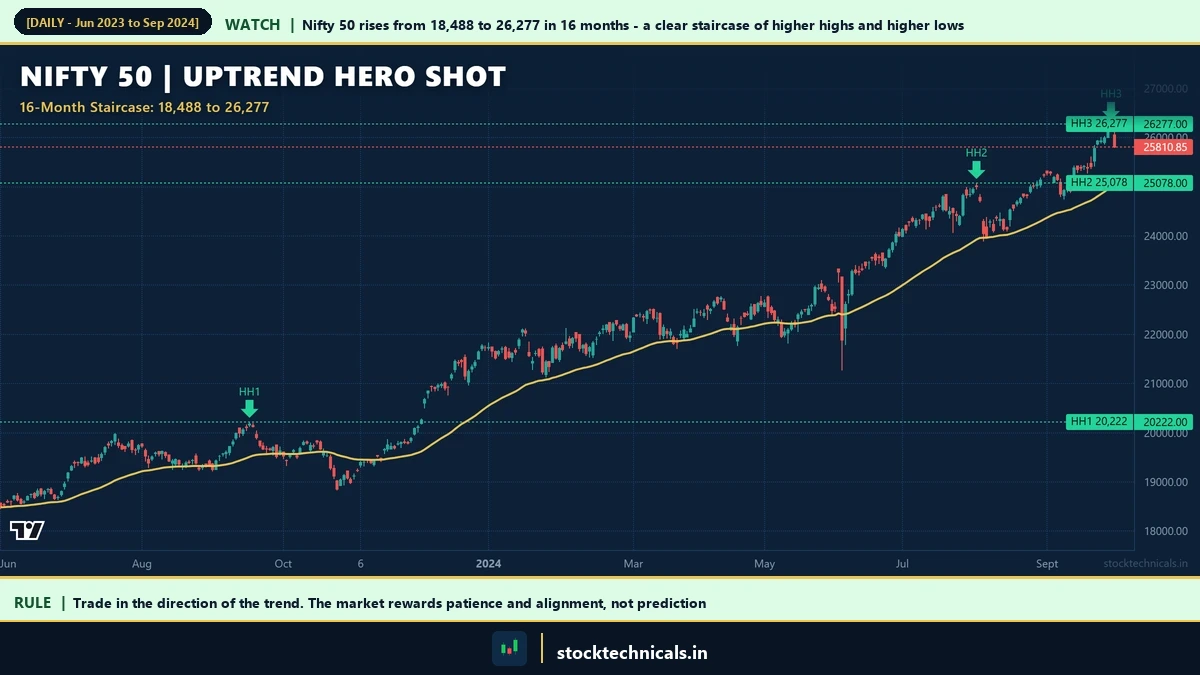
Chart data: Evergreen reference · Source: StockTechnicals.in
| Characteristic | Uptrend | Downtrend | Sideways |
|---|---|---|---|
| Price pattern | Higher highs, higher lows | Lower highs, lower lows | Flat highs, flat lows |
| Trader action | Buy on pullbacks | Sell on rallies or stay out | Range trade or wait |
| Volume behaviour | Expands on advances | Expands on declines | Generally lower |
| Moving averages | Price above 20/50 EMA | Price below 20/50 EMA | Price whipsaws around EMAs |
| Typical duration | Weeks to months | Weeks to months | Days to weeks (before resolution) |
| Emotional state | Optimism, greed | Fear, panic | Indecision, boredom |
The hardest part is not understanding these three categories — it is accepting which one the market is actually in. Traders who want the market to trend will see trends in sideways action. Traders who are scared will see reversals in every pullback. The rules below remove that subjectivity.
How to Identify an Uptrend: Higher Highs and Higher Lows
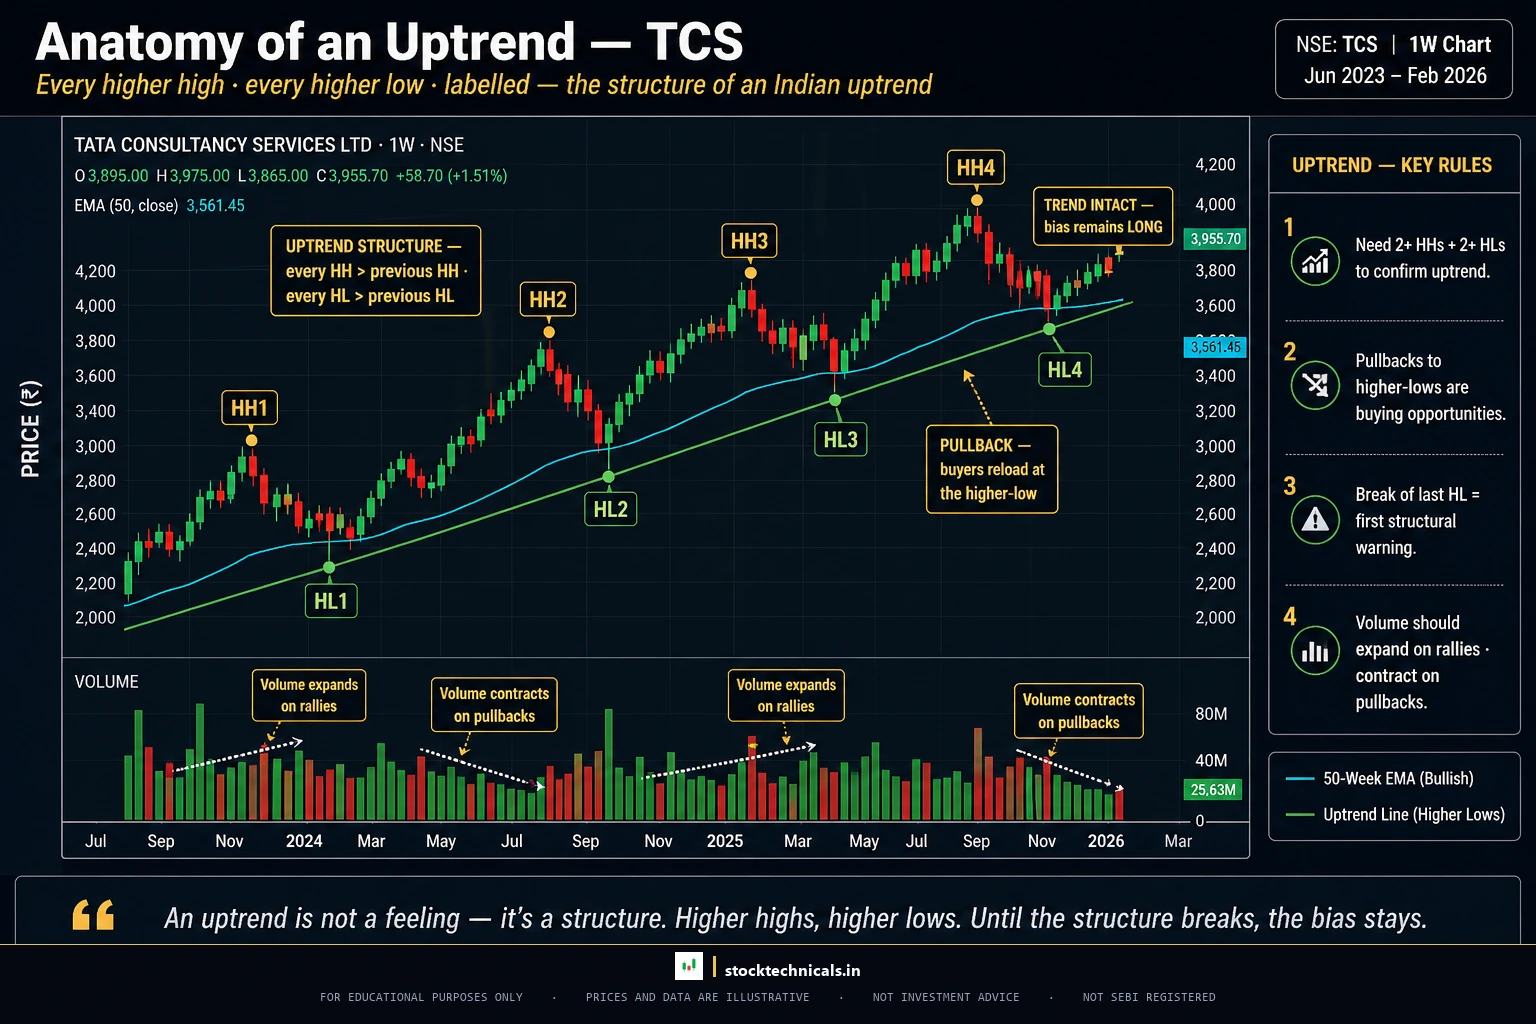
An uptrend has one defining rule: each successive peak (swing high) is higher than the previous peak, and each successive trough (swing low) is higher than the previous trough.
Example: Reliance Industries between February and April 2022:
- HH1: February 18, 2022 — Reliance hit a high of ₹1,228.20
- HL1: March 8, 2022 — pulled back to a low of ₹1,090.00 (a correction, but the starting point of the staircase)
- HH2: March 30, 2022 — rallied to a new high of ₹1,344.00 (higher than HH1 at 1,228.20)
- HL2: April 18, 2022 — pulled back to ₹1,260.90 (higher than HL1 at 1,090.00)
- HH3: April 29, 2022 — reached ₹1,428.08 (higher than HH2 at 1,344.00)
Each high was higher than the previous high. Each low was higher than the previous low. That is a textbook uptrend.
Notice what happened at HL2 (₹1,260.90): the pullback was shallow compared to HL1. This is typical of healthy uptrends — each correction gets smaller as buying pressure builds. The 20-day EMA at that point was ₹1,280.56, acting as dynamic support.
What to do in an uptrend: Look for buying opportunities on pullbacks to support levels — trendlines, moving averages, or previous swing lows. Do not short. Do not try to predict the top.
How to Identify a Downtrend: Lower Highs and Lower Lows
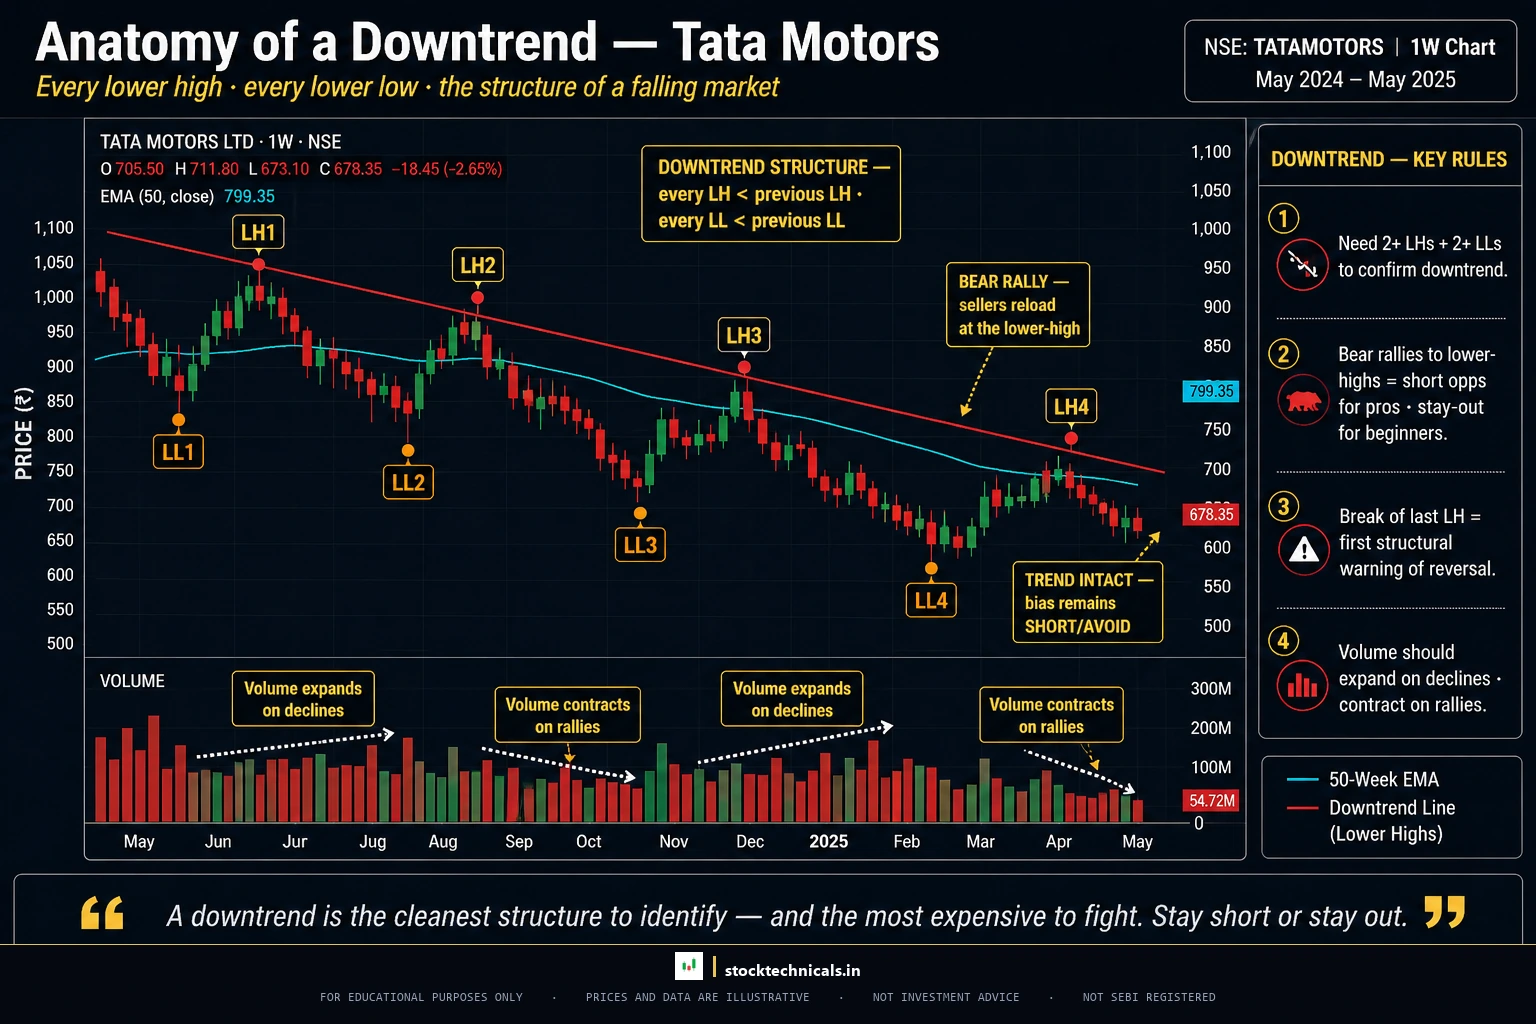
A downtrend is the mirror image: each rally peak is lower than the previous peak, and each decline reaches a new low.
Example: Yes Bank between January and October 2019 — one of the most devastating downtrends in market history:
- LH1: January 25, 2019 — Yes Bank rallied to ₹245.00
- LL1: February 13, 2019 — fell to ₹168.10
- LH2 (dead cat bounce): April 3, 2019 — rallied all the way to ₹286.00, temporarily above LH1 — this trapped buyers who thought the worst was over
- LL2: May 17, 2019 — crashed to ₹132.45 (below LL1)
- LH3: May 31, 2019 — only managed to bounce to ₹157.00 (far below LH2)
- LL3: July 18, 2019 — new low at ₹79.15
- LH4: September 11, 2019 — barely recovered to ₹75.45
- LL4: October 1, 2019 — collapsed to ₹29.00
From LH2 onward, every rally peak was lower: ₹286.00 then ₹157.00 then ₹75.45. Every low was lower: ₹168.10 then ₹132.45 then ₹79.15 then ₹29.00. The 20-day EMA stayed above the price from May 2019 onward, confirming that every bounce was a selling opportunity, not a buying one.
The LH2 dead cat bounce to ₹286.00 is a critical lesson: a single higher high does not change the trend. You need the pattern of lower highs AND lower lows to break before concluding that a downtrend has ended.
What to do in a downtrend: Stay out. Do not try to catch the bottom. If you trade derivatives, sell on rallies. Wait for the trend structure to break (a higher high followed by a higher low) before considering any long position.
Sideways Markets: When There Is No Trend
When prices trade within a horizontal range — bouncing between a support floor and a resistance ceiling — the market is sideways. There is no net directional progress.
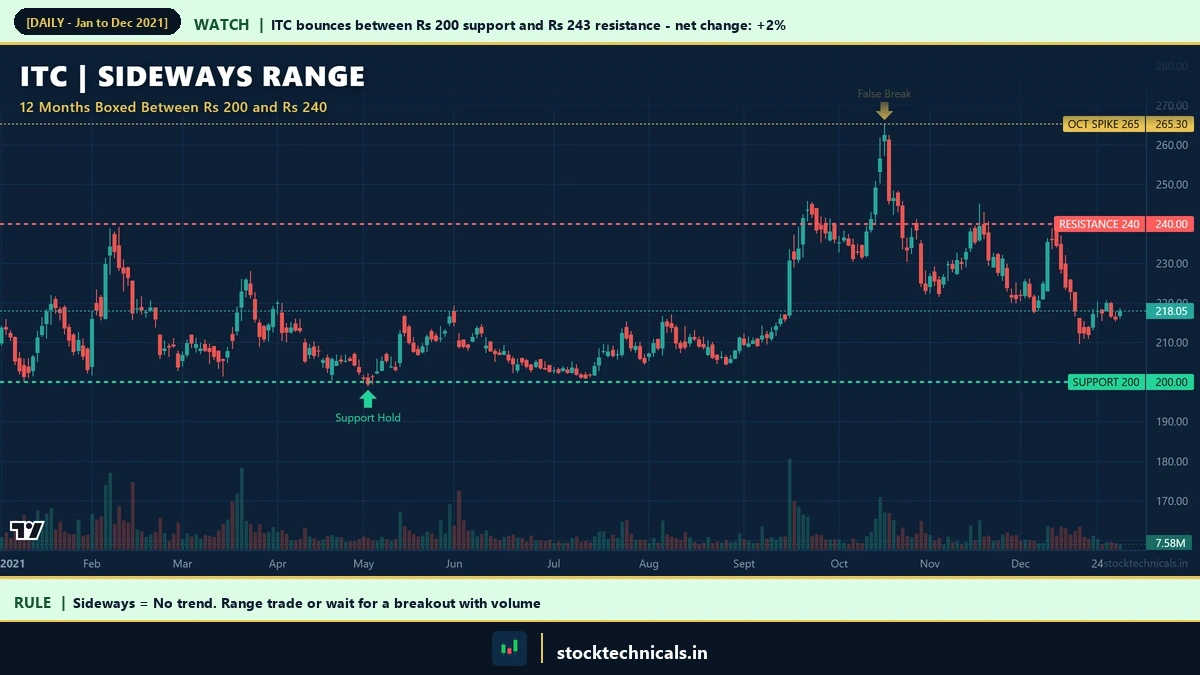
Example: ITC throughout 2021 — the textbook “dead money” stock:
- Support zone: ₹200 to ₹205 (touched 13 or more times during the year)
- Resistance zone: ₹240 to ₹243 (touched 7 or more times)
- Start: January 1, 2021 at ₹213.85
- End: December 31, 2021 at ₹218.05
- Net change: +2.0 percent in an entire year
Every time ITC approached ₹200-205, buyers stepped in. Every time it approached ₹240-243, sellers emerged. The result was twelve months of sideways chop that frustrated trend-followers and rewarded only range traders.
On October 18, 2021, ITC spiked to ₹265.30 — apparently breaking above resistance. But the breakout failed within days, and prices fell back into the range. This is a classic false breakout (also called a bull trap) and illustrates why sideways markets are dangerous for breakout traders.
What to do in sideways markets: Either trade the range (buy near support, sell near resistance with tight stops) or wait for a genuine breakout with volume confirmation. Most trend-following strategies underperform in sideways conditions.
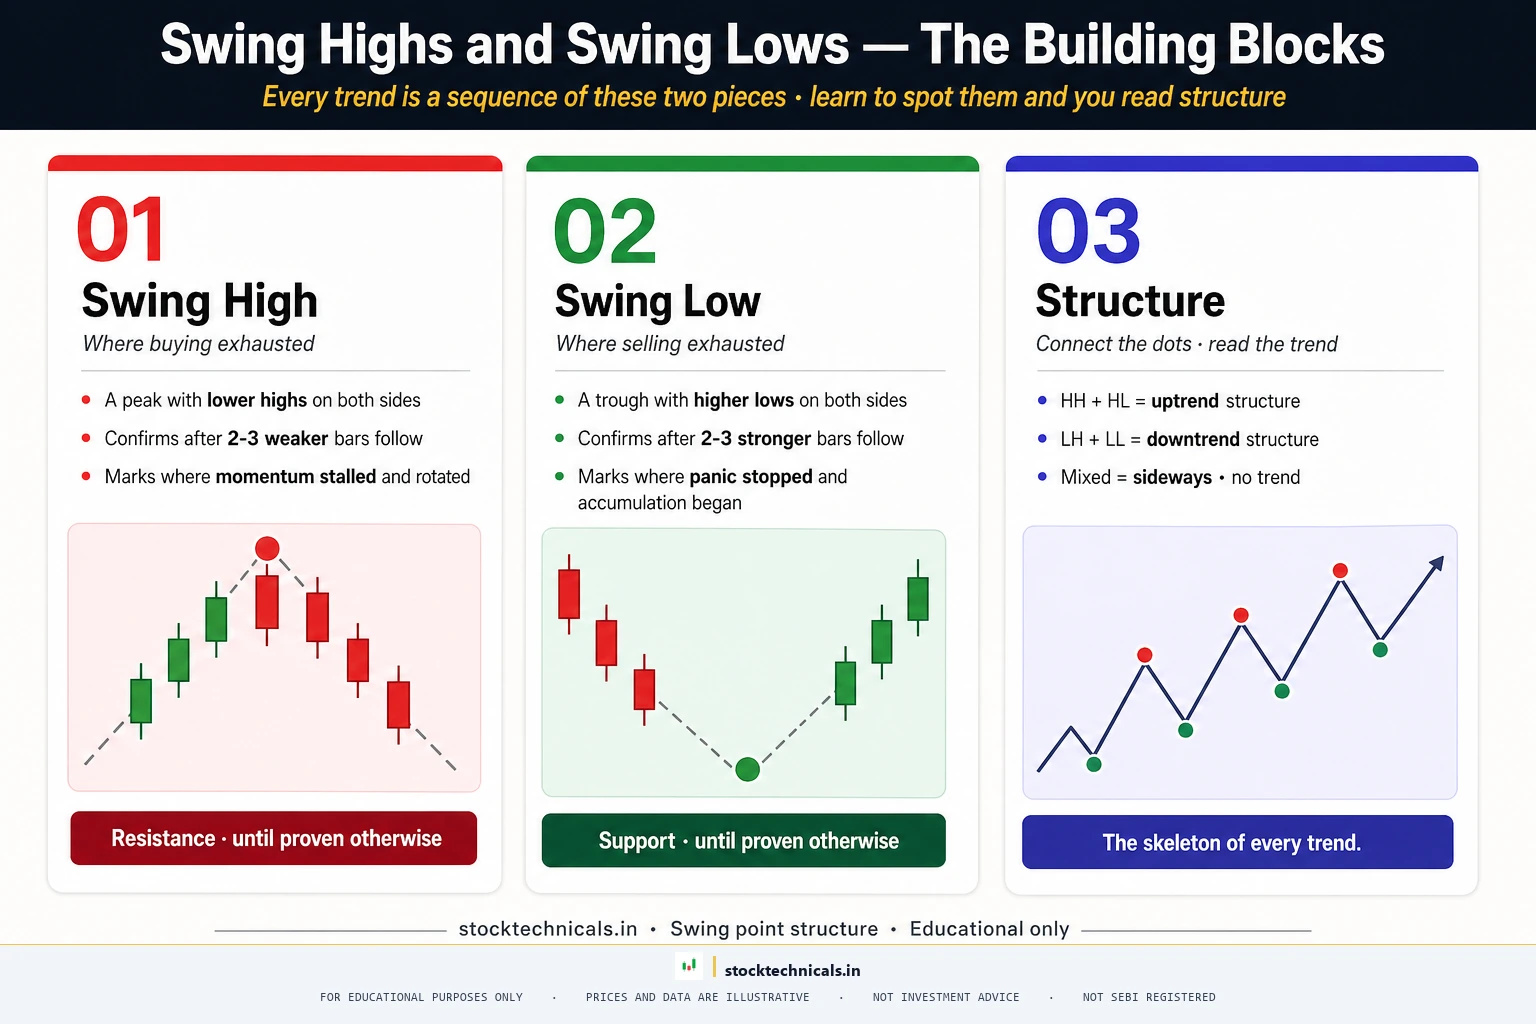
Swing Highs and Swing Lows: The Building Blocks of Every Trend
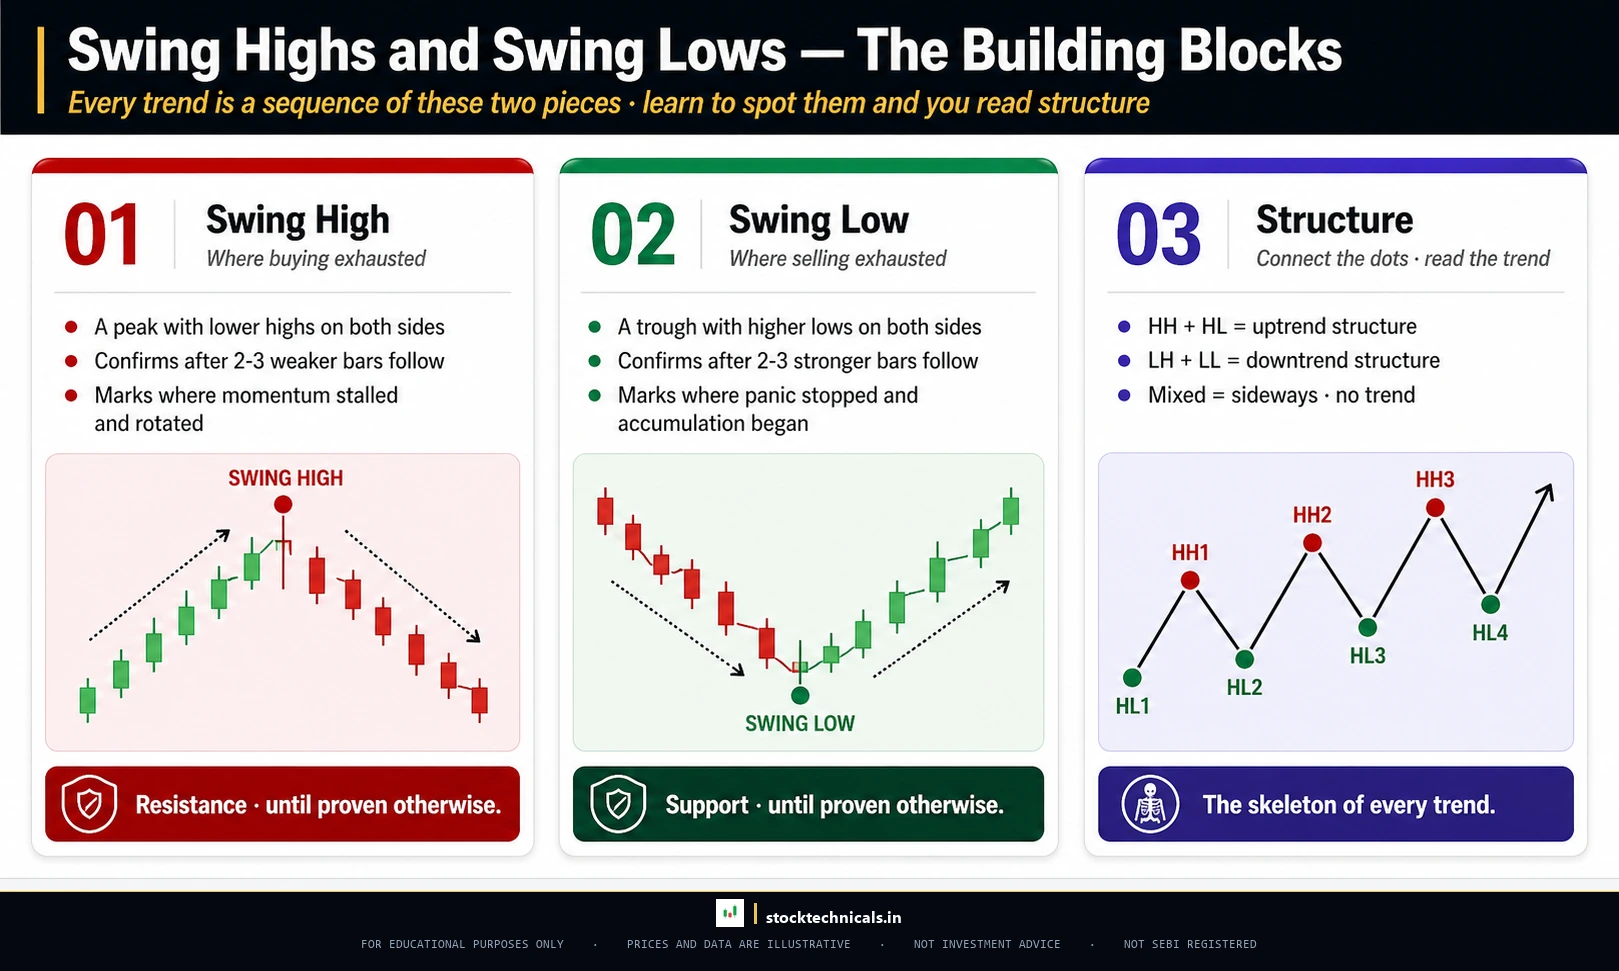
Before you can identify any trend, you need to identify swing points. A swing high is a peak where the price reversed downward after rising. A swing low is a trough where the price reversed upward after falling. These turning points are the skeleton of every trend.
Example: HDFC Bank between January and September 2024 showed a clear swing point sequence:
- Swing Low 1: January 24, 2024 at ₹690.13
- Swing Low 2: February 14, 2024 at ₹681.78 (double bottom formation)
- Swing High 1: March 13, 2024 at ₹735.80
- Swing Low 3: March 27, 2024 at ₹710.63 (higher than SL2 at 681.78)
- Swing High 2: April 22, 2024 at ₹778.70 (higher than SH1 at 735.80)
- Swing Low 4: May 10, 2024 at ₹713.40 (higher than SL3)
- Swing High 3: July 3, 2024 at ₹897.00 (much higher than SH2)
- Swing Low 5: July 24, 2024 at ₹794.03 (higher than SL4)
- Swing High 4: August 12, 2024 at ₹837.98
Starting from the double bottom at ₹681-690, each successive swing low was higher (681.78 then 710.63 then 713.40 then 794.03) and each successive swing high was higher (735.80 then 778.70 then 897.00). This is how an uptrend emerges from a base.
Practical rule: Mark swing points on your chart as you trade. When the latest swing low is higher than the previous swing low AND the latest swing high is higher than the previous swing high, you have an uptrend. When the opposite occurs, you have a downtrend.
You do not need any indicator to identify swing points. They are visible on any candlestick chart. Open your TradingView chart (free plan available), switch to the daily timeframe, and practice identifying the most recent 5-10 swing points on any Nifty 50 stock.
Drawing Trendlines: Connecting Swing Points
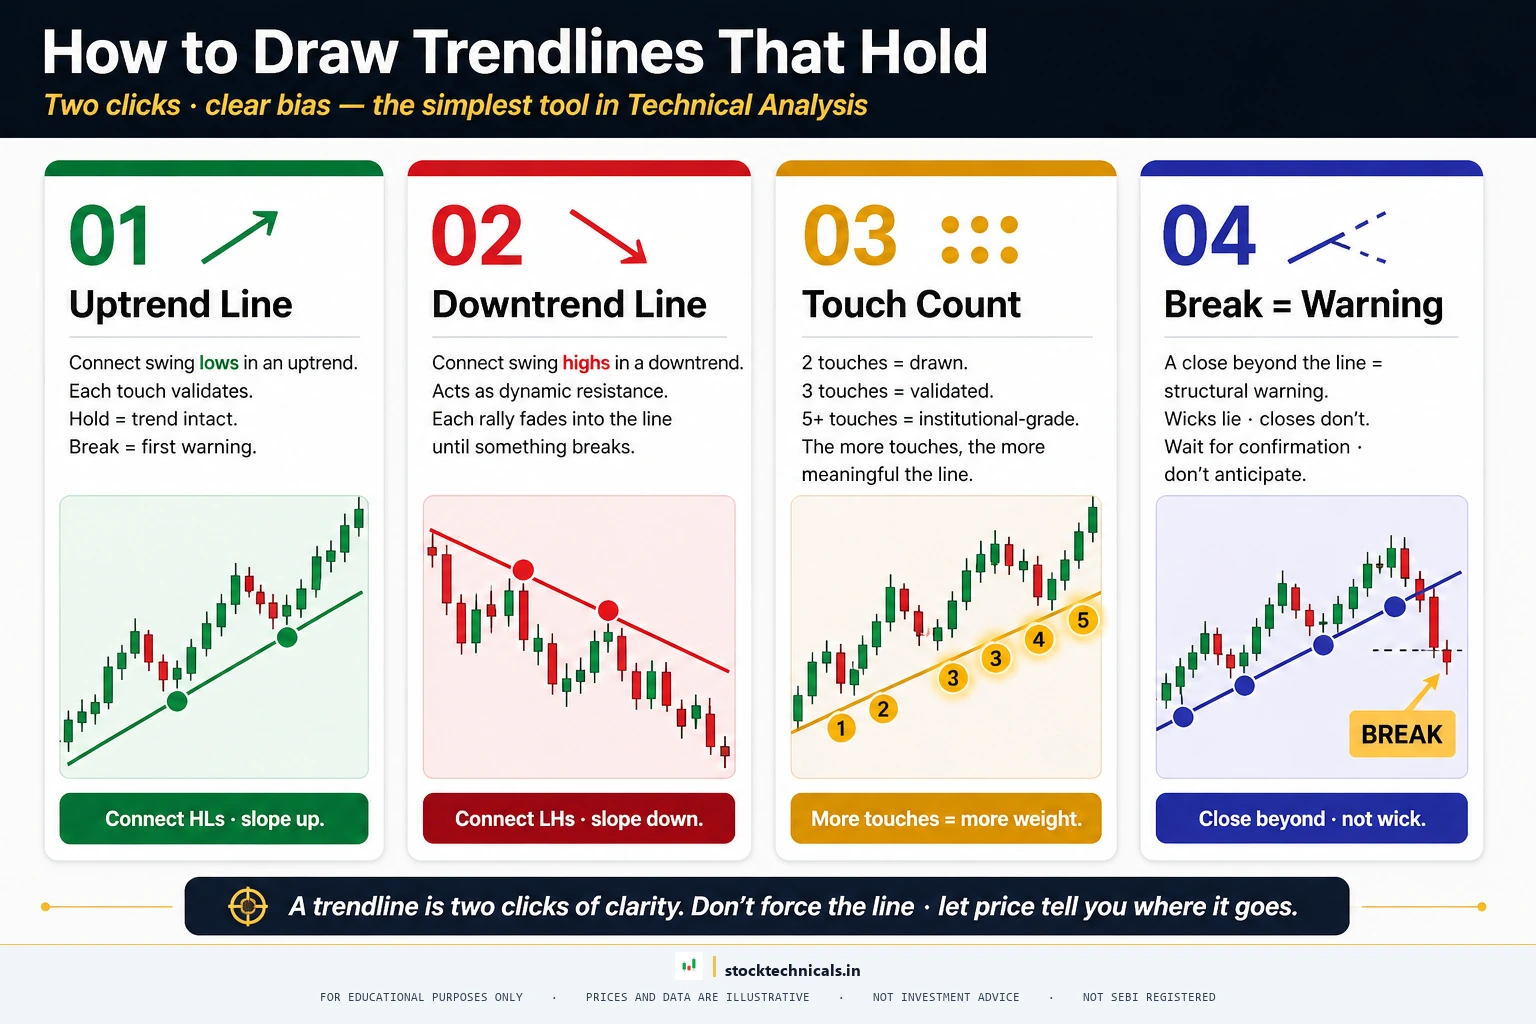
A trendline is a straight line that connects two or more swing points. In an uptrend, you draw the trendline along the swing lows (the support line). In a downtrend, you draw it along the swing highs (the resistance line).
Rules for valid trendlines:
- A trendline needs at least two touches to be drawn, but three touches make it significantly more reliable
- The more times price respects a trendline without breaking it, the more significant that line becomes
- Trendlines drawn on higher timeframes (weekly, daily) carry more weight than those on lower timeframes (hourly, 15-minute)
- When price breaks a trendline with conviction (closes below it in an uptrend, or above it in a downtrend), it signals a potential trend change
Common trendline mistake: Drawing trendlines through candle bodies instead of connecting the wicks (the absolute highs and lows). Always use the wicks — they represent the actual price extremes where supply or demand stepped in.
For a detailed guide on constructing and using trendlines, see the trendlines guide.
Trend Duration and Multi-Timeframe Analysis
Not all trends are equal. Dow Theory classifies trends by duration:
- Primary trend: Lasts months to years. This is the major market direction (bull market or bear market)
- Secondary trend: Lasts weeks to months. These are counter-trend corrections within the primary trend — pullbacks in an uptrend or bear market rallies in a downtrend
- Minor trend: Lasts days to weeks. Short-term fluctuations that are often noise
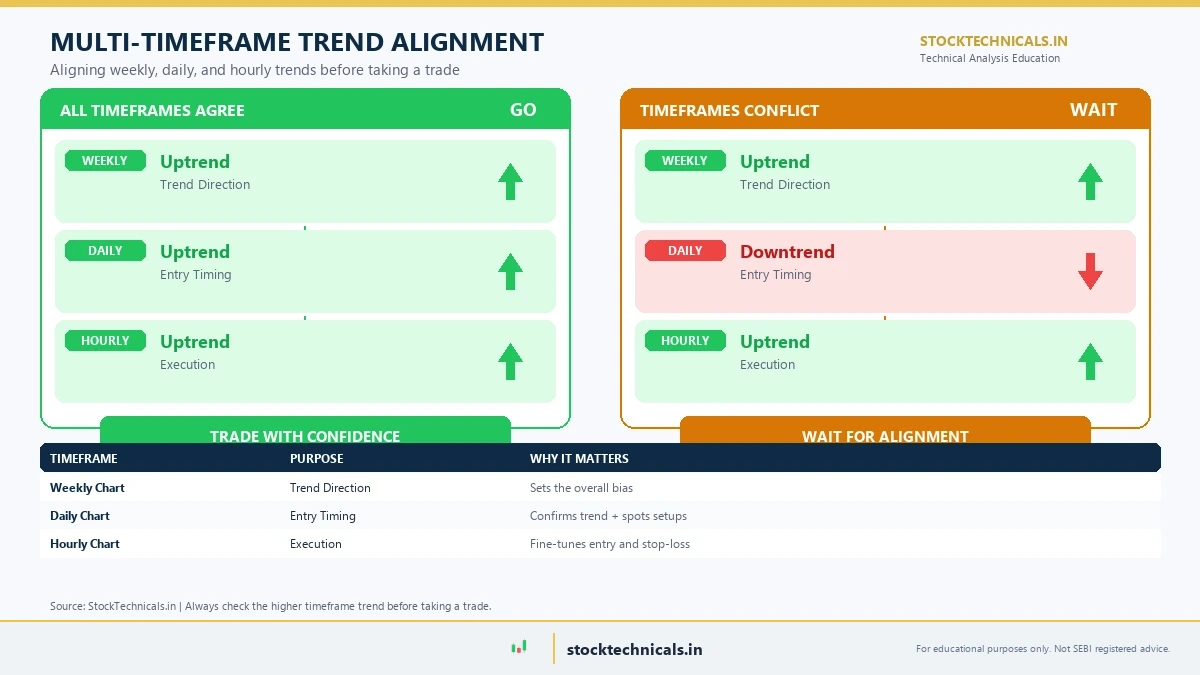
Chart data: Evergreen reference · Source: StockTechnicals.in
Why multi-timeframe analysis matters: The same stock can show an uptrend on the weekly chart, a pullback on the daily chart, and a bounce on the hourly chart — all at the same time. Each is correct within its timeframe. The key is knowing which timeframe governs your trading decision.
The practical framework:
- Weekly chart — identify the primary trend direction. Is the stock making higher highs and higher lows on a weekly basis? If yes, the primary trend is up.
- Daily chart — find entry opportunities. Within a weekly uptrend, look for pullbacks on the daily chart to moving averages or support levels. These are your buying opportunities.
- Hourly or 15-minute chart — time your entry. Once the daily chart shows a pullback to support, use the intraday chart to find the precise moment when buyers are stepping back in.
The rule of alignment: When all three timeframes agree on the trend direction, the setup has the highest probability of success. When timeframes conflict, reduce your position size or wait for alignment.
For more on selecting the right timeframe for your trading style, see the timeframes in trading guide.
How to Confirm a Trend: Volume and Indicators
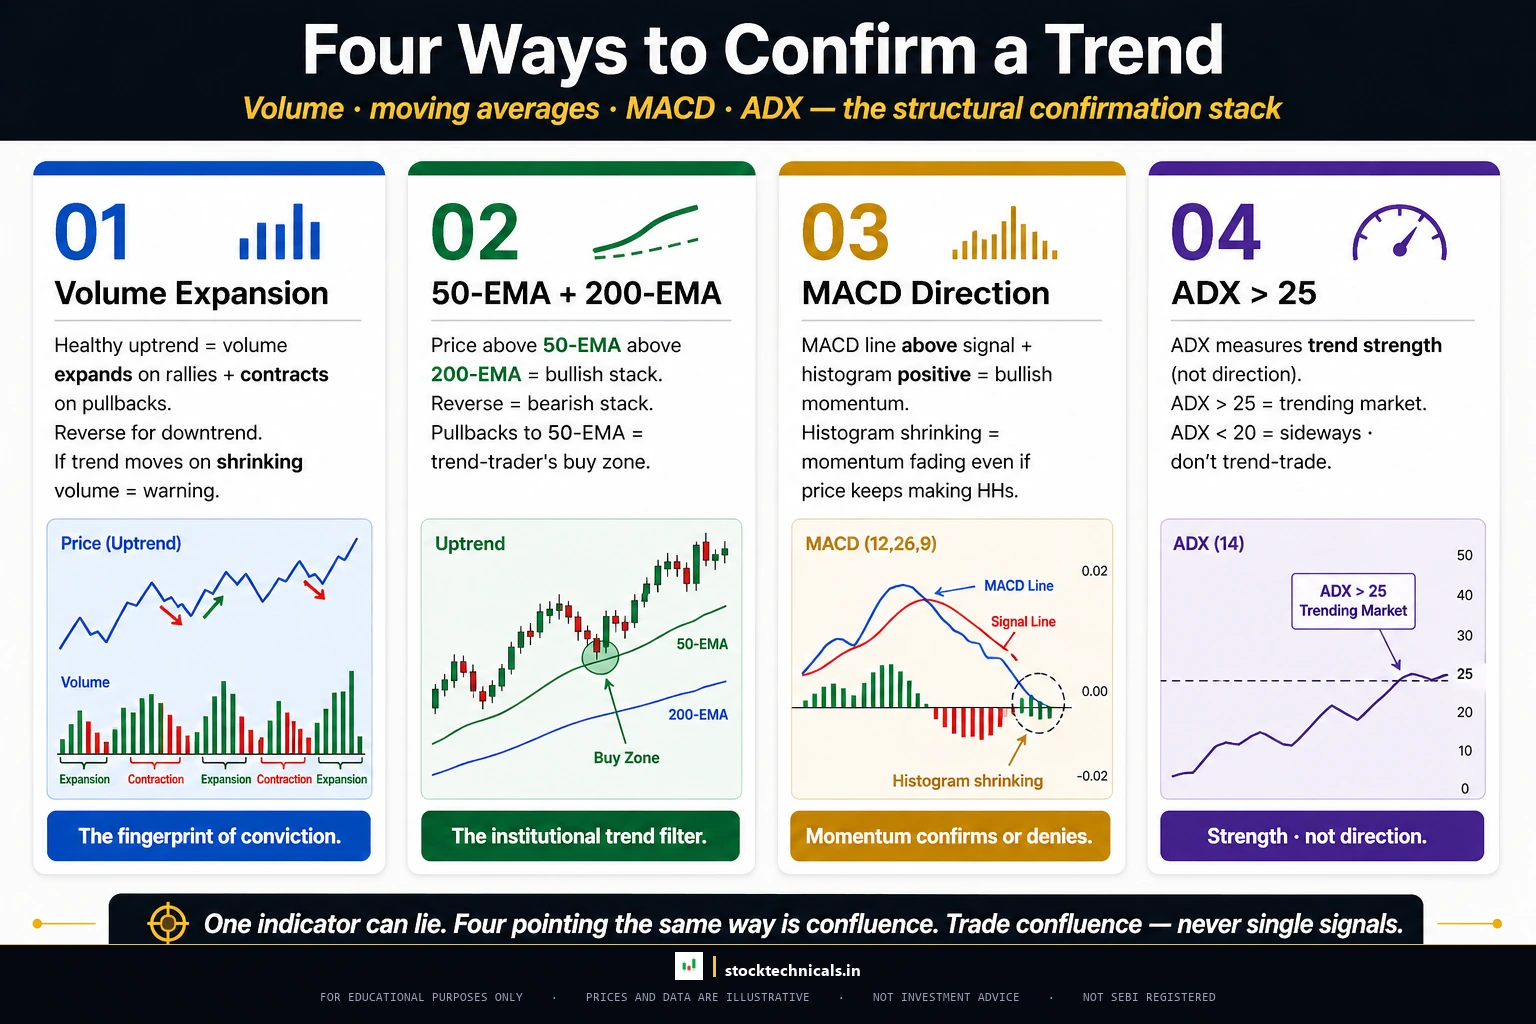
Price tells you the direction. Volume and indicators tell you whether to trust it.
Volume Confirmation
Volume is the number of shares traded in a given period. In a healthy uptrend:
- Volume expands on advancing days — this means buyers are aggressive and willing to pay higher prices
- Volume contracts on pullback days — this means sellers are not eager, and the pullback is just profit-taking, not a trend reversal
Example: SBI between October 2023 and June 2024 — a 40.8 percent uptrend from ₹602.95 to ₹848.95:
- On May 9, 2024, SBI surged to ₹839.65 with 4.93 crore shares traded — 2.72 times the trailing 20-day average volume of 1.81 crore shares. This volume surge confirmed strong institutional buying.
- On June 3, 2024, SBI hit ₹912.00 with 6.43 crore shares — 3.54 times the 20-day average. Massive confirmation.
- During the April 19, 2024 pullback, SBI dipped to ₹732.05 but volume was only 1.09 crore shares — 0.70 times the average. Low volume on the pullback confirmed it was healthy profit-taking, not distribution.
The message was clear: big volume on advances (buyers are committed), low volume on declines (sellers are passive). This is what a healthy trend looks like under the surface.
For a deeper go into reading volume, see the volume in trading guide.
Moving Average Confirmation
The two most widely used trend-confirmation tools are the 20-day EMA (exponential moving average) and the 50-day EMA:
- Price consistently above the 20 EMA: short-term trend is up
- Price consistently above the 50 EMA: medium-term trend is up
- 20 EMA above the 50 EMA (Golden Cross): both timeframes confirm the uptrend
- Price below both EMAs and 20 EMA below 50 EMA (Death Cross): trend is down
In the SBI example above, the Golden Cross occurred on December 6, 2023 (20 EMA at ₹578.29 crossed above 50 EMA at ₹577.23). From that signal through the June 2024 peak, SBI gained over 47 percent. From the Golden Cross through the June 2024 peak, the price stayed above the 50 EMA for 98 percent of trading days — a textbook trend confirmation.
Moving averages do not predict — they confirm. They work best in trending markets and give false signals in sideways markets, which is why you should first establish whether a trend exists before relying on EMA signals.
For EMA fundamentals and calculation, see the EMA basics guide.
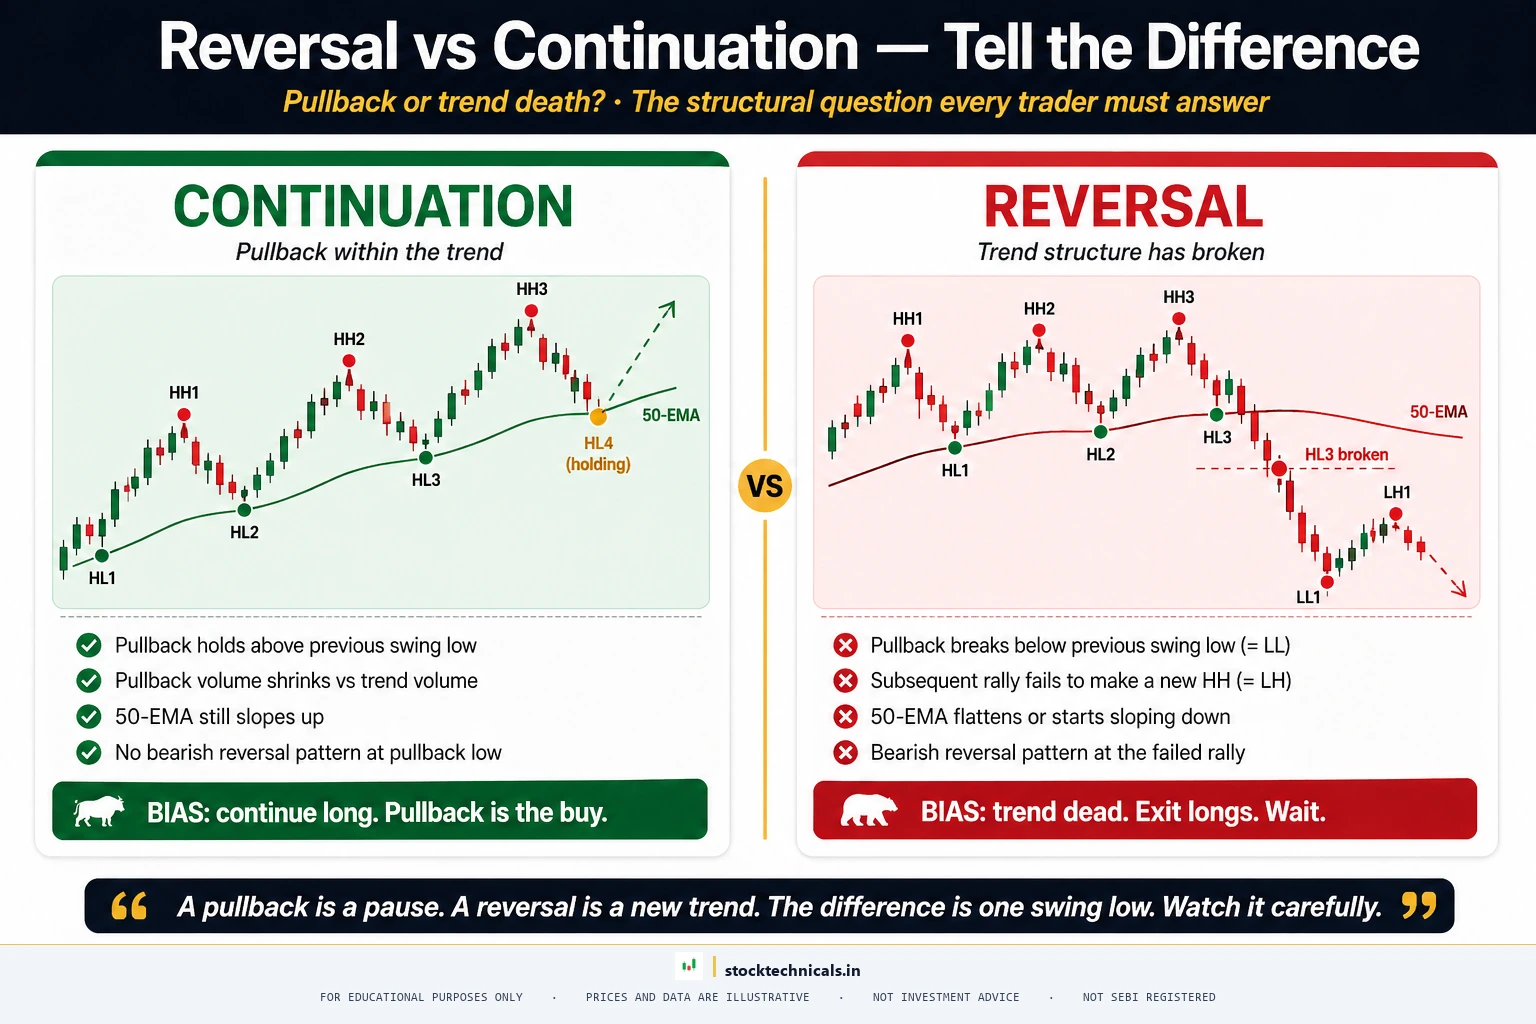
When Trends Change: Reversal vs Continuation
Every trend eventually ends. The question is: how do you distinguish a temporary pullback (continuation) from a genuine trend reversal?
The Structural Test
A trend has not reversed until the pattern of highs and lows changes:
- Uptrend reversal: The stock makes a lower high (fails to exceed the previous peak) AND then makes a lower low (breaks below the previous trough). Both conditions must occur.
- Downtrend reversal: The stock makes a higher low (does not reach a new bottom) AND then makes a higher high (exceeds the previous rally peak). Both conditions must occur.
Example: Tata Steel between April 2022 and June 2023:
- Downtrend phase: From ₹131.71 (April 1, 2022) to ₹82.70 (June 23, 2022) — a 37.2 percent decline. The Death Cross confirmed the downtrend on May 11, 2022 (20 EMA at ₹126.25 crossed below 50 EMA at ₹126.79).
- Reversal point: June 23, 2022 at ₹82.70. This was the lowest swing low.
- Confirmation: By August 16, 2022, Tata Steel had rallied to ₹113.70 — making a swing high above previous swing highs in the declining sequence. On 29 August, it pulled back to ₹103.25 — a higher low compared to the ₹82.70 bottom. Higher high + higher low = trend reversal confirmed.
- Golden Cross confirmation: August 5, 2022, 20 EMA (₹99.63) crossed above 50 EMA (₹99.55).
The subsequent uptrend produced higher swing highs: ₹113.70 then ₹116.10 then ₹124.30. Volume on the December 5, 2022 advance was 2.05 times the trailing 20-day average — confirming institutional participation in the new uptrend.
Pullback or Reversal? The Volume Clue
- Pullback (trend continues): Volume decreases during the counter-trend move. Price holds above the previous swing low (in an uptrend) or below the previous swing high (in a downtrend).
- Reversal (trend changes): Volume increases during the counter-trend move. Price breaks through the previous swing point.
This distinction saved SBI trend-followers during the April 19, 2024 pullback: volume dropped to 0.70 times the average (pullback behaviour), and price held above the 50 EMA. The trend continued, and SBI rallied another 22 percent in the next six weeks.
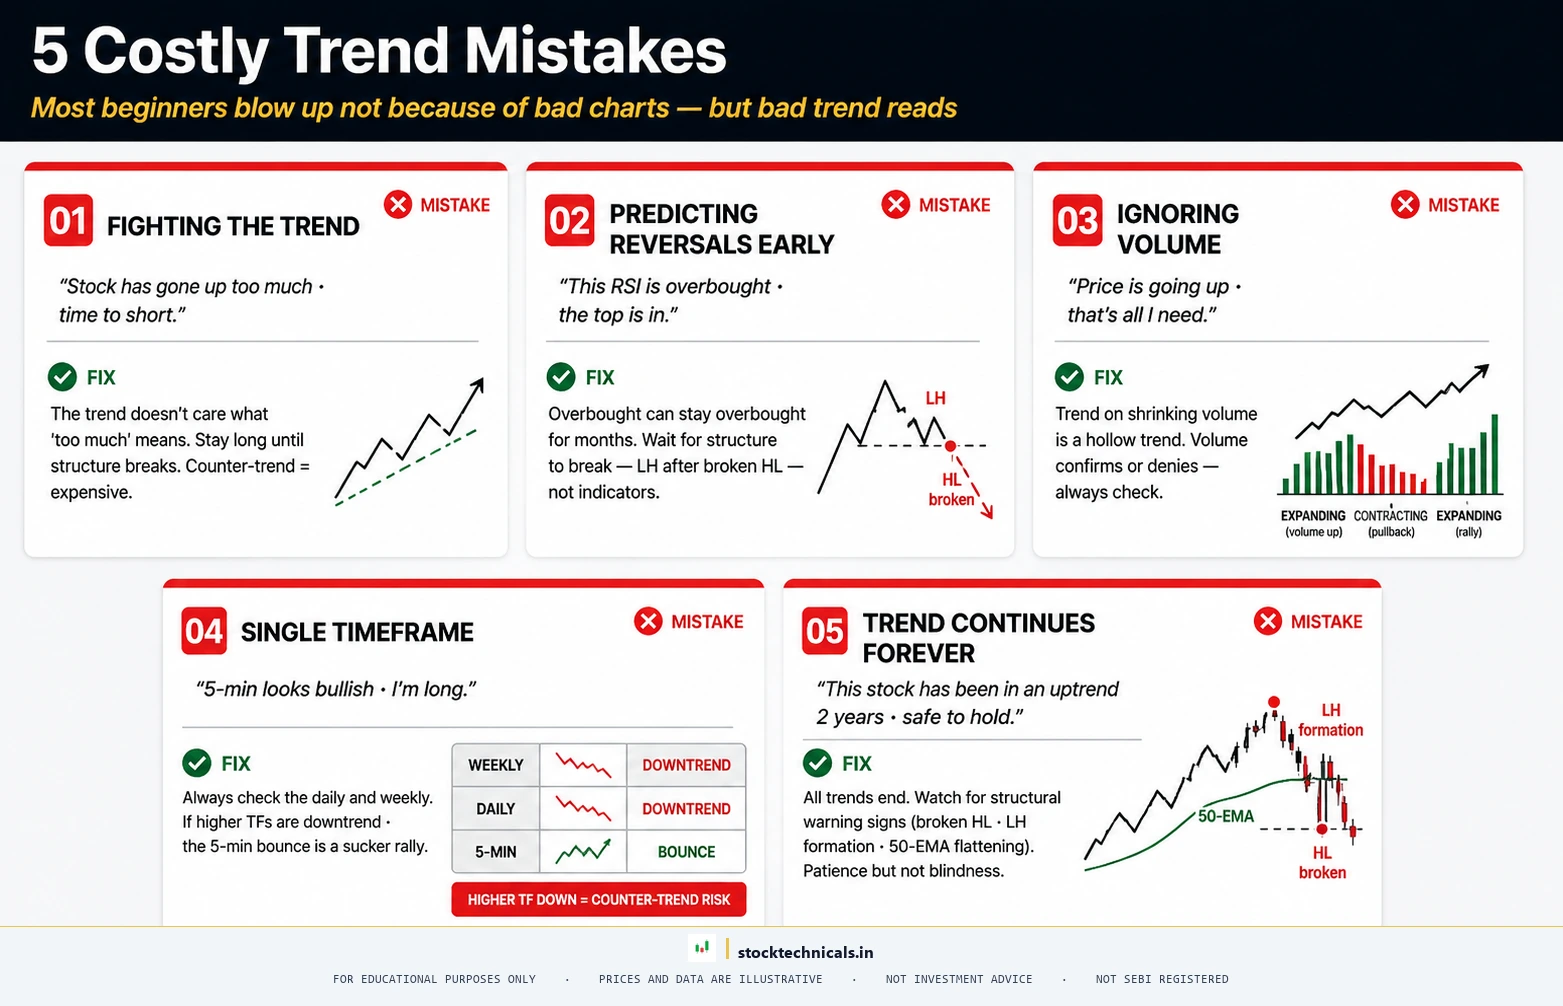
Common Mistakes in Trend Identification
Fighting the trend
The most expensive mistake. Traders see a stock that has risen sharply and assume it “must come down.” They short a strong uptrend or bottom-fish a falling stock. The Nifty 50 rose 42 percent between June 2023 and September 2024. Traders who shorted during that period were fighting the strongest force in the market.
Fix: Trade in the direction of the established trend until the structure of highs and lows actually breaks. Do not predict — react.
Calling tops and bottoms
Predicting exact reversal points is a losing game. Even professional fund managers get this wrong more often than right. During the Yes Bank decline from ₹245 to ₹29, multiple analysts called bottoms at ₹150, ₹100, and ₹50 — every single call was premature.
Fix: Wait for the trend structure to change. A lower high in an uptrend or a higher low in a downtrend. Confirmation before action.
Ignoring volume
A breakout without volume is suspicious. A trend move without volume confirmation is unreliable. The ITC false breakout on October 18, 2021 to ₹265.30 occurred on average volume — a warning sign. It failed within days.
Fix: Always check volume on significant moves. Genuine trend moves are backed by above-average volume.
Single timeframe tunnel vision
A stock may look bullish on a 15-minute chart while the daily chart shows a clear downtrend. Traders who only check one timeframe miss the bigger picture and end up trading counter-trend without realising it.
Fix: Check at least two timeframes before every trade. The higher timeframe gets more weight.
Moving stop-losses away from the market
When a trade goes against them, some traders widen their stops, hoping the price will recover. This turns a small, manageable loss into a portfolio-damaging one.
Fix: Set your stop-loss below the most recent swing low (for longs) or above the most recent swing high (for shorts) before entering the trade. Then respect it.
Trading with the Trend: Practical Rules
- Identify the trend first, then choose a strategy. Trend-following strategies (buying pullbacks, riding breakouts) work in trending markets. Range strategies (buying support, selling resistance) work in sideways markets. Using the wrong strategy for the market condition is the fastest way to lose money.
- Enter on pullbacks, not on breakouts. In an established uptrend, the safest entry is when the price pulls back to a support level — the 20 or 50 EMA, a trendline, or a previous swing low. Breakout entries carry more risk because the price has already extended.
- Place stops below structure. In an uptrend, your stop-loss goes below the most recent swing low. This gives the trade room to breathe while protecting you if the trend breaks. In a downtrend short, the stop goes above the most recent swing high.
- Let winners run. The biggest mistake profitable traders make is cutting winning trades too early. In a confirmed uptrend, hold as long as the trend structure remains intact — higher highs, higher lows, price above key moving averages. Trail your stop upward as each new swing low forms.
- Reduce size in sideways markets. When the trend is unclear, trade smaller or not at all. Capital preservation during sideways chop keeps you fully capitalised for the next trending move.
Your Trend Identification Checklist
Before entering any trade, run through this quick assessment:
- Swing point check: Are the recent swing highs getting higher or lower? Are the swing lows getting higher or lower?
- Moving average check: Is the price above or below the 20 and 50 EMA? Which EMA is on top?
- Volume check: Is volume expanding on moves in the dominant direction?
- Timeframe check: Does the higher timeframe agree with the trading timeframe?
- Trendline check: Is there a valid trendline holding? Has it been broken?
If the answers consistently point in one direction, you have a confirmed trend. If the answers are mixed, the market is transitioning — wait for clarity.
Interactive Tool: Trend Identifier
Trend Identifier
Learn to identify uptrends, downtrends, and sideways markets
Uptrend
Pattern: Higher Highs + Higher Lows. Each peak exceeds the previous peak, each trough is above the previous trough.
Action: Buy on pullbacks to support levels (moving averages, trendlines, or previous swing lows). Do not try to predict the top.
Volume: Expands on advancing days, contracts on pullback days. This confirms institutional buying.
Downtrend
Pattern: Lower Highs + Lower Lows. Each rally peak is lower than the last, each decline reaches a new low.
Action: Stay out or sell on rallies. Do not catch falling knives. Wait for structural reversal confirmation.
Volume: Expands on declining days, contracts on relief rallies. This confirms selling pressure.
Sideways Market
Pattern: Equal Highs + Equal Lows. Price bounces between a horizontal support floor and resistance ceiling.
Action: Range trade (buy at support, sell at resistance) or wait for a breakout with volume confirmation.
Volume: Generally lower than trending periods. No clear directional bias in volume patterns.
Q1. Are recent swing highs getting higher, lower, or staying flat?
Q2. Are recent swing lows getting higher, lower, or staying flat?
Q3. Is the price above or below the 50-day moving average?
Q4. Is volume expanding on the dominant move direction?
Q5. Does the higher timeframe (weekly) agree with your assessment?
Q1. What defines an uptrend?
Higher Highs and Higher LowsLower Lows and Lower HighsFlat highs and flat lowsRandom price movementQ2. Yes Bank fell from Rs 245 to Rs 29. What was the key structural signal?
Consecutive lower highs and lower lowsConsistently higher lowsSudden volume dropMoving average golden crossQ3. ITC traded between Rs 200 and Rs 243 for a full year. What type of market is this?
UptrendDowntrendSideways (range-bound)BreakoutQ4. When does a downtrend officially reverse?
When a single bounce occursWhen a higher low is followed by a higher highWhen volume spikes on one dayWhen a moving average crosses aloneQ5. In a healthy uptrend, what happens to volume on pullbacks?
It contracts (decreases)It expands (increases)It stays the sameVolume is irrelevantQuick Quiz
Test Your Trend Knowledge
Q1. What defines an uptrend?
Q2. Yes Bank fell from Rs 245 to Rs 29 in 2019. What was the key structural signal?
Q3. ITC traded between Rs 200 and Rs 243 for a full year. What type of market is this?
Q4. When does a downtrend officially reverse?
Q5. In a healthy uptrend, what happens to volume on pullbacks?
The Bottom Line
Trends are not complicated. Higher highs and higher lows mean up. Lower highs and lower lows mean down. Everything else is sideways. The difficulty is not in understanding the concept — a ten-year-old can understand it. The difficulty is in having the discipline to actually follow it.
Most traders lose money not because they cannot identify trends, but because they refuse to accept the trend they see. They want the uptrend to continue when it is breaking down. They want the downtrend to reverse when it still has months of selling ahead. They see sideways action and convince themselves it is a trend.
The rules in this guide are simple. Apply them consistently, and you will avoid the single most common reason traders blow up their accounts: fighting the direction of the market.
Real Talk
If you read this guide and immediately want to find the “best trend-following indicator” or the “perfect entry signal” — slow down. The trend identification framework in this article does not require any paid indicator, any premium charting software, or any special formula. It requires you to look at a price chart, mark the swing highs and swing lows, and determine whether they are going up, going down, or staying flat. That is it.
Master this skill — genuinely master it, not just skim it — before moving to indicators, chart patterns, or any other technical analysis concept. Everything else builds on top of trend identification. If you get this wrong, nothing else will save you.
Frequently Asked Questions
What is the simplest way to determine if a stock is in a trend?
Mark the last three or four swing highs and swing lows on the daily chart. If both the highs and lows are rising, it is an uptrend. If both are falling, it is a downtrend. If they are flat or mixed, the market is sideways. This method works without any indicator.
How long does a trend typically last?
There is no fixed duration. Primary trends on the Nifty 50 can last months to years — the June 2023 to September 2024 uptrend lasted 16 months. Secondary counter-trend moves typically last two to eight weeks. The length depends on the underlying catalyst, market sentiment, and global factors.
Can a stock be in an uptrend on one timeframe and a downtrend on another?
Yes, and this is common. A stock might show an uptrend on the weekly chart but a short-term pullback (downtrend) on the daily chart. This is why multi-timeframe analysis is essential — the higher timeframe generally carries more weight for determining the primary direction.
What is the difference between a pullback and a reversal?
A pullback is a temporary counter-trend move within an intact trend — price dips but holds above the previous swing low (in an uptrend) and volume is typically below average. A reversal is a structural change — price breaks the previous swing low and the pattern of higher highs and higher lows ends. Volume often increases during reversals.
Which moving averages are best for trend identification?
The 20-day EMA captures the short-term trend, and the 50-day EMA captures the medium-term trend. When both agree (price above both, and 20 EMA above 50 EMA), the trend is confirmed. The 200-day moving average is used for the long-term trend. No single moving average is “best” — they work together.
Should beginners trade against the trend?
No. Counter-trend trading requires precise timing, experience with reading exhaustion signals, and strict risk management. Beginners should exclusively trade in the direction of the established trend. Even experienced traders find that trend-following strategies are more consistently profitable than counter-trend strategies over time.
How do you handle a trend change in a stock you already own?
When the trend structure breaks — a lower high followed by a lower low in what was an uptrend — tighten your stop-loss to the most recent swing low and prepare to exit. If price breaks that swing low, exit the position. Do not wait for a “recovery” that may never come. Capital preservation is always the priority.
Trade with the trend or stand aside. The market does not care about your opinion. Per the SEBI FY24-25 study, 91 percent of individual equity F&O traders lost money — counter-trend trading without a proven edge is the quickest way to join them.
Continue Learning
- What is Technical Analysis? — the foundational concept that everything in technical analysis builds upon
- Trendlines — how to draw, validate, and trade trendlines that define trend boundaries
- Volume in Trading — why volume confirms trends and how to read volume patterns
- What is a Breakout? — how trends begin with breakouts from ranges or patterns
- What is a Pullback? — the safest entry strategy within an established trend
- Dow Theory — the original framework for understanding market trends, still relevant today