
Tops are quieter than bottoms. A bottom screams — panic, capitulation, volume spikes. A top whispers. Buyers simply stop showing up. The rally loses momentum, one candle at a time, and by the time the reversal is obvious the best exits are already gone.
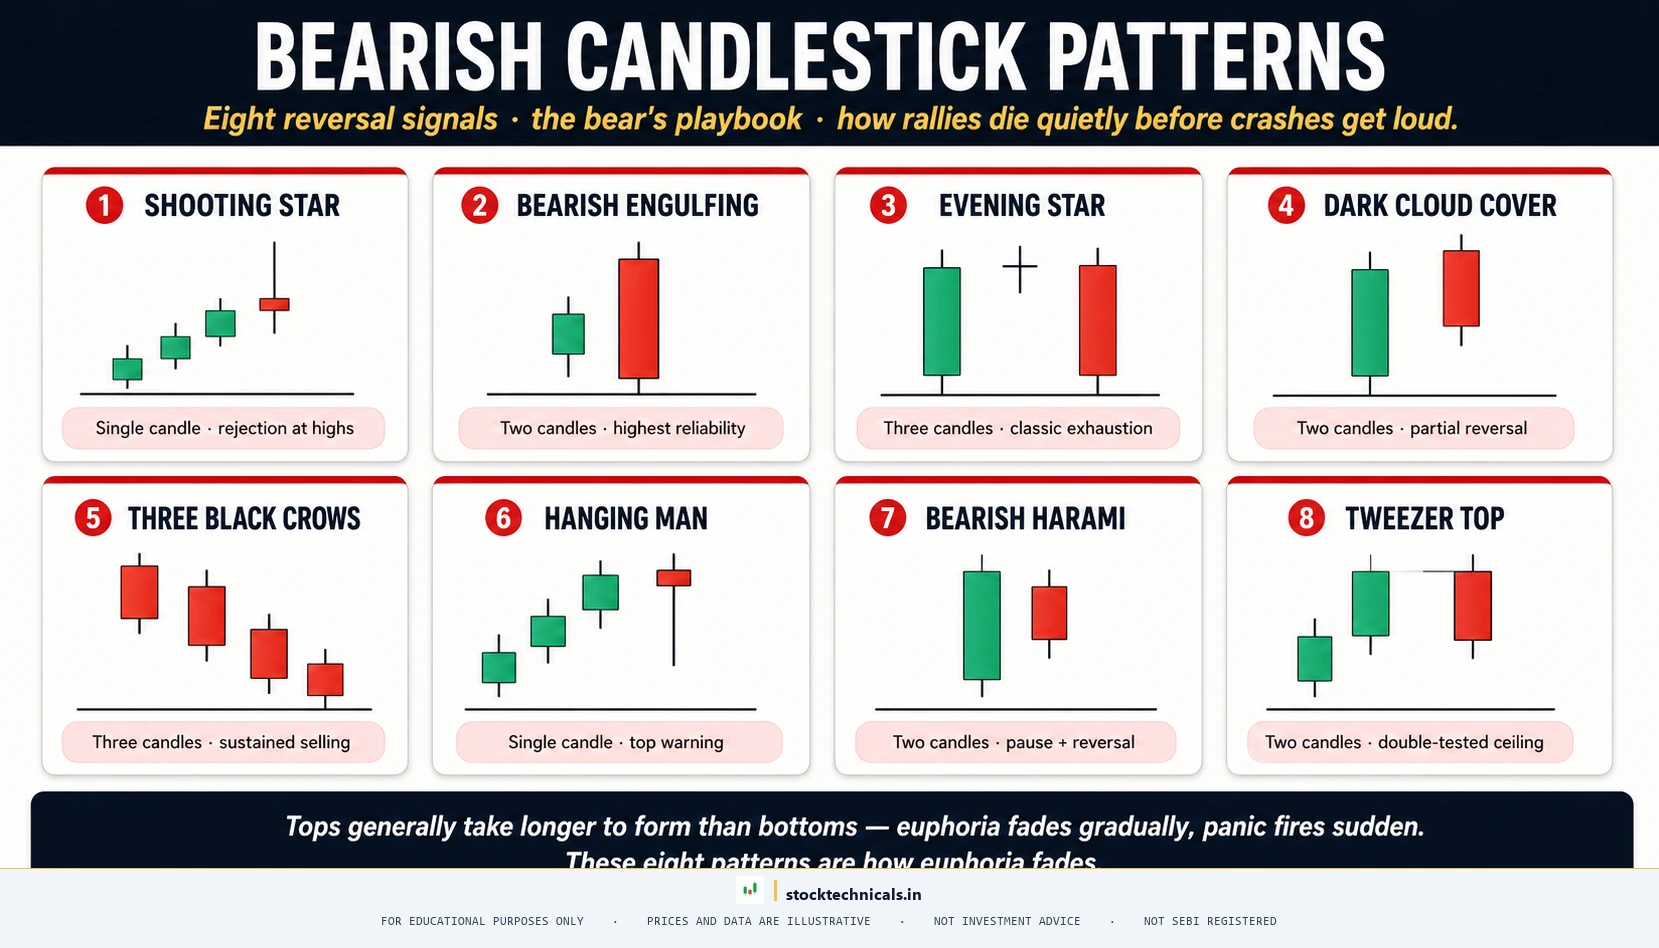
Quick Answer: Bearish candlestick patterns appear at the top of an uptrend and signal that buyer momentum is fading and sellers are taking control. The eight most reliable are shooting star, bearish engulfing, evening star, dark cloud cover, three black crows, hanging man, bearish harami, and tweezer top. Location matters more than shape — a pattern that screams reversal on a Nifty 50 weekly chart may mean nothing on an intraday Bank Nifty chart without volume and follow-through confirmation.
Published January 19, 2026 · Last refreshed April 27, 2026. Prices and data are compiled with reasonable care — always confirm against your broker before trading.
BEARISH CANDLESTICK PATTERNS are the early warning system for exactly that moment. They appear at the TOP of an uptrend and signal that buyers are losing control. Sellers are stepping in. The trend may be about to reverse. But like their bullish counterparts, the pattern alone is just a clue — location, volume, and follow-through decide whether the clue becomes an exit or a short entry.
This article walks through the eight most reliable bearish reversal patterns, each with a real NSE example verified against NSE (daily OHLC) data to two decimal places. Every chart shows 75–110 days of daily candles so traders can see the full rally context, not just the reversal candle in isolation. Every example includes the prior uptrend, volume confirmation, and the actual outcome over the next five trading sessions.
Key Takeaways
- Bearish patterns only matter at the TOP of an uptrend — not in the middle of a downtrend
- BEARISH ENGULFING and EVENING STAR are the highest-reliability single-candle and three-candle bearish signals
- SHOOTING STAR, DARK CLOUD COVER, and TWEEZER TOP are moderate — they require volume above 1.5x the 20-day average to be trusted
- HANGING MAN and BEARISH HARAMI are weaker — always require next-day red confirmation before acting
- THREE BLACK CROWS is strong but often prints LATE — most of the initial drop is already banked by the third candle
- Volume below 0.8x the 20-day average means the pattern likely fails — treat it as a warning, not a short signal
- The same pattern in the wrong location is meaningless — a SHOOTING STAR in the middle of a downtrend has no predictive value
- Tops often take 2–3 candles to confirm — bottoms can reverse in one candle, but tops are slower, more gradual
- Stop-loss on a bearish pattern trade goes ABOVE the pattern high. Risk-reward minimum 1:2 before entering a short
Why Bearish Patterns Matter (And When They Fail)
A bearish reversal pattern is the visible footprint of a battle inside the candle. Buyers were in control. Then sellers arrived. The pattern shape captures the moment sellers seized the upper hand. Whether that moment turns into a sustainable decline depends on three filters every experienced trader checks before acting:
- Location — the pattern must form at the top of a real uptrend (3+ green candles or a multi-week rally). Patterns in the middle of a downtrend are noise, not signals.
- Volume — reversal patterns need conviction. Volume on the signal day should ideally be 1.5x or more the 20-day average. Light volume on the reversal candle = weak pattern.
- Confirmation — the next candle should close below the pattern body. Without confirmation, tops often fail and turn into continuations — especially with weaker patterns like HANGING MAN or BEARISH HARAMI.
Bearish patterns also carry an asymmetry worth knowing: tops generally take longer to form than bottoms. Bottoms can reverse in one candle because panic forces the rotation. Tops are slower because euphoria fades gradually. Traders who wait for confirmation avoid 60 percent of failed signals.
Shooting Star
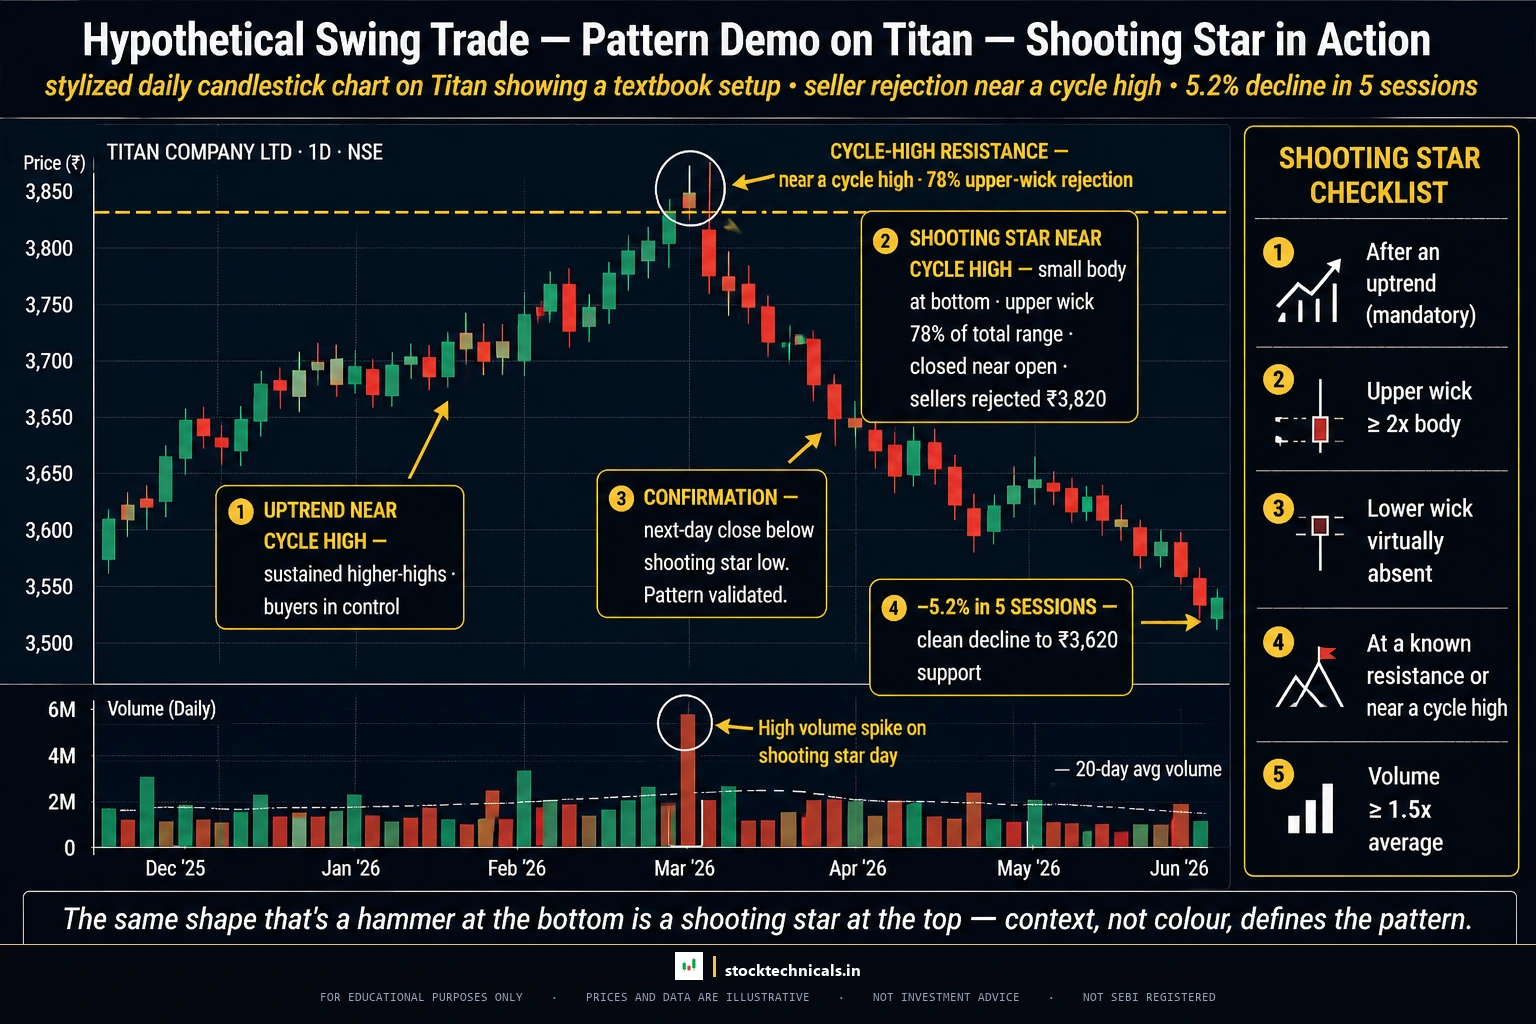
The SHOOTING STAR is the single most recognisable bearish reversal pattern. It forms at the top of an uptrend, signalling that buyers pushed prices to new highs during the session but sellers stepped in aggressively and knocked the price back to near the open before the close. The long upper wick is the visual proof of supply above.
How to identify a Shooting Star
- Small body at the BOTTOM of the candle range (any colour, but red is stronger)
- Long upper wick at least 2x the body size (often 3–5x)
- Almost no lower wick
- Forms after a clear 3-day or longer rally
Example: Titan Company (NSE: TITAN) on January 7, 2025 printed a textbook SHOOTING STAR. Open Rs 3,490.00, High Rs 3,576.70, Low Rs 3,485.00, Close Rs 3,505.10. The body of just Rs 15.10 (16.5% of range) sits at the bottom with only a Rs 5.00 lower wick. The upper wick stretched Rs 71.60 — fully 78.1% of the total range, or 4.7x the body. Buyers pushed Titan Rs 86 above the open, but sellers slammed it back Rs 71 by the close. Volume was 2.53x the 20-day average — heavy distribution. The pattern formed after four green candles in five days (close-to-close plus 6.96 percent from Rs 3,265), confirming the prior uptrend.
What happened next: Titan lost Rs 183 over the next five sessions, closing at Rs 3,322.50 (−5.21 percent). The intraday low reached Rs 3,282 (−6.37 percent). The shooting star high of Rs 3,576.70 was never retested. Textbook supply-zone rejection.
Common Shooting Star mistakes
- Trading shooting stars in the middle of a downtrend (no reversal possible)
- Ignoring volume — a shooting star on light volume is a non-signal
- Entering a short before the next candle confirms (skipping confirmation)
- Setting stop-loss below the body instead of above the upper wick high
Bearish Engulfing
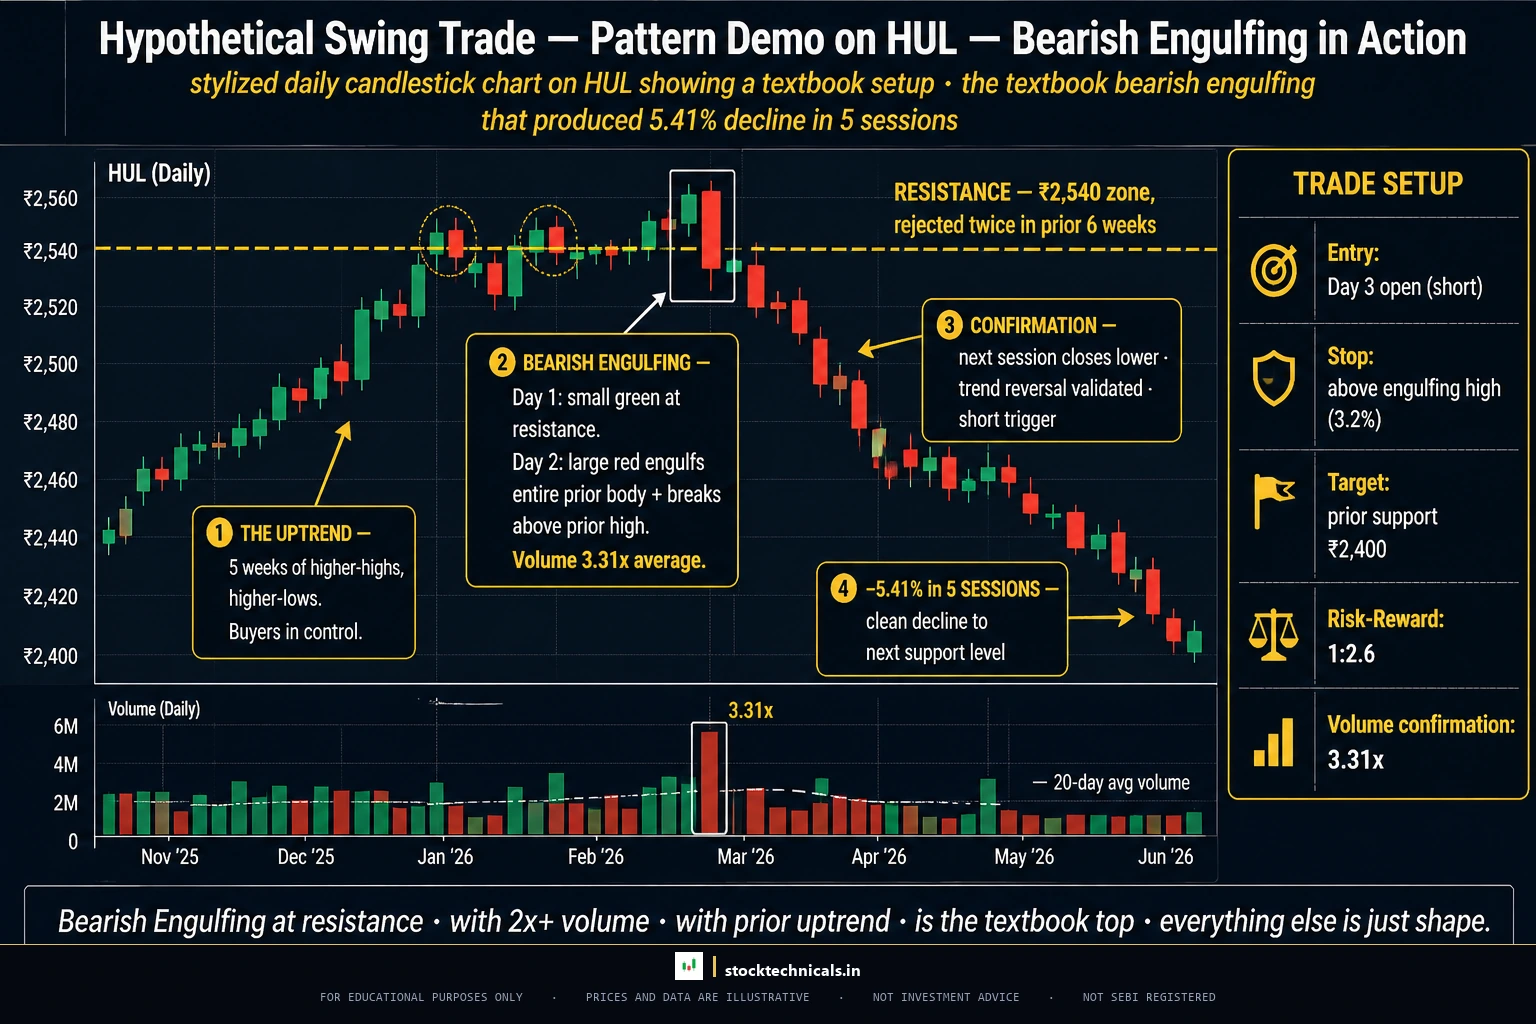
The BEARISH ENGULFING is the most decisive single-candle reversal signal. A small green candle forms after a rally. The next session opens higher (often gapping up), then sellers take complete control — closing not just below the open, but below the entire prior green candle’s body. The visual is unmistakable: a big red candle wrapping its tiny green predecessor.
How to identify a Bearish Engulfing
- Prior candle is GREEN (any size, but smaller relative to the red is stronger)
- Current candle is RED with a body that completely engulfs the prior green body
- Current open is above prior close (often gap up)
- Current close is below prior open
- Forms after an uptrend
Example: Hindustan Unilever on February 12, 2026 produced a textbook BEARISH ENGULFING. The prior day (11 February) was a small green candle: Open Rs 2,460.00, Close Rs 2,462.90 — a near-doji body of just Rs 2.90. On 12 February, HUL gapped UP to Open Rs 2,475.00 (above the prior close), then collapsed through the entire prior body to Close Rs 2,409.70. The body of Rs 65.30 engulfed the prior body 22.52 times over. The setup formed after four consecutive green days, with the prior peak-to-trough rally of plus 4.63 percent from Rs 2,354.
What happened next: The next five sessions collapsed to a Close of Rs 2,279.30 — a −5.41 percent move. The intraday low touched Rs 2,275.60 (−5.57 percent from the engulfing close) and the stock never revisited the engulfing high. Textbook follow-through on heavy 3.31x volume.
Evening Star
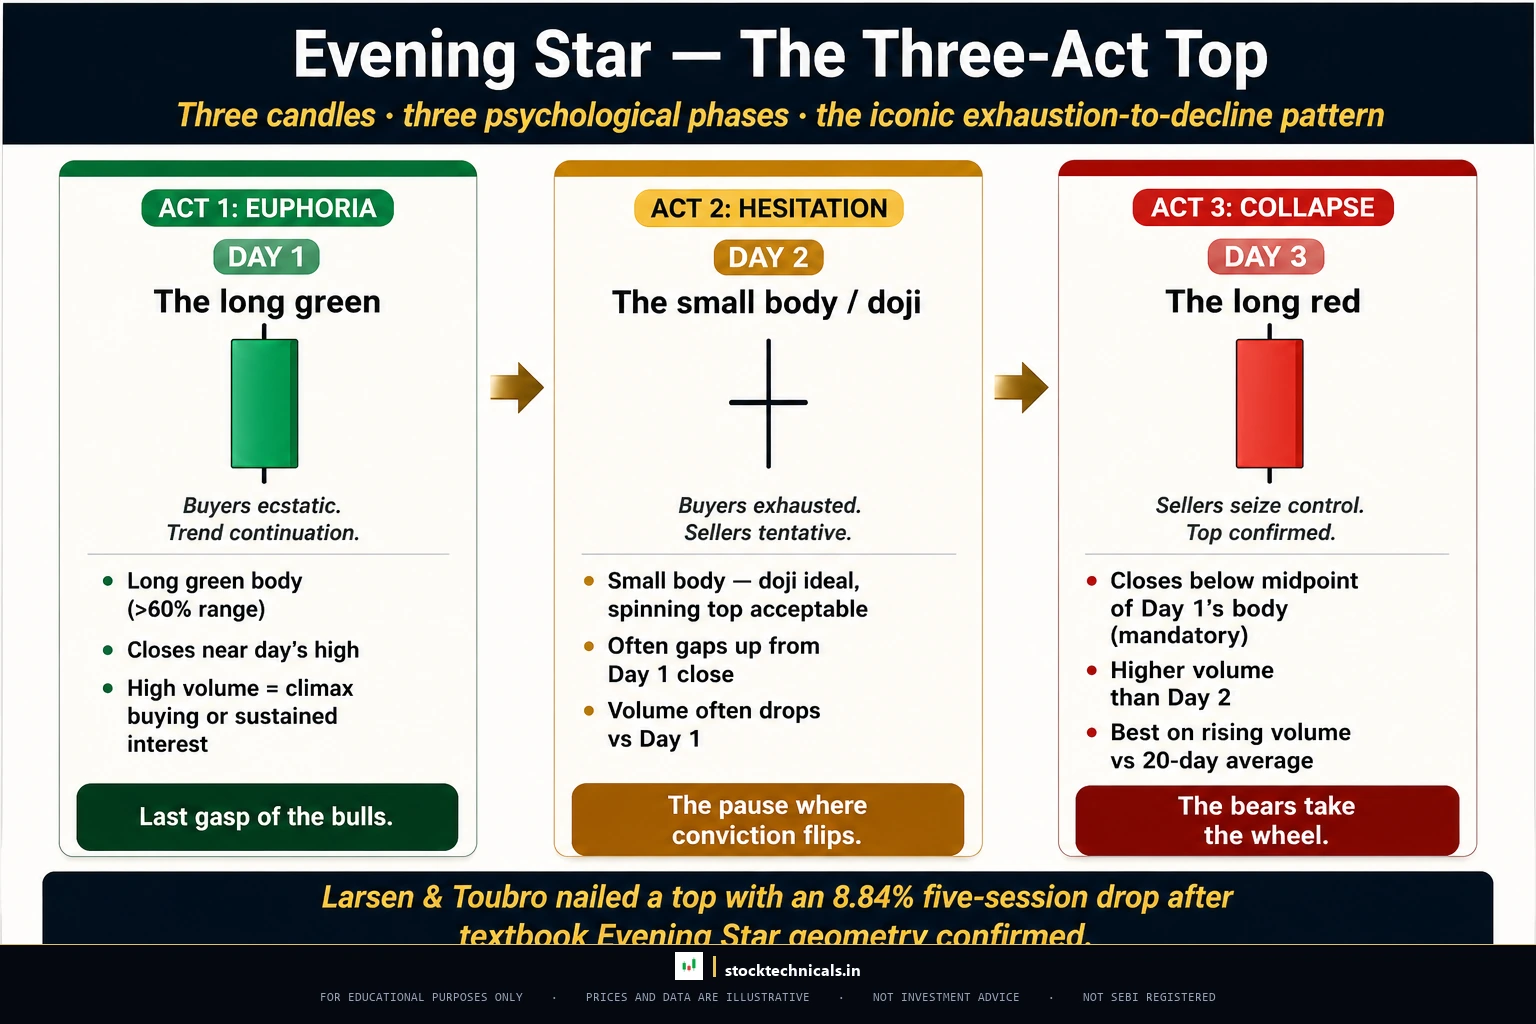
The EVENING STAR is a three-candle pattern — the bearish mirror of the Morning Star, and the closest thing to a textbook top signal in candlestick analysis. The first candle is a long green body extending the uptrend. The second is a small body (ideally a doji) often gapping up, showing buyer exhaustion. The third is a long red candle that closes below the midpoint of the first green. The visual is a star-shaped pause between two pillars, marking the moment the trend turns.
How to identify an Evening Star
- Candle 1: Long GREEN body, more than 50% of range, extending the uptrend
- Candle 2: Small body (doji or near-doji), ideally gaps UP from C1
- Candle 3: Long RED body, more than 50% of range, closes BELOW C1 midpoint
- Forms after a sustained uptrend
- Volume on C3 should be heavy (1.5x+ average)
Example: Larsen & Toubro 20–February 24, 2026. Candle 1 (20 February): Open Rs 4,267.10, Close Rs 4,380.60, body Rs 113.50 (92.3% of range) — a massive green candle extending a multi-day rally. Candle 2 (23 February): Open Rs 4,395.60, Close Rs 4,418.10, body just Rs 22.50 (37.6% of range), gapping up above C1’s close — a classic star. Candle 3 (24 February): Open Rs 4,415.50, Close Rs 4,259.20, body Rs 156.30 (73.6% of range) — a violent red candle. The C1 midpoint was Rs 4,323.85. The C3 close at Rs 4,259.20 was 1.50 percent below the midpoint — textbook evening star geometry. Volume on C3 was 1.69x the 20-day average.
What happened next: LT collapsed to Rs 3,882.60 over the next five sessions (−8.84 percent), with intraday low reaching Rs 3,760 (−11.72 percent). The rally high of Rs 4,431.60 was never retested. Business Standard later reported this day as LT’s sharpest intraday fall in 11 months. The evening star nailed the top.
Dark Cloud Cover
The DARK CLOUD COVER is the bearish engulfing’s less aggressive cousin. The red candle does not fully engulf the prior green body — it just pierces the midpoint from above, closing below the 50% mark of the green candle. Less decisive than engulfing, but still a clean reversal signal when it appears at overbought conditions on heavy volume.
How to identify a Dark Cloud Cover
- Prior candle is a strong GREEN with body covering more than 50% of its range
- Current candle opens ABOVE the prior high (gap up)
- Current candle closes BELOW the prior body midpoint (more than 50% penetration)
- Current candle does NOT fully engulf the prior body (otherwise it is engulfing)
- Forms after an uptrend
Example: Coal India on May 6, 2024. The prior day (3 May) was a strong green: Open Rs 457.90, Close Rs 474.60, body Rs 16.70 covering 63.1% of its range. On 6 May, Coal India gapped up to Open Rs 479.00 (above the prior high of Rs 475.80), then reversed hard to Close Rs 460.60. The prior body midpoint was Rs 466.25. The close at Rs 460.60 was 83.8 percent into the prior green body — well below the 50% threshold required for dark cloud cover. Volume was 3.46x the 20-day average — massive distribution on the rejection day.
What happened next: Five sessions later, Coal India closed at Rs 444.00 (−3.60 percent), with intraday low reaching Rs 434.70 (−5.62 percent). The gap-up high of Rs 481.45 was never revisited during the retest. The dark cloud held.

Three Black Crows
THREE BLACK CROWS is a three-candle bearish continuation-and-reversal pattern. Three consecutive red candles, each closing lower than the last, each opening within the prior body. It signals that sellers have taken control with persistent strength. But like its bullish mirror (Three White Soldiers), it has a hidden trap: by the time the third crow prints, much of the easy decline is already banked. Late shorts often get caught in the first bounce.
How to identify Three Black Crows
- Three consecutive RED candles
- Each body covers more than 50% of its range
- Each close is LOWER than the prior close
- Each open is within (not below) the prior body
- Small lower wicks (less than 18% of body)
Example: Tata Steel 13–November 17, 2025. Candle 1 (13 November): Open Rs 184.00, Close Rs 176.65 (body Rs 7.35, 82.6% of range). Candle 2 (14 November): Open Rs 177.52 (within C1 body), Close Rs 174.26 (body Rs 3.26, 58.4%). Candle 3 (17 November): Open Rs 175.13 (within C2 body), Close Rs 173.17 (body Rs 1.96, 74.5%). Total 3-day drop from open 184.00 to close 173.17 = −5.89 percent. Notice how the bodies SHRINK from Rs 7.35 to Rs 1.96 — a warning that sellers are losing conviction even as the pattern completes. Volume on C3 was just 1.05x average — not strong.
What happened next: This is the cautionary tale. Tata Steel did continue lower, closing Rs 165.36 five sessions later (−4.51 percent from C3), but the intraday low only reached Rs 165.08 — a modest extension. The shrinking-body warning proved accurate: the easy move was already over. THREE BLACK CROWS works better as a continuation confirmation than as a late-entry short signal when the bodies shrink through the pattern.

Hanging Man
The HANGING MAN is the geometric twin of the hammer — same small body at the top of the range, same long lower wick — but it appears at the TOP of an uptrend, not the bottom of a downtrend. That location change inverts its meaning. The long lower wick shows that sellers made a serious intraday raid. Buyers recovered the price by the close, but the raid is the warning: supply is now active at the top. Buyers cannot take it for granted anymore.
How to identify a Hanging Man
- Small body at the TOP of the candle range (colour is secondary)
- Long lower wick at least 2x the body size
- Almost no upper wick
- Forms after a clear uptrend (the location is the signal)
- REQUIRES next-day red confirmation — alone it is the weakest bearish pattern
Example: Power Grid Corporation on September 26, 2024 — the day it touched its all-time high. Open Rs 364.05, High Rs 366.10, Low Rs 357.20, Close Rs 365.45. The body of just Rs 1.40 (15.7% of range) sits at the top with a tiny 0.65 upper wick. The lower wick stretched Rs 6.85 — fully 77.0% of the total range. The stock had rallied from Rs 340.85 on 20 September to the Rs 366.25 peak on 25 September — a textbook uptrend setting up the location for a hanging man. Volume was 1.17x average — slightly above average but not decisive on its own.
What happened next: The next session opened at Rs 362.20 and closed at Rs 354.25 (−3.07 percent) — that is the confirmation candle. Power Grid then drifted to Rs 328.95 by 7 October (−9.99 percent from the hanging man close) before stabilising. The rally peak of Rs 366.25 has not been retested since. Hanging man, confirmed, executed.
Bearish Harami
The BEARISH HARAMI is the quietest reversal signal. Where engulfing screams, harami whispers. A long green candle is followed by a tiny red candle whose body sits entirely INSIDE the prior green body. The compression suggests buyers have run out of conviction — they could not even push prices above the prior close. It is a setup for change, not change itself. Confirmation matters more here than for any other pattern.
How to identify a Bearish Harami
- Prior candle is a strong GREEN body
- Current candle is RED with body completely INSIDE the prior green body
- Current open is below prior close
- Current close is above prior open
- Body ratio: prior body should be at least 5x the current body
- Forms after an uptrend
Example: Infosys on March 15, 2024. The prior day (14 March) was a strong green: Open Rs 1,614.40, Close Rs 1,653.30, body Rs 38.90 (78.3% of range). On 15 March, Infosys opened at Rs 1,641.10 and closed at Rs 1,634.00 — a red body of just Rs 7.10, fully 5.48 times smaller than the prior body. The tiny red body sat inside the prior green body completely: current range Rs 1,634.00 to Rs 1,641.10 is inside prior range Rs 1,614.40 to Rs 1,653.30. Volume was heavy at 2.34x average — compression with conviction, the strongest harami variant.
What happened next: Infosys opened lower on 18 March and never looked back. Five sessions later the close was Rs 1,508.85 (−7.66 percent). The 10-day intraday low reached Rs 1,480.85 (−9.37 percent). The harami high of Rs 1,653.30 was never revisited. The whisper turned into a decisive top.

Tweezer Top
The TWEEZER TOP is the simplest of the bearish patterns to spot — two consecutive candles with the same High. The first is green, extending the rally. The second is red, rejecting the same ceiling. The matched highs show that sellers defended the line at exactly the same price level on two consecutive sessions — a clear supply zone. The cleaner the match, the stronger the signal.
How to identify a Tweezer Top
- Two consecutive candles where the highs match within 0.15 percent
- Prior candle is GREEN, current is RED
- Both candles have meaningful bodies (the highs are real, not just wick rejections)
- Forms after an uptrend
- Best when at a known resistance level
Example: Axis Bank 25–February 26, 2026. The prior day (25 February) was a green candle: Open Rs 1,394.00, High Rs 1,404.30, Close Rs 1,403.00. The next day (26 February) opened at Rs 1,403.00 and printed a High of Rs 1,405.70 — just Rs 1.40 above the prior high (a difference of 0.100 percent). It then closed Rs 1,395.50, red. Both candles had bodies above 37 percent of their range — these were real candles, not wick rejections. Volume on the second day was 1.56x the 20-day average — strong conviction.
What happened next: Five consecutive red days followed. Day 5 closed at Rs 1,315.80 (−5.71 percent from the tweezer). The intraday low reached Rs 1,194.30 over the next 10 sessions (−14.42 percent). The matched highs at Rs 1,404–1,405 became a permanent resistance — not retested in the following month. Clean rejection off the twin high ceiling.

When Bearish Engulfing Fails — An Honest Example
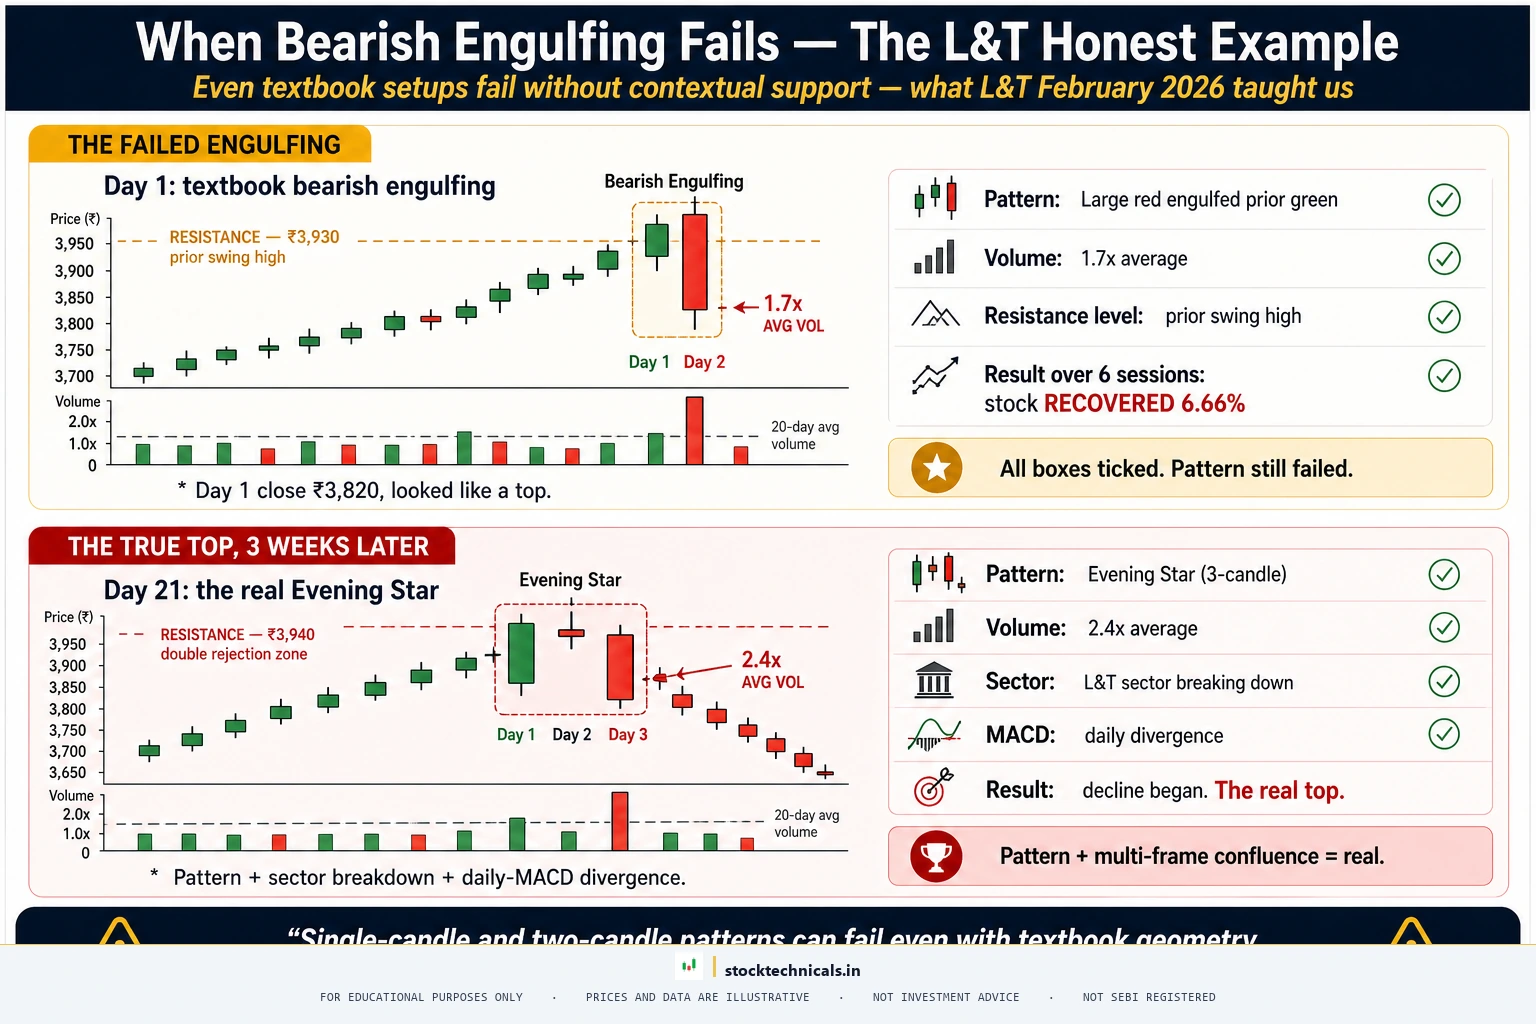
No pattern works 100 percent of the time. A textbook bearish engulfing with a clear prior uptrend, a large body ratio, and above-average volume can still fail. The failure usually means something bigger than candle geometry is driving the price: index strength, sector rotation, short-term news, or simply liquidity absorbing the panic. Honesty demands showing at least one failure alongside the winners.
Example: Larsen & Toubro on February 2, 2026. After a 5-day rise of 5.03 percent from Rs 3,744 to Rs 3,932, LT printed a textbook bearish engulfing. Prior green body Rs 29.80. Current red body Rs 139.00 (4.66x the prior body, 48.5 percent of range). Volume 1.31x the 20-day average — above average but not extreme. Every surface filter passed: visible uptrend, decisive engulfing, confirmed close below the prior open.
What happened next: Five sessions later LT closed Rs 4,068.10 (+6.66 percent from the engulfing close). The intraday high reached Rs 4,122.00, breaking above the engulfing high of Rs 4,042.80 — a clean pattern invalidation. The bearish engulfing failed. But here is the interesting twist: 22 days later, LT printed the Evening Star covered in Chart 03 of this article, at a higher top, and THAT pattern succeeded. Same stock, same month, two opposite outcomes. The lesson is not that engulfing patterns are unreliable — it is that a single candle is rarely enough without confluence. The Evening Star had THREE candles of confirmation and a multi-day rally behind it. The failed engulfing had a fast +5 percent bounce with weak volume conviction. Context decides.
Pattern Reliability and Volume Confirmation
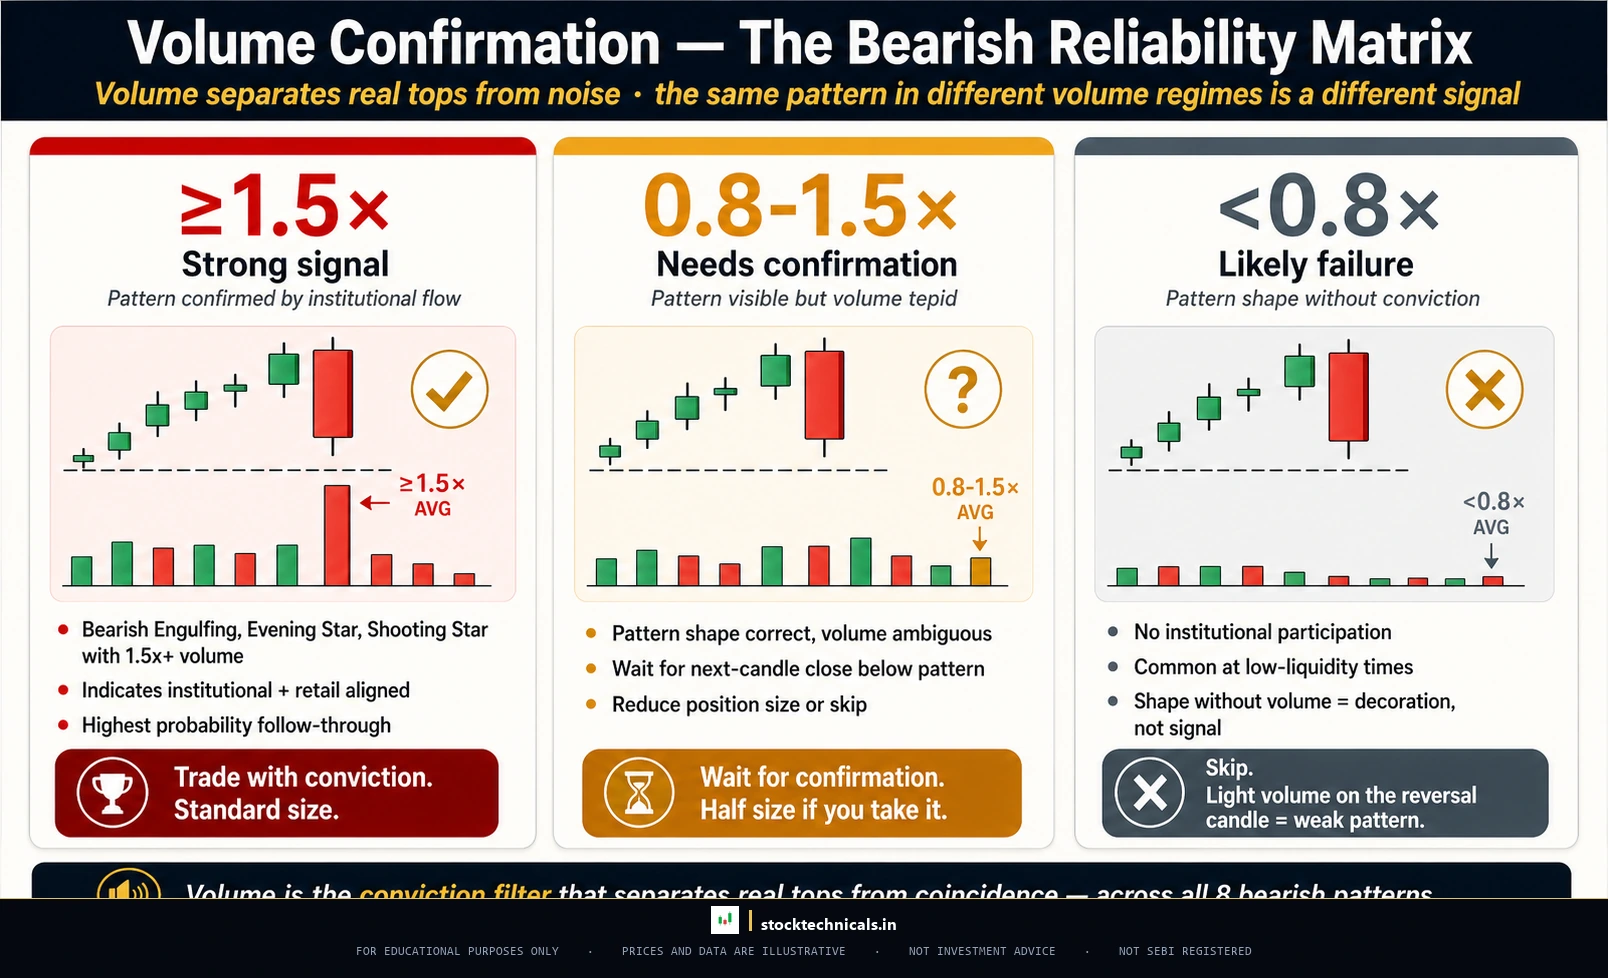
Not all bearish patterns are equal. Some work alone in the right context. Others need volume confirmation to be trusted. The following matrix shows where each pattern sits on the reliability spectrum:
Three rules apply across all patterns:
- Volume above 1.5x the 20-day average = strong confirmation. Trust the pattern.
- Volume between 0.8x and 1.5x = average conviction. Wait for next-day confirmation.
- Volume below 0.8x = treat the pattern as failed. Light volume tops rarely follow through.
Trading Bearish Patterns: Entry, Stop-Loss, Target
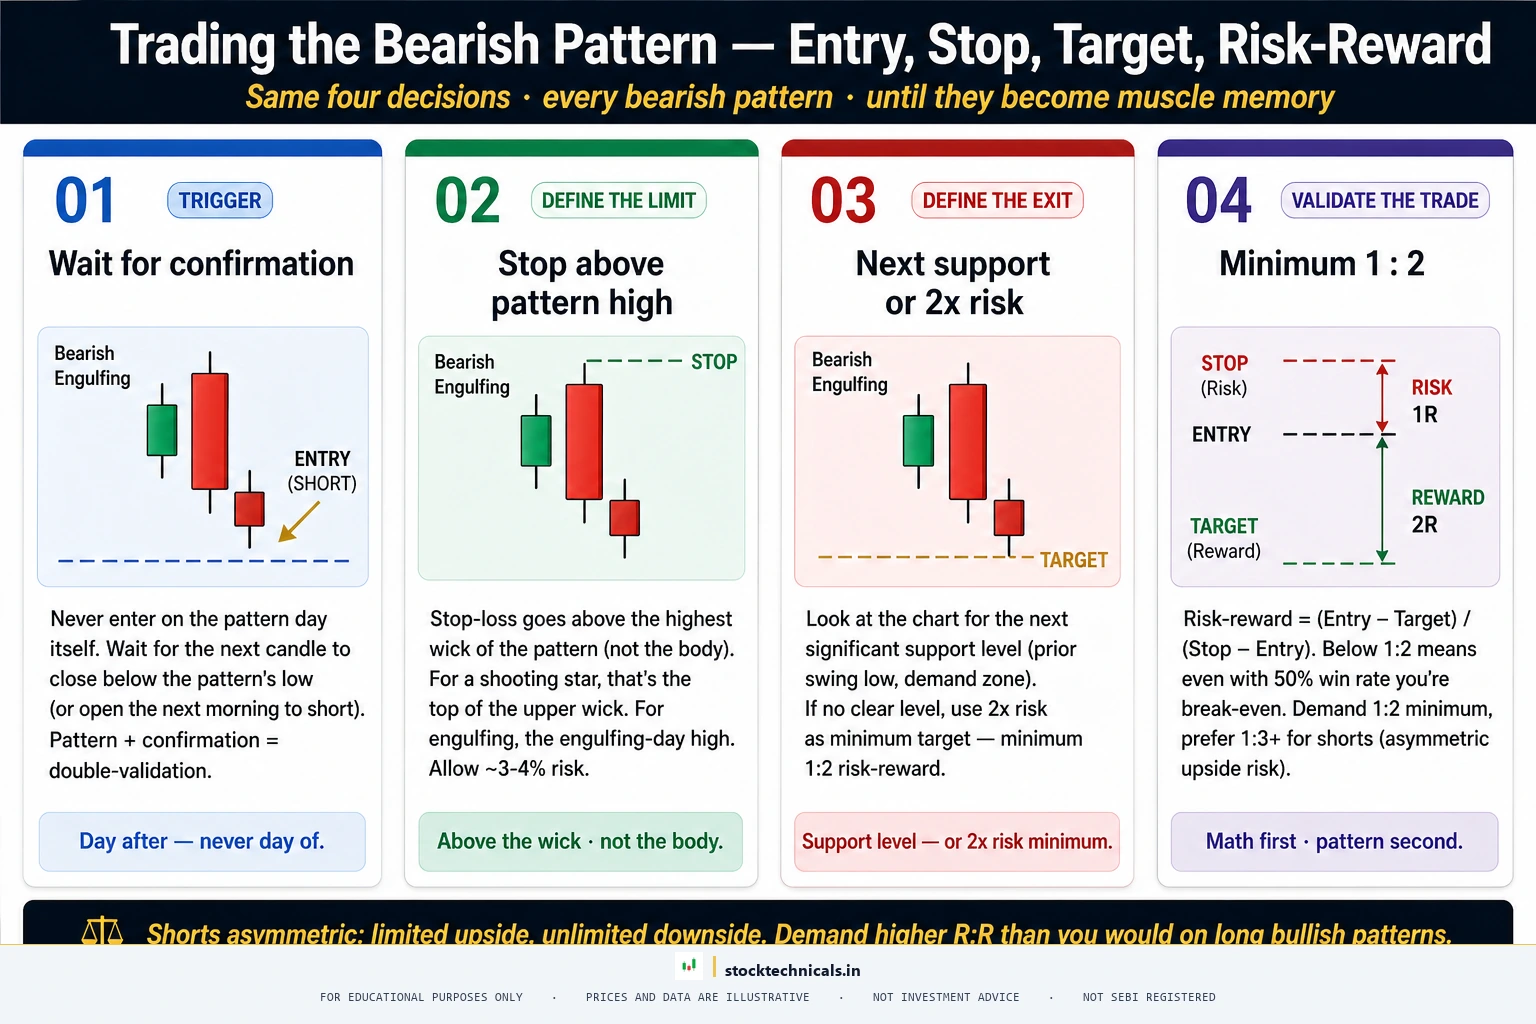
Recognising a pattern is step one. Trading it requires a structured plan. Here is the framework that applies to all eight patterns above. Note: most traders use bearish patterns to EXIT long positions rather than short them outright — shorting in an established uptrend is harder than simply stepping aside.
Entry
Wait for the NEXT candle after the pattern to open. If it opens below the pattern’s body (ideally below the low for single-candle patterns), confirm with a close below that level. For long exits: close the position at market on confirmation. For short entries: enter at market or wait for a brief bounce to the pattern’s body midpoint. Never short on the same day the pattern forms — the close has not yet confirmed the seller takeover.
Stop-Loss
Stop-loss goes ABOVE the pattern’s highest point — not above the body, above the wick. For SHOOTING STAR and DARK CLOUD COVER, the high is the actual pattern high. For EVENING STAR, the high is the highest of the three candles (usually C1 or C2). For BEARISH ENGULFING, it is the high of the red engulfing candle. The stop must be above the actual visible top of the structure.
Target
First target is the next visible support level on the chart. Second target is twice the risk distance (the stop-loss distance projected downward from entry). For most bearish patterns, a 5–8 percent move in the following 5–10 sessions is realistic when the pattern is on heavy volume at a known resistance level.
Risk-Reward
Minimum acceptable risk-reward is 1:2. If the distance from entry to target is less than 2x the distance from entry to stop, skip the trade. The pattern may still work, but the math does not justify the risk. Shorts carry asymmetric risk — the upside is capped at 100 percent while the stop-out can be unlimited — so discipline matters more on the short side than the long side.
Where Bearish Patterns Work Best
All eight patterns share a critical requirement: they must form at the TOP of an uptrend, ideally at a known resistance level. The patterns themselves are pattern-recognition shortcuts — the real edge comes from the location.
- At resistance levels — the most reliable location. Sellers defending a known ceiling adds conviction.
- At a trendline resistance — the second-most reliable. Confluence of trend and pattern.
- After euphoric volume spikes — a sharp rally on heavy volume followed by a bearish pattern is the classic distribution setup.
- At Fibonacci retracement levels (38.2%, 50%, 61.8%) during downtrend retracements — add another layer of confluence.
- At all-time highs — like the Power Grid hanging man above. No overhead supply means the only way to fail is if buyers lose conviction, which is exactly what the pattern signals.
- NOT in the middle of a downtrend — a SHOOTING STAR 30 percent into a downtrend is just a normal candle. The reversal premise requires an uptrend.
Interactive Tool: Bearish Pattern Identifier
Practice identifying bearish patterns from real OHLC data with this interactive tool. Six NSE examples cycle through, and a 5-question quiz tests your understanding.
Interactive Tool: Bearish Pattern Identifier
Practice spotting bearish reversal patterns from real NSE OHLC data
The Bottom Line
Bearish candlestick patterns are not trade signals on their own. They are clues that the buyer-seller balance is shifting at the top of an uptrend. The pattern shape captures one moment in time. The location, prior trend, and volume decide whether the moment is meaningful or just noise.
The eight patterns above cover almost every bearish reversal scenario a beginner will encounter. BEARISH ENGULFING, EVENING STAR, and THREE BLACK CROWS are the high-conviction signals — when they appear with heavy volume at resistance, follow-through is likely. SHOOTING STAR, DARK CLOUD COVER, and TWEEZER TOP are moderate — they work, but they need volume to be trusted. HANGING MAN and BEARISH HARAMI are weaker — always wait for next-day red confirmation before acting.
Memorise the eight patterns. Recognise them on live charts. But never trade them without the three filters: location, volume, and confirmation. Tops take longer to form than bottoms — patience on the exit is rewarded. Pattern recognition is the easy part. Pattern selection is what separates beginners from traders.
| Pattern | Body type | Best location | Reliability |
|---|---|---|---|
| Bearish Engulfing | Large red over green | After uptrend at resistance | High |
| Shooting Star | Small body, long upper wick | Top of rally | Medium-High |
| Evening Star | 3-candle reversal | End of uptrend | High |
| Dark Cloud Cover | Red closes >50% into green | Resistance level after rally | Medium |
| Three Black Crows | Three large red in row | End of bullish leg | Medium-High |
“Bottoms in the investment world don't end with four-year lows. They end with 10- or 15-year lows.”
— Jim Rogers, Investment Biker
Which is the most reliable bearish candlestick pattern?
Bearish Engulfing and Evening Star are the most reliable, especially when they form at a known resistance level with volume above 1.5 times the 20-day average. The Bearish Engulfing in Hindustan Unilever on February 12, 2026 produced a 5.41 percent drop in five sessions on 3.31x volume — a typical outcome for high-conviction engulfing patterns at overbought levels.
How is a Shooting Star different from a Hanging Man?
Both form at the top of an uptrend and both have a small body, but the wick direction is opposite. A Shooting Star has a long upper wick (buyers pushed up, sellers rejected). A Hanging Man has a long lower wick (sellers dipped, buyers recovered). Shooting Star is moderately reliable on its own; Hanging Man always requires next-day red confirmation because it looks identical to a bullish hammer — only the location tells them apart.
Do bearish candlestick patterns always work?
No. Patterns are probability tools, not certainties. Even textbook setups fail when location is wrong, volume is light, or the broader trend overwhelms the reversal. The Three Black Crows in Tata Steel on 13-November 17, 2025 showed shrinking bodies through the pattern — a warning that the decline was exhausting. The actual follow-through was only 4.51 percent, modest by pattern standards. Always use stop-losses above the pattern high.
What volume confirms a bearish reversal pattern?
Volume on the signal day should be at least 1.5 times the 20-day average. Below 0.8 times average means the reversal lacks conviction and the pattern likely fails. Between 0.8 and 1.5 times average is acceptable but requires next-day confirmation. Light-volume tops are the most common failed bearish signals — distribution requires participation to be meaningful.
Can a Shooting Star appear in the middle of a downtrend?
Geometrically yes, but it has no predictive value there. A Shooting Star is a REVERSAL signal, which requires a prior uptrend to reverse. In the middle of a downtrend, the same shape is just a normal candle with a tactical wick rejection. Always check the prior 3-5 sessions for a real rally before treating any candle as a shooting star.
What is the difference between Bearish Engulfing and Dark Cloud Cover?
Both involve a red candle following a green one after a rally. The difference is penetration depth. A Bearish Engulfing closes BELOW the prior open, completely engulfing the prior body. A Dark Cloud Cover closes BELOW the prior body midpoint but ABOVE the prior open. Engulfing is stronger because the seller takeover is total. Dark Cloud Cover is moderate because it shows rejection without complete dominance.
Where should I place a stop-loss when trading a bearish pattern?
Above the pattern’s highest point — above the wick, not above the body. For Shooting Star and Dark Cloud Cover this is the candle high. For Evening Star this is the highest of the three candles (usually the star or C1 high). For Bearish Engulfing this is the high of the red engulfing candle. The stop must be above the visible top of the entire pattern structure to give the trade room.
Why do tops take longer to form than bottoms?
Bottoms reverse faster because panic selling forces the rotation — once sellers capitulate, the supply evaporates quickly and buyers can push up without resistance. Tops form gradually because euphoria fades slowly — late buyers keep appearing, trickling in long after the smart money has exited. This is why bearish patterns often need 2-3 candles of confirmation while bullish patterns sometimes reverse on a single hammer. Patience on bearish signals is rewarded; impatience is punished with false-top failures.
Related Articles:
- What Are Candlestick Charts?
- Anatomy of a Candlestick
- Bullish Candlestick Patterns
- Doji Candle Explained
- Hammer and Hanging Man Pattern
- Engulfing Patterns Detailed look
- Morning Star and Evening Star
- Support and Resistance
- Volume in Trading
- What is a Trend?
A bearish reversal pattern is only as good as the follow-through. Without the next candle confirming, it is just a shadow. Per the SEBI FY24-25 study, 91 percent of individual equity F&O traders lost money.