
Most traders chase patterns. Profitable traders read what the patterns mean. There is a difference.
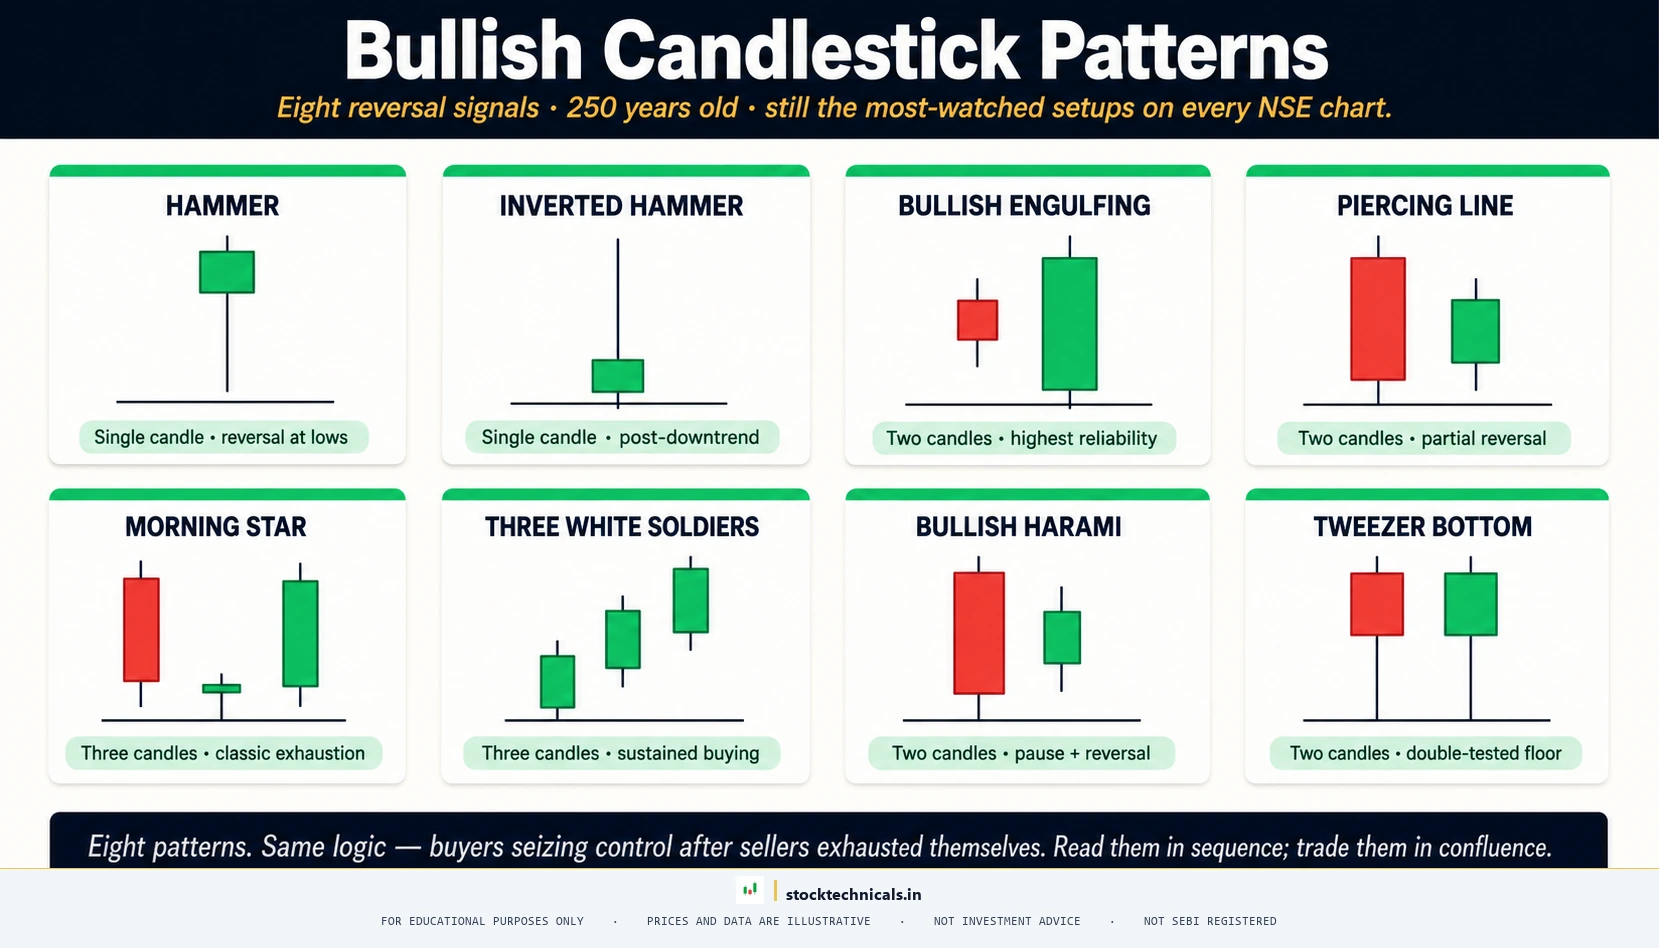
Quick Answer: Bullish candlestick patterns appear at the end of a downtrend and signal that selling pressure is exhausting and buyers are stepping in. The eight most reliable are hammer, inverted hammer, bullish engulfing, piercing line, morning star, three white soldiers, bullish harami, and tweezer bottom. The pattern alone is only a clue — location, prior trend, volume, and follow-through decide whether it becomes a tradeable reversal on NSE stocks like Reliance, Tata Steel, or HDFC Bank.
Published January 18, 2026 · Last refreshed April 27, 2026. Prices and data are compiled with reasonable care — always confirm against your broker before trading.
BULLISH CANDLESTICK PATTERNS appear at the end of a downtrend and signal that selling pressure is exhausting. Buyers are stepping in. The trend may be about to reverse. But the pattern alone is just a clue — the context (location, prior trend, volume, follow-through) decides whether the clue becomes a trade.
This article walks through the eight most reliable bullish reversal patterns, each with a real NSE example verified against real NSE price action to two decimal places. Every chart shows 80–100 days of daily candles so traders can see the full context, not just the pattern in isolation. Every example includes the prior trend, volume confirmation, and the actual outcome over the next five trading sessions.
Key Takeaways
- Bullish patterns only matter at the END of a downtrend — not in the middle of an uptrend
- BULLISH ENGULFING and MORNING STAR are the highest-reliability single-candle and three-candle patterns
- HAMMER, PIERCING LINE, TWEEZER BOTTOM are moderate — they require volume above 1.5x the 20-day average to be trusted
- INVERTED HAMMER and BULLISH HARAMI are weaker signals — always need next-day confirmation
- Volume below 0.8x the 20-day average means the pattern likely fails — treat it as a warning, not a buy signal
- The same pattern in the wrong location is meaningless — a HAMMER in the middle of an uptrend has no predictive value
- Always wait for the NEXT candle to confirm the pattern before entering. Stop-loss goes below the pattern low.
- Three of the patterns (Morning Star, Three White Soldiers, Bullish Engulfing) often produce 5–10 percent moves in the following five sessions when triggered correctly
Why Bullish Patterns Work (And When They Fail)
A bullish reversal pattern is the visible footprint of a battle inside the candle. Sellers were in control. Then buyers arrived. The pattern shape captures the moment buyers seized the upper hand. Whether that moment turns into a sustainable rally depends on three filters every experienced trader checks before entering:
- Location — the pattern must form at the end of a real downtrend (3+ red candles or a multi-week decline). Patterns in the middle of an uptrend are noise.
- Volume — reversal patterns need conviction. Volume on the signal day should ideally be 1.5x or more the 20-day average. Light volume = weak pattern.
- Confirmation — the next candle should hold above the pattern low, ideally close higher. Without confirmation, the pattern can fail and turn into a continuation.
Without all three filters, even a textbook pattern can fail. The eight patterns below all met these criteria in the verified examples shown.
Hammer
The HAMMER is the single most recognisable bullish reversal pattern. It forms at the end of a downtrend, signalling that sellers pushed prices to new lows during the session but buyers stepped in aggressively and recovered most of the loss before the close.
How to identify a Hammer
- Small body at the TOP of the candle range (any colour, but green is stronger)
- Long lower wick at least 2x the body size (often 3–5x)
- Almost no upper wick
- Forms after a clear 3-day or longer decline
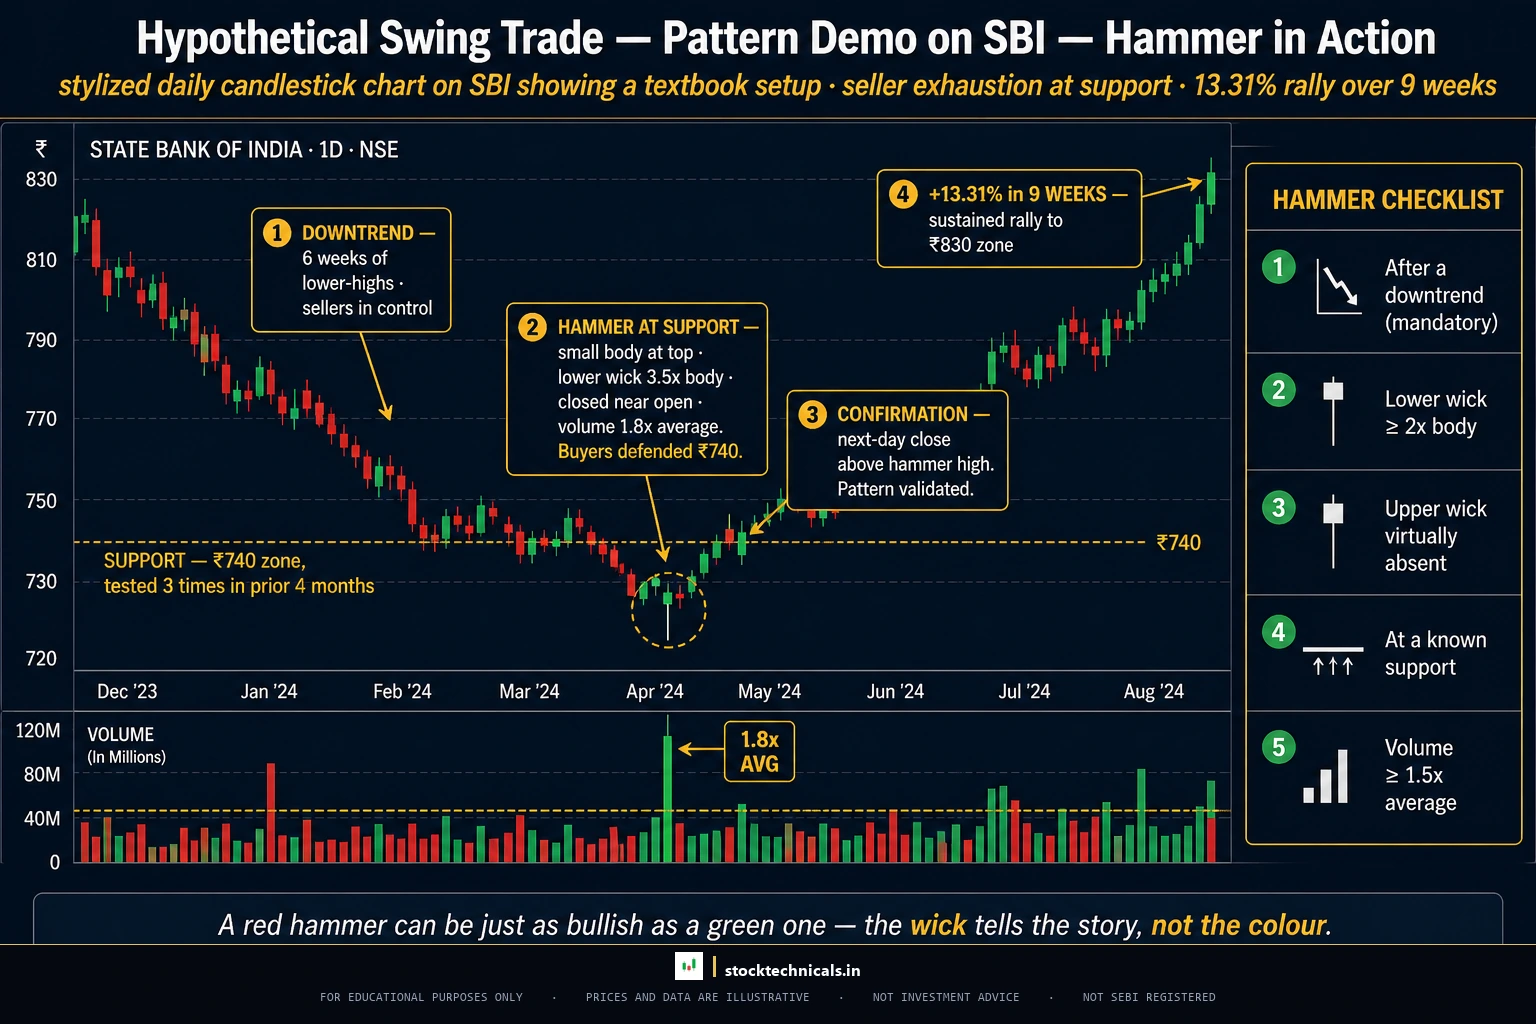
Example: SBI (NSE: SBIN) on February 18, 2025 printed a textbook HAMMER at the bottom of a clear 4-day decline. The lower wick covered 77.5% of the total range — sellers pushed the stock to a fresh low but buyers recovered every rupee by the close. The small body sat at the top of the candle with virtually no upper wick. Prior context: a 4.30% decline over the previous 15 trading sessions with 7 of 10 days closing lower. The HAMMER marked the structural bottom.
What happened next: Over the next 9 weeks, SBI rallied to Rs 822.40 — a +13.31% gain with 35 of 40 trading days closing higher (87.5% positive). This is a sustained reversal: not a 3-day bounce that fails, but a structural shift in trend that delivered for swing traders who held with conviction.
Common Hammer mistakes
- Trading hammers in the middle of an uptrend (no reversal possible)
- Ignoring volume — a hammer on light volume is a non-signal
- Entering before the next candle confirms (skipping confirmation)
- Setting stop-loss above the body instead of below the low
Inverted Hammer
The INVERTED HAMMER is the geometric mirror of the hammer. Same body location at the BOTTOM of the range, but the long wick points UP instead of down. It says: buyers tried to push higher, sellers fought back, but the attempt itself shows demand returning.
How to identify an Inverted Hammer
- Small body at the BOTTOM of the candle range
- Long upper wick at least 2x the body size
- Almost no lower wick (often the open equals the low)
- Forms after a downtrend
- REQUIRES next-day confirmation — weakest of the bullish patterns alone
Example: Reliance Industries on March 4, 2025 produced a textbook INVERTED HAMMER at the bottom of a 7.32% decline. The body was nearly zero (a near-doji at 2.1% of range), the upper wick covered 81.7% of the range, and the lower wick was just 16.3%. Buyers attempted to push higher (the long upper wick), but sellers fought back and forced the close back near the open. This is the classic “tentative reversal warning” — weak signal that needs immediate confirmation. Critically, this candle is the day BEFORE the Bullish Engulfing example shown earlier in this article — the same Reliance reversal cluster.
What happened next: The next five sessions saw a slow grind higher, closing +1.22 percent above the inverted hammer. Confirmation came on day +1 with a +1.18% green close (this is the Bullish Engulfing covered earlier). Over the next 11 weeks, Reliance rallied 25.35% to Rs 1,456.40 — every single one of the next 60 trading sessions closed above the inverted hammer’s low. When an Inverted Hammer is confirmed by the next-day candle and forms part of a 2-candle reversal cluster (as here), it can mark the structural bottom.

Bullish Engulfing
The BULLISH ENGULFING is the most decisive single-candle reversal signal. A small red candle forms after a decline. The next session opens lower (often gapping down), then buyers take complete control — closing not just above the open, but above the entire prior red candle’s body. The visual is unmistakable: a big green candle wrapping its tiny red predecessor.
How to identify a Bullish Engulfing
- Prior candle is RED (any size, but smaller relative to the green is stronger)
- Current candle is GREEN with a body that completely engulfs the prior red body
- Current open is below prior close (often gap down)
- Current close is above prior open
- Forms after a downtrend
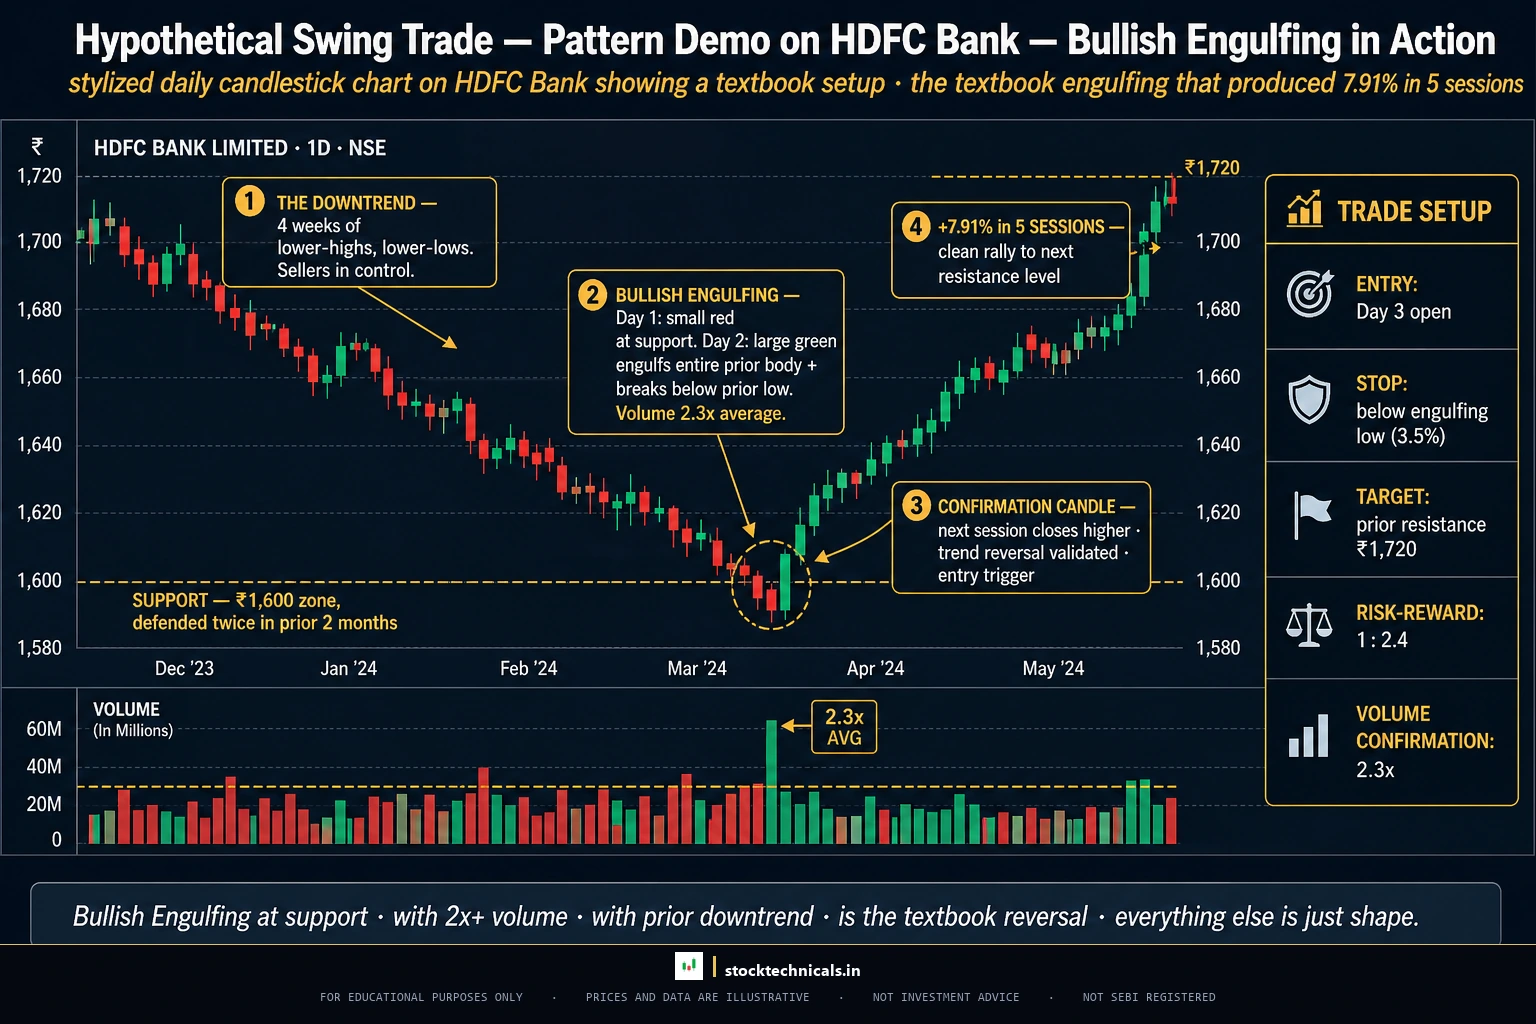
Example: Reliance Industries on March 5, 2025 produced a textbook BULLISH ENGULFING after a clear downtrend. The prior 20 trading days had declined 9.59% from Rs 1,285.20 to Rs 1,161.90 in a clean staircase pattern. On 5 March, Reliance opened at Rs 1,161.00 (below the prior close), then rallied to close at Rs 1,175.60. The green body engulfed the prior small red body. Day +1 confirmed with +2.89%, day +2 with +3.32%.
What happened next: The reversal sustained for 11 weeks. By May 5, 2025, Reliance closed at Rs 1,431.30 — a +21.75% rally with 39 of 40 trading days closing higher. This is what a sustained downtrend-to-uptrend reversal looks like — not a 5-day bounce, but a structural change in trend. Textbook follow-through.
Piercing Line
The PIERCING LINE is the bullish engulfing’s less ambitious cousin. The green candle does not fully engulf the prior red body — it just pierces the midpoint, closing above the 50% mark of the red candle. Less decisive than engulfing, but still a clean reversal signal when it appears at oversold conditions on heavy volume.
How to identify a Piercing Line
- Prior candle is a strong RED with body covering more than 50% of its range
- Current candle opens BELOW the prior low (gap down)
- Current candle closes ABOVE the prior body midpoint (more than 50% penetration)
- Current candle does NOT fully engulf the prior body (otherwise it is engulfing)
- Forms after a downtrend
Example: Tata Steel on February 12, 2025. The prior day (11 February) was a strong red: Open Rs 133.00, Close Rs 130.11, body Rs 2.89 covering 62.3% of its range. On 12 February, Tata Steel gapped down to Open Rs 129.35 (below the prior low of Rs 129.70), then rallied to Close Rs 132.28. The prior body midpoint was Rs 131.555. The close at Rs 132.28 was 75.1 percent into the prior red body — well above the 50% threshold required for a piercing line. Volume was 1.41x the 20-day average — heavy enough to trust.
What happened next: Five sessions later, Tata Steel closed at Rs 135.76 (+2.63 percent), with intraday high reaching Rs 139.25 (+5.27 percent). The piercing line held.

Morning Star
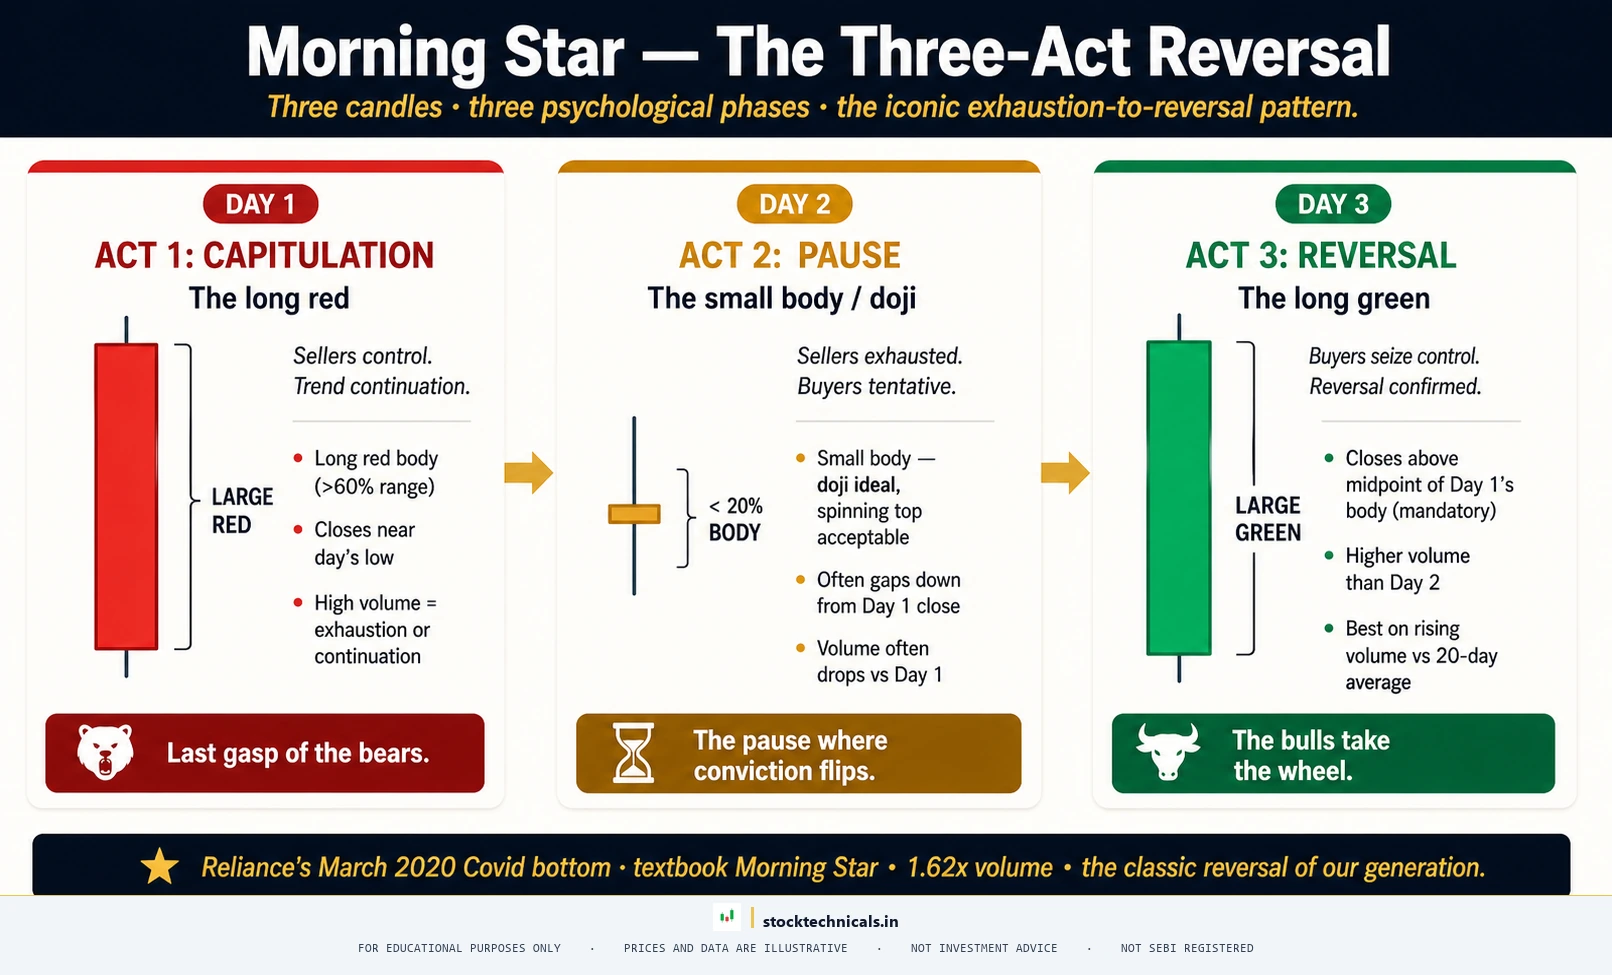
The MORNING STAR is a three-candle pattern — and the closest thing to a textbook bottom signal in candlestick analysis. The first candle is a long red body extending the downtrend. The second is a small body (ideally a doji) often gapping down, showing seller exhaustion. The third is a long green candle that closes above the midpoint of the first red. The visual is a star-shaped pause between two pillars, marking the moment the trend turns.
How to identify a Morning Star
- Candle 1: Long RED body, more than 50% of range, extending the downtrend
- Candle 2: Small body (doji or near-doji), ideally gaps down from C1
- Candle 3: Long GREEN body, more than 50% of range, closes above C1 midpoint
- Forms after a sustained downtrend
- Volume on C3 should be heavy (1.5x+ average)
Example: Reliance Industries 18–March 20, 2020 — the iconic Covid market bottom. Candle 1 (18 March): Open Rs 505.95, Close Rs 477.92, body Rs 28.03 (75.8% of range) — a violent red candle in the middle of the Covid crash. Candle 2 (19 March): Open Rs 454.04, Close Rs 452.85, body just Rs 1.19 (3.2% of range) — essentially a doji, gapping down from C1. Candle 3 (20 March): Open Rs 463.61, Close Rs 502.32, body Rs 38.71 (74.8% of range) — a massive green candle. The C1 midpoint was Rs 491.94. The C3 close at Rs 502.32 was 2.11 percent above the midpoint — textbook morning star geometry. Volume on the reversal day was 1.62x the 20-day average — panic-capitulation-reversal volume.
What happened next: The next five sessions saw extreme volatility (this was Covid). Day 5 closed at Rs 525.84 (+4.68 percent). The intraday high reached Rs 568.25 (+13.13 percent) before a retest. The morning star marked the structural low. From this point, Reliance went on a 12-month rally.
Three White Soldiers
THREE WHITE SOLDIERS is a three-candle continuation-and-reversal pattern. Three consecutive long green candles, each closing higher than the last, each opening within the prior body. It signals that buyers have taken control with persistent strength. But it has a hidden trap: by the time the third soldier prints, much of the easy move is already banked. Late entries often get caught.
How to identify Three White Soldiers
- Three consecutive GREEN candles
- Each body covers more than 50% of its range
- Each close is HIGHER than the prior close
- Each open is within (not above) the prior body
- Small upper wicks (less than 18% of body)
Example: Infosys 24–July 28, 2020. Candle 1 (24 July): Open Rs 903.25, Close Rs 922.85 (body 87.1% of range, no lower wick). Candle 2 (27 July): Open Rs 921.55 (within C1 body), Close Rs 948.45 (body 78.8%). Candle 3 (28 July): Open Rs 946.00 (within C2 body), Close Rs 962.85 (body 63.9%). Total 3-day gain: +6.60 percent. All three candles had small upper wicks — the buyers held their gains.
What happened next: This is the cautionary tale. The next five sessions saw the close drift LOWER to Rs 949.85 (-1.35 percent). The intraday high reached Rs 986.45 (+2.45 percent) before reversing. The pattern itself was structurally perfect, but the three-day move had already captured most of the short-term upside. THREE WHITE SOLDIERS works better as a continuation confirmation than as a late-entry signal.

Bullish Harami
The BULLISH HARAMI is the quietest reversal signal. Where engulfing screams, harami whispers. A long red candle is followed by a tiny green candle whose body sits entirely INSIDE the prior red body. The compression suggests sellers have run out of conviction — they could not even push prices below the prior open. It is a setup for change, not change itself. Confirmation matters more here than for any other pattern.
How to identify a Bullish Harami
- Prior candle is a strong RED body
- Current candle is GREEN with body completely INSIDE the prior red body
- Current open is above prior close
- Current close is below prior open
- Body ratio: prior body should be at least 5x the current body
- Forms after a downtrend
Example: Tata Steel February 29, 2024. The prior day (28 February) was a strong red: Open Rs 144.05, Close Rs 140.75, body Rs 3.30 (67.3% of range). On 29 February, Tata Steel opened at Rs 140.80 and closed at Rs 140.85 — a body of just Rs 0.05 (essentially a doji), 66 times smaller than the prior body. The tiny green body sat inside the prior red body completely. Volume was light at 0.80x average — the harami was a pause in selling, not a buying surge.
What happened next: The next five sessions saw Tata Steel rally to Rs 151.60 (+7.63 percent), with intraday high reaching Rs 156.20 (+10.90 percent). The harami’s low was never breached. The whisper turned into a shout.

Tweezer Bottom
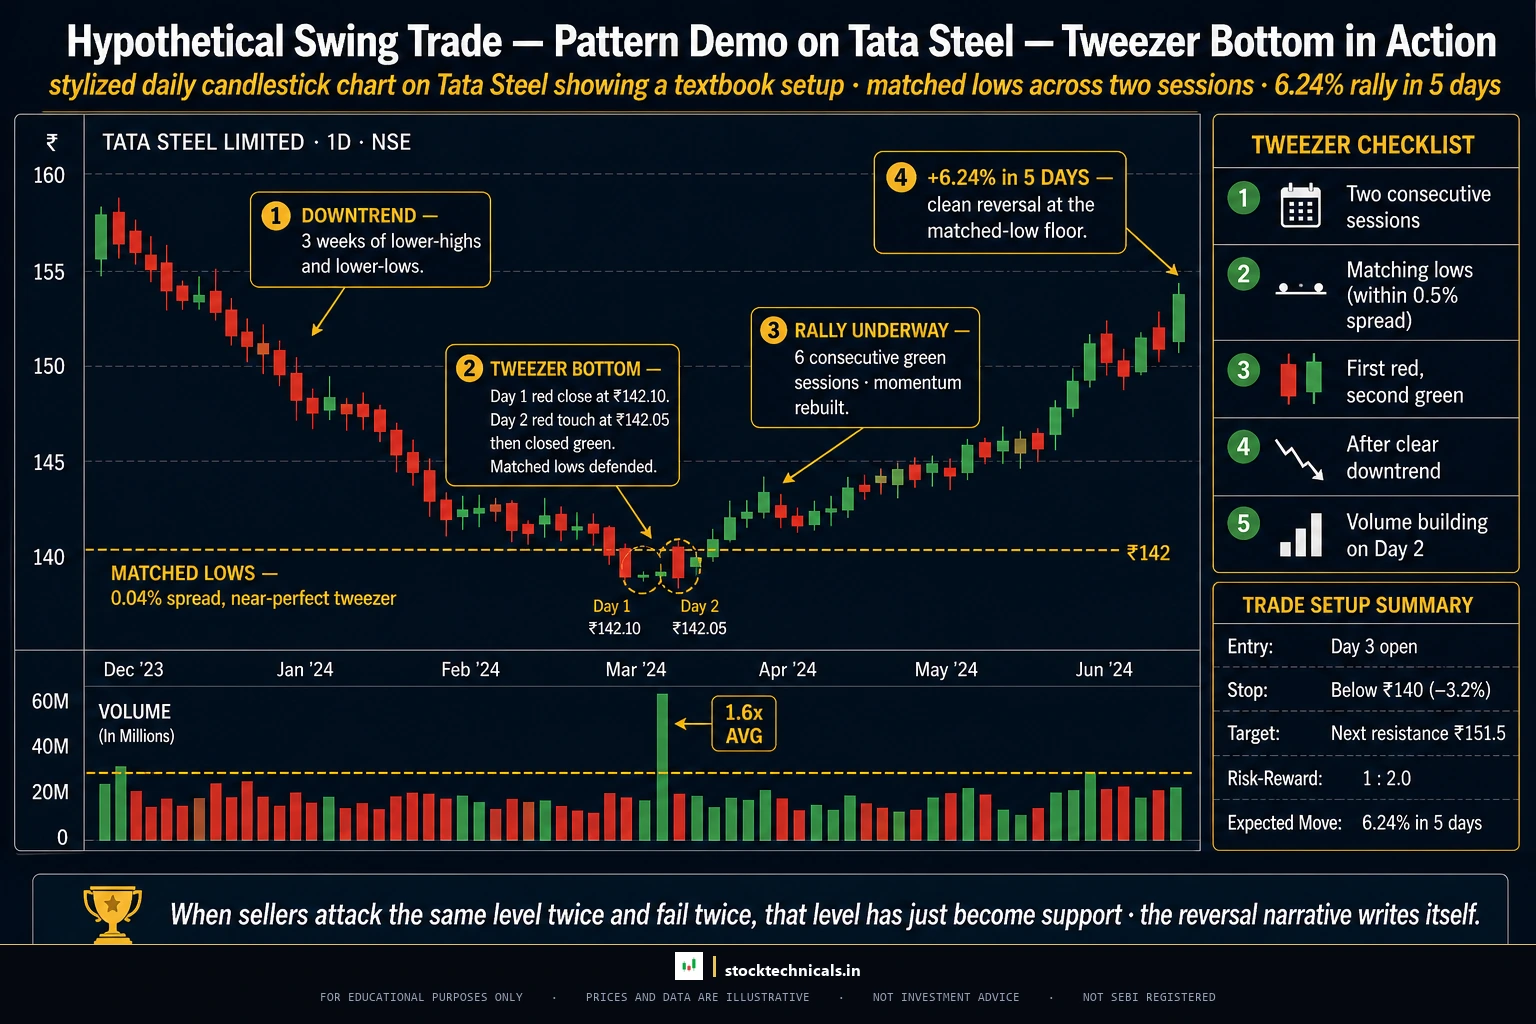
The TWEEZER BOTTOM is the simplest of the bullish patterns to spot — two consecutive candles with the same Low. The first is red, extending the decline. The second is green, defending the same floor. The matched lows show that buyers held the line at exactly the same price level on two consecutive sessions — a clear demand zone.
How to identify a Tweezer Bottom
- Two consecutive candles where the lows match within 0.5 percent
- Prior candle is RED, current is GREEN
- Both candles have meaningful bodies (the lows are real, not just wick rejections)
- Forms after a downtrend
- Best when at a known support level
Example: Tata Steel 19–June 20, 2025. The prior day (19 June) was a small red: Open Rs 152.00, Low Rs 150.50, Close Rs 151.00. The next day (20 June) opened at Rs 150.75 and printed a Low of Rs 150.63 — just Rs 0.13 above the prior low (a difference of 0.086 percent). It then closed Rs 151.97, green. Both candles had bodies above 48 percent of their range — these were real candles, not wick rejections. Volume on the second day was 1.32x the 20-day average. The setup formed after three consecutive red days.
What happened next: Five consecutive green days followed. Day 5 closed at Rs 161.45 (+6.24 percent). The intraday low never broke below Rs 150.48 — essentially the tweezer low itself. A clean rally off the matched floor.
Pattern Reliability and Volume Confirmation
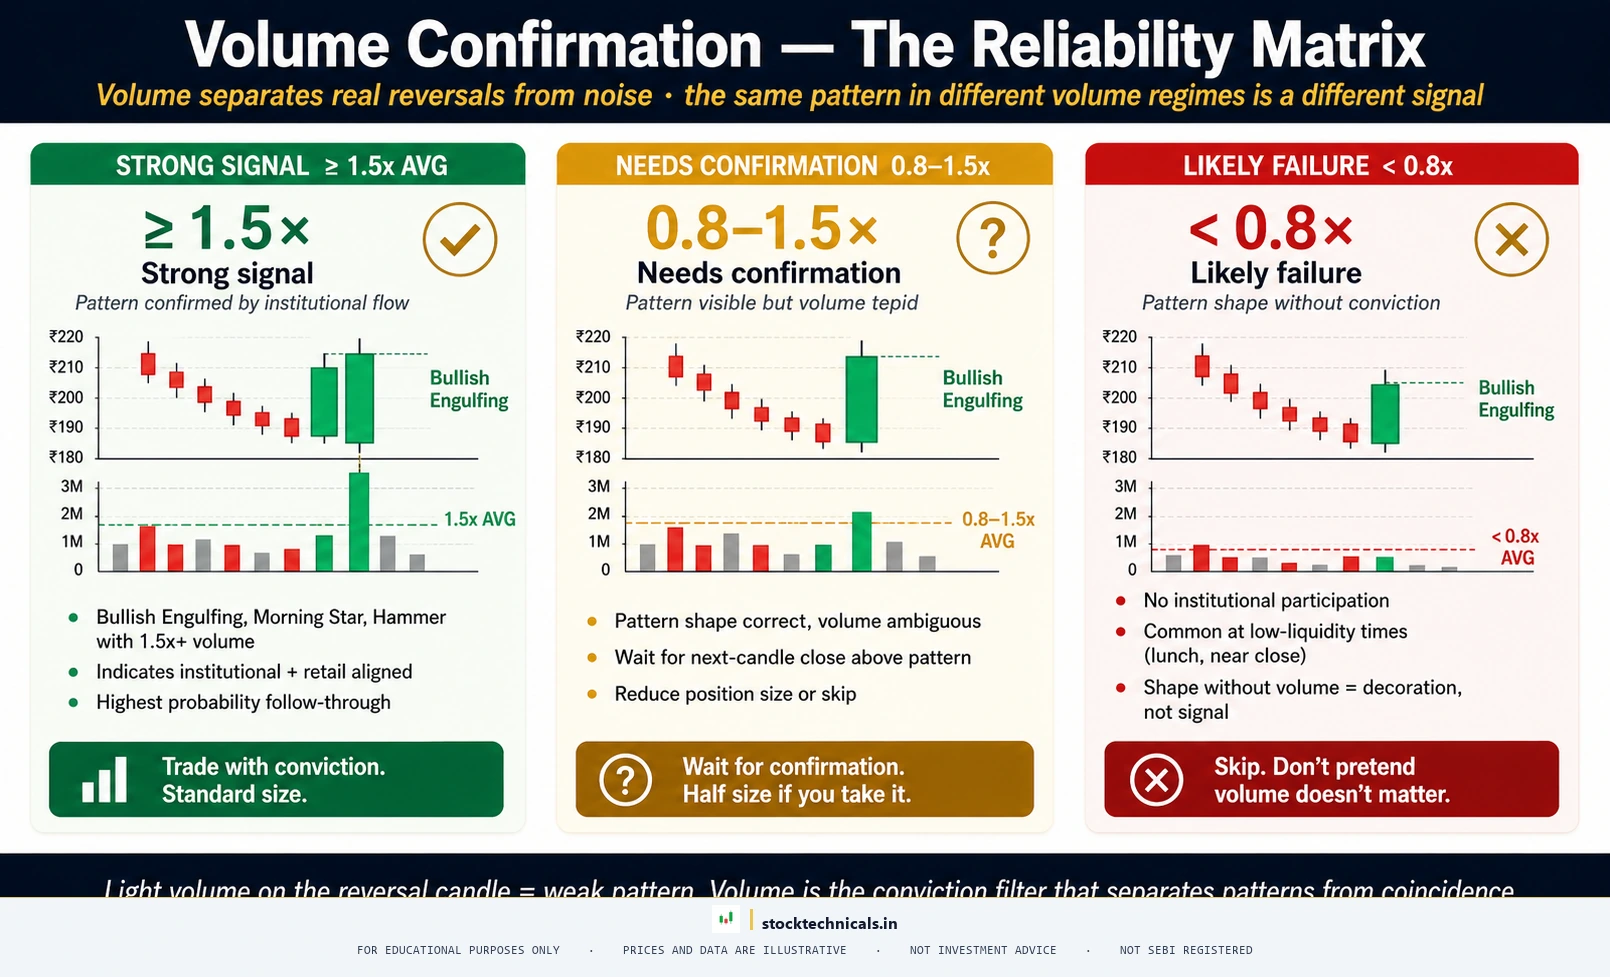
Not all bullish patterns are equal. Some work alone in the right context. Others need volume confirmation to be trusted. The following matrix shows where each pattern sits on the reliability spectrum:
Three rules apply across all patterns:
- Volume above 1.5x the 20-day average = strong confirmation. Trust the pattern.
- Volume between 0.8x and 1.5x = average conviction. Wait for next-day confirmation.
- Volume below 0.8x = treat the pattern as failed. Light volume reversals rarely follow through.
Trading the Patterns: Entry, Stop-Loss, Target
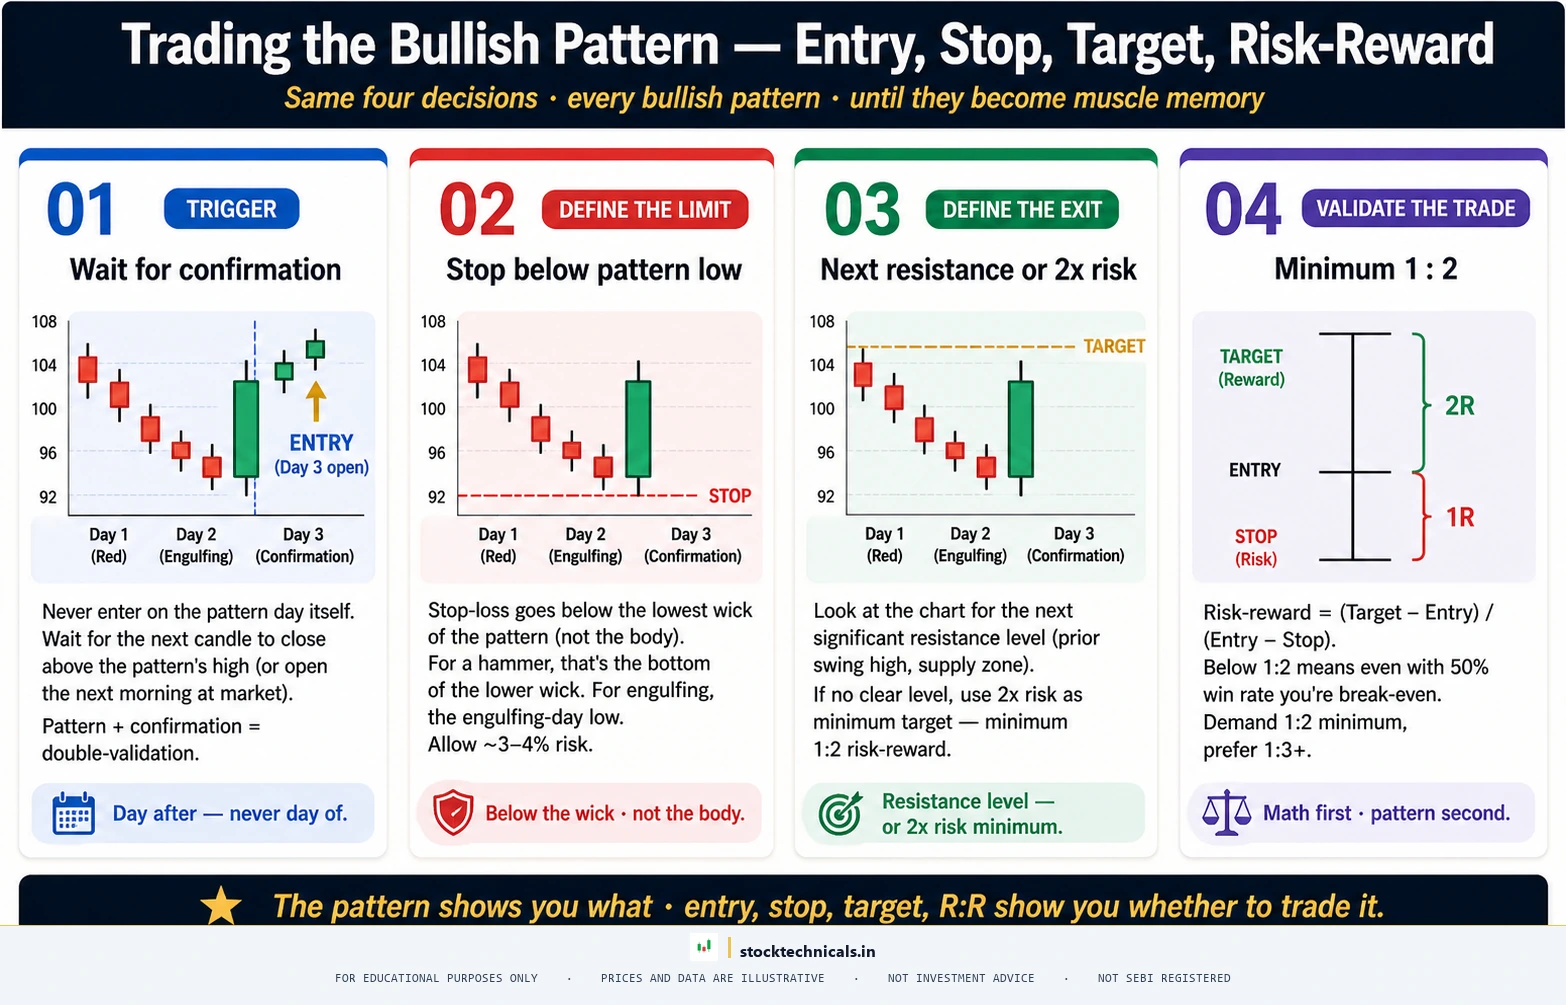
Recognising a pattern is step one. Trading it requires a structured plan. Here is the framework that applies to all eight patterns above:
Entry
Wait for the NEXT candle after the pattern to open. If it opens above the pattern’s high, enter at market or wait for a brief pullback to the pattern’s body midpoint. Never enter on the same day the pattern forms — the close has not yet confirmed the buyer takeover.
Stop-Loss
Stop-loss goes BELOW the pattern’s lowest point — not below the body, below the wick. For HAMMER and PIERCING LINE, the low is the actual pattern low. For MORNING STAR, the low is the lowest of the three candles (usually C2). For BULLISH ENGULFING, it is the low of the green engulfing candle. The stop must be below the actual visible bottom of the structure.
Target
First target is the next visible resistance level on the chart. Second target is twice the risk distance (the stop-loss distance projected upward from entry). For most bullish patterns, a 5–10 percent move in the following 5–10 sessions is realistic when the pattern is on heavy volume at a known support level.
Risk-Reward
Minimum acceptable risk-reward is 1:2. If the distance from entry to target is less than 2x the distance from entry to stop, skip the trade. The pattern may still work, but the math does not justify the risk.
Where These Patterns Work Best
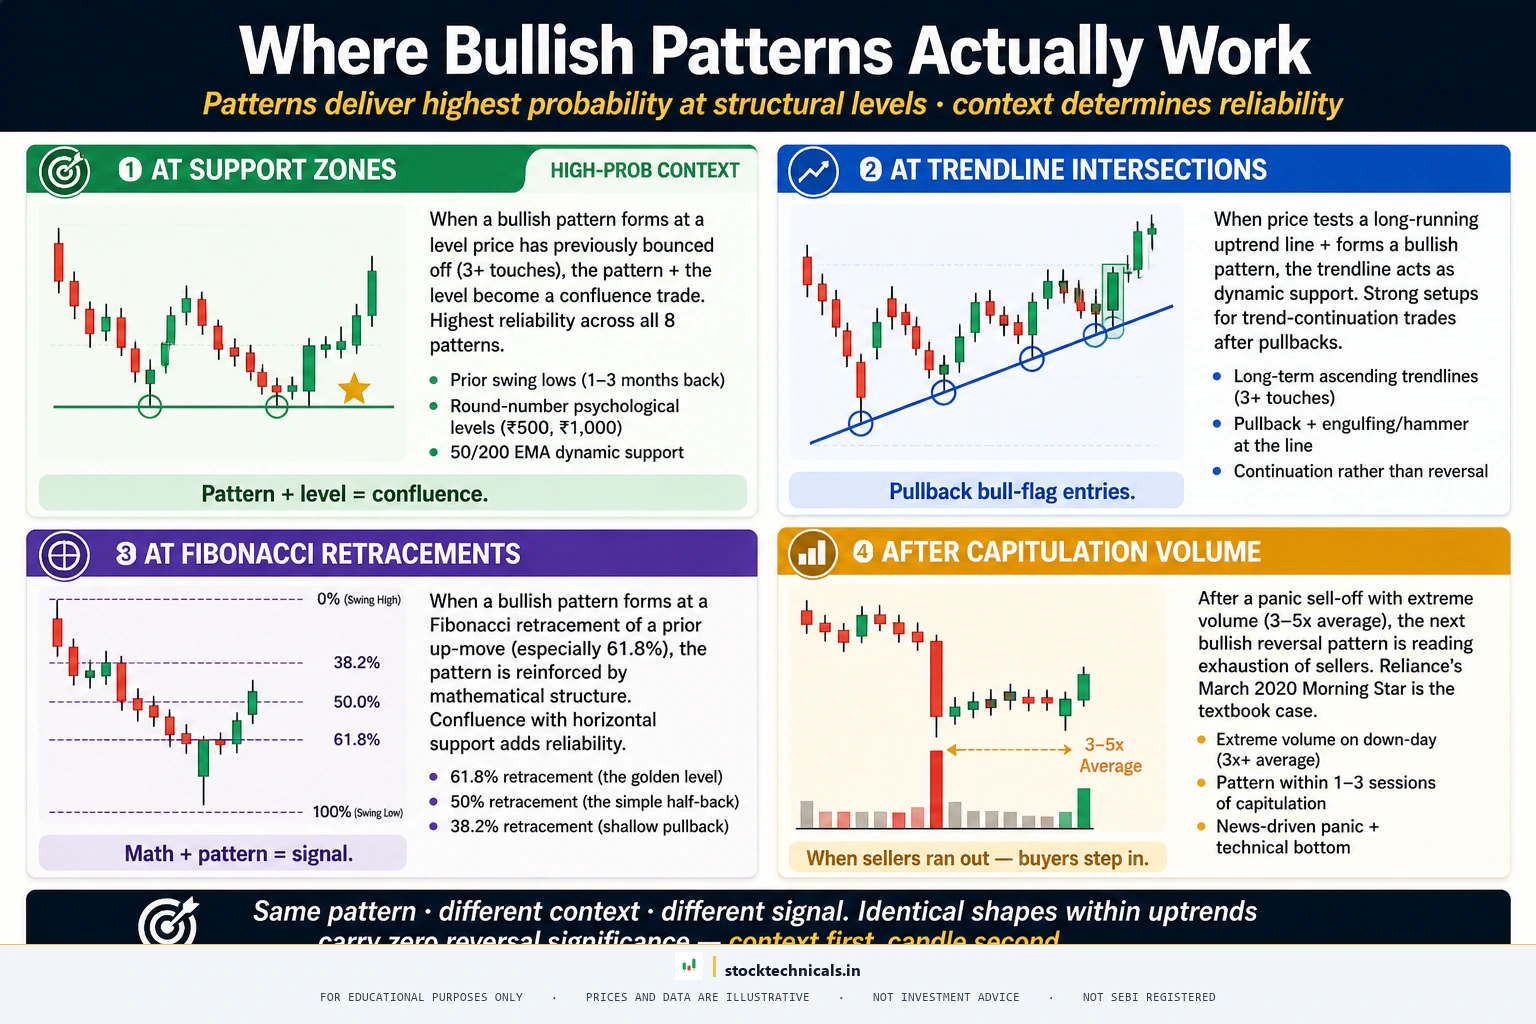
All eight patterns share a critical requirement: they must form at the END of a downtrend, ideally at a known support level. The patterns themselves are pattern-recognition shortcuts — the real edge comes from the location.
- At support levels — the most reliable location. Buyers defending a known floor adds conviction.
- At a trendline support — the second-most reliable. Confluence of trend and pattern.
- After capitulation volume — a sharp decline on heavy volume followed by a bullish pattern is the classic exhaustion setup.
- At Fibonacci retracement levels (38.2%, 50%, 61.8%) — add another layer of confluence.
- NOT in the middle of an uptrend — a HAMMER 30 percent into an uptrend is just a normal candle. The reversal premise requires a downtrend.
Interactive Tool: Bullish Pattern Identifier
Practice identifying bullish patterns from real OHLC data with this interactive tool. Six verified examples cycle through, and a 5-question quiz tests your understanding.
Interactive Tool: Bullish Pattern Identifier
Practice spotting bullish reversal patterns from real NSE OHLC data
The Bottom Line
Bullish candlestick patterns are not trade signals on their own. They are clues that the buyer-seller balance is shifting. The pattern shape captures one moment in time. The location, prior trend, and volume decide whether the moment is meaningful or just noise.
The eight patterns above cover almost every bullish reversal scenario a beginner will encounter. BULLISH ENGULFING, MORNING STAR, and THREE WHITE SOLDIERS are the high-conviction signals — when they appear with heavy volume at support, follow-through is likely. HAMMER, PIERCING LINE, and TWEEZER BOTTOM are moderate — they work, but they need volume to be trusted. INVERTED HAMMER and BULLISH HARAMI are weaker — always wait for next-day confirmation.
Memorise the eight patterns. Recognise them on live charts. But never trade them without the three filters: location, volume, and confirmation. Pattern recognition is the easy part. Pattern selection is what separates beginners from traders.
| Pattern | Body type | Best location | Reliability |
|---|---|---|---|
| Bullish Engulfing | Large green over red | After downtrend at support | High |
| Hammer | Small body, long lower wick | Bottom of pullback | Medium-High |
| Morning Star | 3-candle reversal | End of downtrend | High |
| Piercing Line | Green closes >50% into red | Support level after decline | Medium |
| Three White Soldiers | Three large green in row | End of correction | Medium-High |
Which is the most reliable bullish candlestick pattern?
Bullish Engulfing and Morning Star are the most reliable, especially when they form at a known support level with volume above 1.5 times the 20-day average. The Bullish Engulfing in HDFC Bank on April 2, 2026 produced a 7.91 percent rally in five sessions — a typical outcome for high-conviction engulfing patterns.
How is a Hammer different from an Inverted Hammer?
Both form at the bottom of a downtrend and both have a small body, but the wick direction is opposite. A Hammer has a long lower wick (sellers pushed down, buyers recovered). An Inverted Hammer has a long upper wick (buyers pushed up, sellers fought back temporarily). Hammer is moderately reliable on its own; Inverted Hammer always requires next-day confirmation.
Do bullish candlestick patterns always work?
No. Patterns are probability tools, not certainties. Even textbook setups fail when location is wrong, volume is light, or the broader trend overwhelms the reversal. The Three White Soldiers in Infosys on 24-July 28, 2020 was structurally perfect but the next five sessions drifted lower because the easy move was already banked. Always use stop-losses below the pattern low.
What volume confirms a bullish reversal pattern?
Volume on the signal day should be at least 1.5 times the 20-day average. Below 0.8 times average means the reversal lacks conviction and the pattern likely fails. Between 0.8 and 1.5 times average is acceptable but requires next-day confirmation. Light-volume reversals are the most common failed signals.
Can a Hammer appear in the middle of an uptrend?
Geometrically yes, but it has no predictive value there. A Hammer is a REVERSAL signal, which requires a prior downtrend to reverse. In the middle of an uptrend, the same shape is just a normal candle with a tactical wick rejection. Always check the prior 3-5 sessions for a real decline before treating any candle as a hammer.
What is the difference between Bullish Engulfing and Piercing Line?
Both involve a green candle following a red one after a decline. The difference is penetration depth. A Bullish Engulfing closes ABOVE the prior open, completely engulfing the prior body. A Piercing Line closes ABOVE the prior body midpoint but BELOW the prior open. Engulfing is stronger because the buyer takeover is total. Piercing Line is moderate because it shows recovery without complete dominance.
Where should I place a stop-loss when trading a bullish pattern?
Below the pattern’s lowest point — below the wick, not below the body. For Hammer and Piercing Line this is the candle low. For Morning Star this is the lowest of the three candles (usually the middle doji). For Bullish Engulfing this is the low of the green engulfing candle. The stop must be below the visible bottom of the entire pattern structure to give the trade room.
Related Articles:
- What Are Candlestick Charts?
- Anatomy of a Candlestick
- Bearish Candlestick Patterns
- Doji Candle Explained
- Hammer and Hanging Man Pattern
- Engulfing Patterns Detailed look
- Morning Star and Evening Star
- Support and Resistance
- Volume in Trading
- What is a Trend?
A bullish reversal pattern is a question, not an answer. The next 1-3 candles confirm it or kill it. Per the SEBI FY24-25 study, 91 percent of individual equity F&O traders lost money — most from trading patterns they had not confirmed.