Quick Answer. Chart patterns are multi-session formations — Head and Shoulders, triangles, flags, cup and handle — that repeat across decades and across stocks because they encode predictable phases of accumulation, distribution, and continuation. This topic covers 10 articles with verified NSE examples, unified trade frameworks, and the confluence rules that push pattern win-rates above 70%.
Who this is for. Traders who have finished Beginner Technical Analysis and can read candles. Chart patterns are the next layer up — patterns built from candle sequences over weeks, not sessions.
Topic 3 · Chart Patterns · 10 articles · ~3.5 hours · Last refreshed April 21, 2026. Prices and data are compiled with reasonable care but — always confirm against your broker before trading.
What Chart Patterns Actually Are
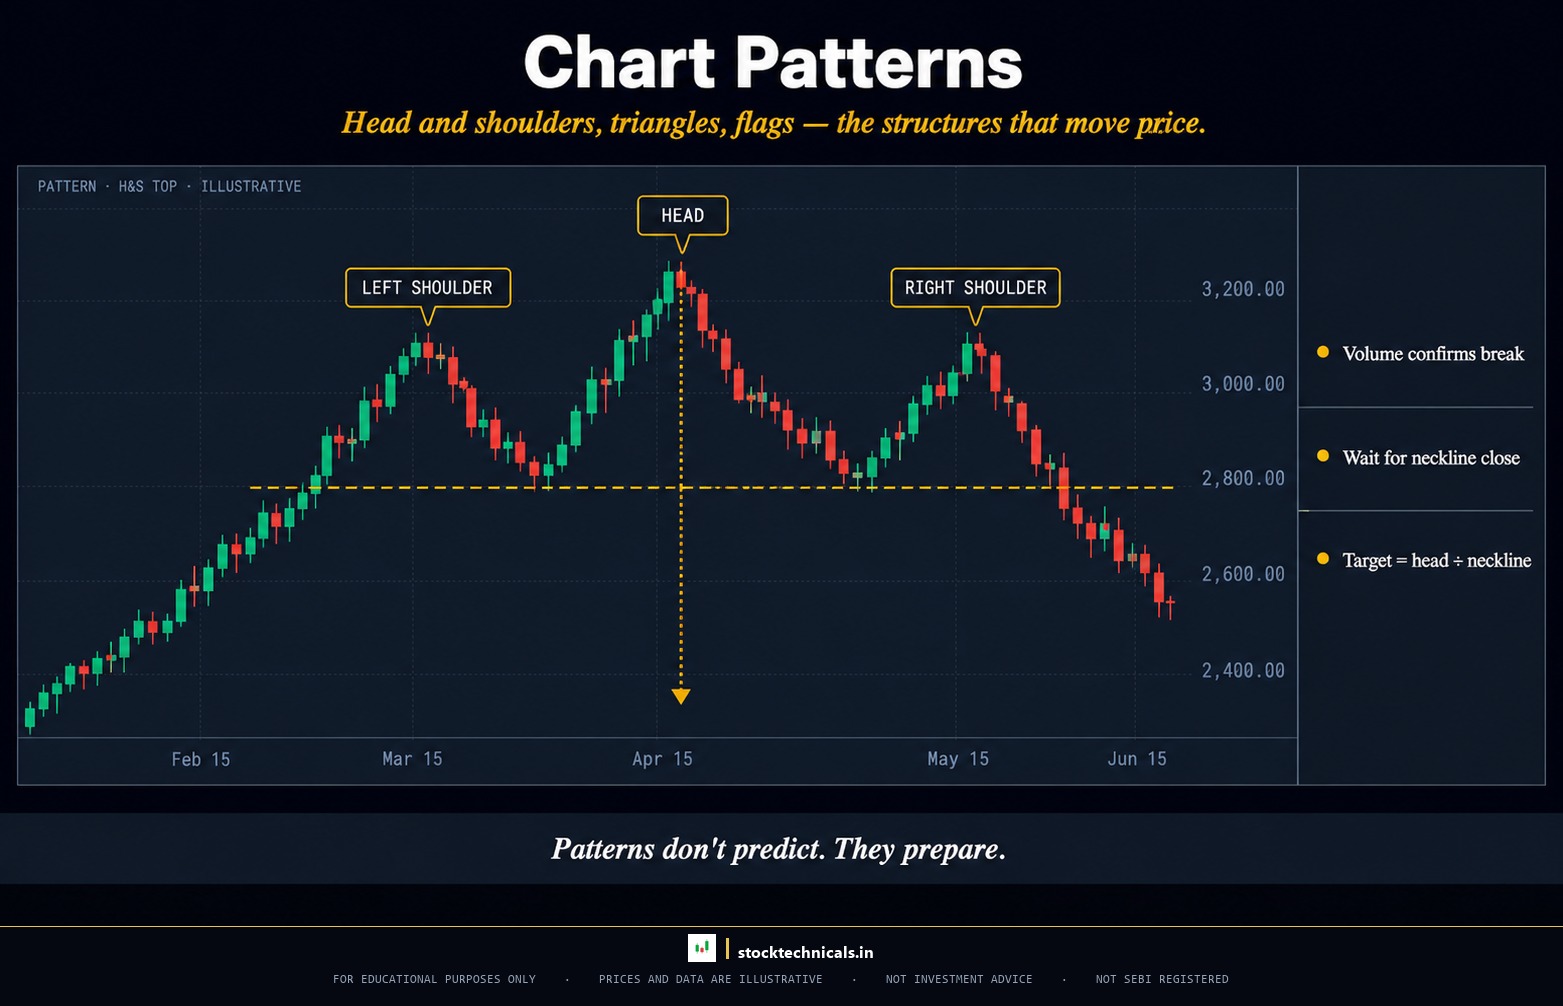
A chart pattern is a multi-candle formation — usually spanning 20 to 200 sessions — that has a recognisable shape, a repeating logic, and a measurable trade plan. Head and Shoulders marks distribution at a top. Triangles compress volatility before a directional break. Flags show brief pauses in strong trends before continuation. Cup and Handle is a multi-month base that launches breakout moves.
The patterns are not arbitrary squiggles. Each one maps to a specific sequence of supply-demand shifts — institutions accumulating or distributing stock, retail crowds joining or exiting, short-term funds fading or following the move. The shape is the visual symptom; the order flow underneath is the cause.
Every pattern in this topic has three things: an entry trigger (usually a neckline, trendline, or horizontal break with volume), a stop placement rule (structural, not arbitrary), and a projected target (measured from the pattern’s height or width). Trade patterns without those three rules and you are gambling on geometry.
Why Chart Patterns Work (and When They Fail)
Chart patterns work because they map to predictable institutional behaviour. When a fund accumulates 50 lakh shares of Tata Motors (NSE: TATAMOTORS) over three months, they cannot buy in one block without moving the price against themselves — they buy on pullbacks and hold during rallies. The shape of that activity looks like a Cup and Handle or a Rounding Bottom on your chart. When the accumulation ends and the fund stops defending the price, the stock breaks out. That is not geometry — that is order flow with a time axis.
This approach fails — reliably and expensively — in four situations. Learn them now so you do not learn them with real capital later:
- Pattern-fitting before confirmation. Retail traders see a half-formed Head and Shoulders and front-run the neckline break. When price does not break and instead resumes the uptrend, the “pattern” dissolves. Wait for the break with volume. Patience beats prediction.
- Ignoring the trend context. A bullish Cup and Handle in a strong downtrend is a weak trade. Patterns aligned with the larger trend work ~70% of the time; patterns fighting the trend work closer to 40%. Always check the weekly trend before pattern-trading the daily.
- Patterns on low-volume stocks. A triangle on a stock trading 50,000 shares daily has no institutional participation — the shape exists but the story does not. Only pattern-trade liquid stocks (Nifty 500 components or better).
- Measured-move myths. The textbook says a Head and Shoulders projects the head-to-neckline distance downward from the break. That works ~50% of the time. Use the measured move as a reasonable first target, not as a guaranteed outcome. Trail your stop and let the market tell you how far it goes.
How Indian Market Mechanics Shape Patterns
Indian equities have a structural long-bias (Nifty 50 (NSE: NIFTY 50) has averaged ~11% annual returns since 1996), which makes bullish continuation patterns — Flags, Pennants, Cup and Handle, Ascending Triangles — fire more reliably than bearish reversal patterns. This is the opposite of shorter-session US intraday markets.
Sectoral rotation drives pattern clustering: when an IT cycle starts, you see bullish patterns emerge almost simultaneously on TCS, Infosys, Wipro, and HCL Technologies. Pattern recognition at the index level (Nifty IT, Bank Nifty (NSE: BANKNIFTY), Nifty Auto) frequently leads individual-stock pattern triggers by 1-2 weeks.
FII flow data (released daily by NSE) often confirms or contradicts what the chart is showing. A Cup and Handle on Reliance (NSE: RELIANCE) forming while FIIs are net sellers for three consecutive weeks is weaker than the same pattern with FIIs net buying. Pattern + order flow = conviction. Pattern alone = hope.
What a Chart Pattern Trade Looks Like in Practice
Walk through a realistic example. Tata Motors is forming a classic Cup and Handle on the daily chart over four months — a U-shaped base from ₹720 down to ₹640 and back up to ₹720, followed by a three-week pullback (the handle) to ₹695. Daily volume has been declining steadily during the handle, a sign of supply drying up. FII flow data for Indian auto shows net buying for the last six trading days. The chart is set up; the order flow is supportive.
The trade trigger is a daily close above ₹720 (the cup rim) on volume at least 1.5x the 20-day average. That is the entry rule — no short-cut there. Stop loss sits just below the handle low at ₹693, because if price closes back inside the handle, the pattern has failed. Target is the cup depth (₹720 − ₹640 = ₹80) projected from the breakout point, giving ₹800 as the measured move. Position size is calibrated so that a stop-out from ₹725 entry to ₹693 (a ₹32 loss per share) is no more than 1% of total account equity.
The trade either works and price ramps through ₹760 on strong volume within two weeks, hitting the ₹800 target for a clean 4:1 reward-to-risk outcome; or it fakes out, re-enters the handle, and triggers the stop for a clean small loss. Either outcome is acceptable — both are rule-based trades with a defined downside. What is not acceptable is moving the stop, adding to a loser, or exiting early on profit without hitting the plan target. Discipline at the stop level is what separates profitable pattern traders from the other 90%.
This is the entire game of chart-pattern trading: identify the pattern, verify the context (trend, volume, order flow), define the entry/stop/target in advance, and execute without emotion. The pattern is the signal; the rules are the trade. Article 9 of this topic generalises this framework so it applies to any of the 12+ patterns covered — same logic, different geometry.
All 10 articles in this topic
Read in sequence for depth; jump to a style-aware subset after the Foundation articles if you already know your trading horizon.
Reversal Patterns — Articles 1-4
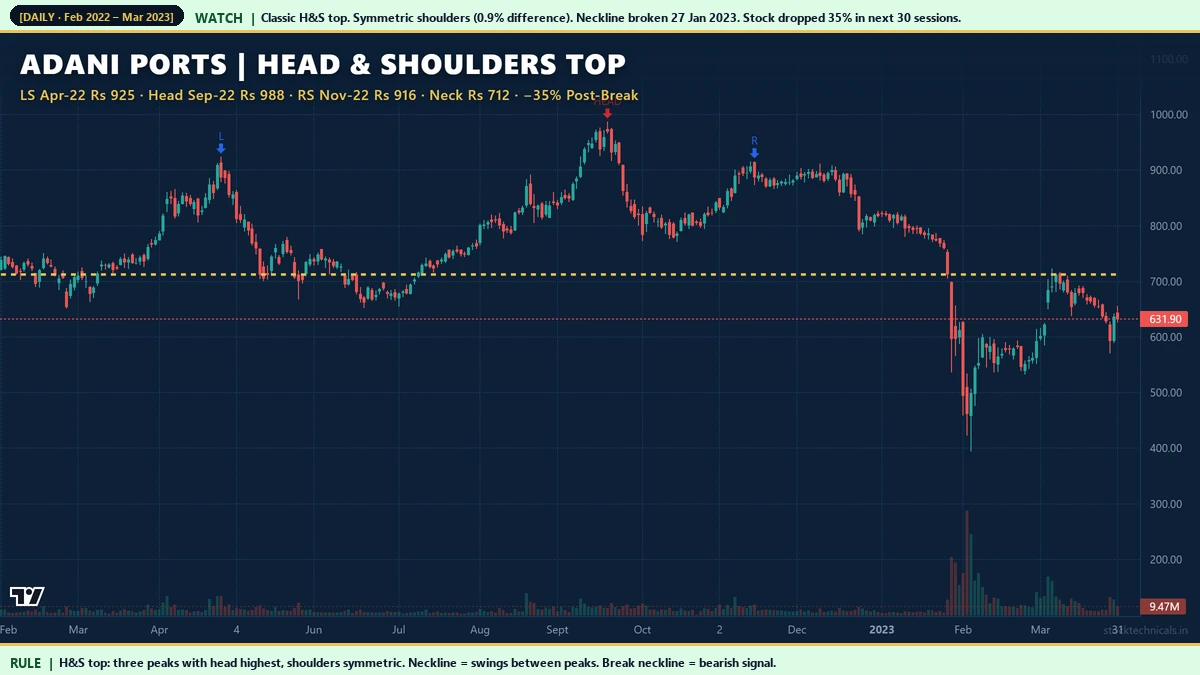
- Head and Shoulders Pattern: 7 Verified NSE Examples with Trade Plans — The most famous reversal pattern in technical analysis — 7 verified NSE examples with full trade plans.
- Double Tops and Double Bottoms: 7 Verified NSE Reversal Patterns — Twin-peak and twin-trough reversals — how to separate the real ones from the fakes.
- Rounding Bottom and Rounding Top: Saucer Reversal Patterns on NSE — Slow, multi-month reversals that precede the largest moves — how to spot Rounding Bottom and Rounding Top early.
- Gaps in Trading: Breakaway, Runaway, and Exhaustion Gaps with NSE Examples — Gap classification and trading — Breakaway, Runaway, and Exhaustion Gaps with NSE examples.
Continuation Patterns — Articles 5-7
- Triangle Patterns: Ascending, Descending, and Symmetrical with NSE Examples — Symmetric, ascending, and descending — the three triangle geometries and their directional bias.
- Flags and Pennants: 7 Verified NSE Continuation Patterns — Short-duration continuation patterns — Flags for trending moves, Pennants for volatile ones.
- Cup and Handle Pattern: 7 Verified NSE Bullish Continuation Setups — The multi-month base that launches breakout moves — Cup and Handle with 7 NSE examples.
- Wedge Patterns: Rising and Falling Wedges with 7 NSE Examples — Rising and Falling Wedges — the reversal patterns that disguise themselves as continuations.
Frameworks and Confluence — Articles 9-10
- Chart Pattern Trading Strategies: Unified Framework for 12+ Patterns — The unified trade plan framework that applies to 12+ chart patterns — entry, stop, and target rules.
- Combine Chart Patterns with Indicators: Confluence Setups with 70%+ Success Rate — Combining patterns with RSI, MACD, and volume to lift confluence setups above 70% success.
Choose Your Starting Point by Trading Style
If you already know the kind of trader you want to be, here is a shorter path into this topic. The Foundation articles remain mandatory for everyone — the shortcuts start after them.
- If you swing-trade breakouts: Flags and Pennants: 7 Verified NSE Continuation Patterns, Triangle Patterns: Ascending, Descending, and Symmetrical with NSE Examples, Cup and Handle Pattern: 7 Verified NSE Bullish Continuation Setups, Chart Pattern Trading Strategies: Unified Framework for 12+ Patterns. Flags, Pennants, and Cup and Handle on daily charts are the highest-edge swing setups. The unified framework (article 9) is where the trade plan lives.
- If you positional-trade multi-month setups: Rounding Bottom and Rounding Top: Saucer Reversal Patterns on NSE, Cup and Handle Pattern: 7 Verified NSE Bullish Continuation Setups, Head and Shoulders Pattern: 7 Verified NSE Examples with Trade Plans, Combine Chart Patterns with Indicators: Confluence Setups with 70%+ Success Rate. Rounding Bottoms and Head and Shoulders on weekly charts are what institutions trade. Confluence with indicators lifts win-rate meaningfully.
- If you trade intraday options on chart patterns: Gaps in Trading: Breakaway, Runaway, and Exhaustion Gaps with NSE Examples, Flags and Pennants: 7 Verified NSE Continuation Patterns, Triangle Patterns: Ascending, Descending, and Symmetrical with NSE Examples. Gap patterns and short-duration triangles on 15-minute Nifty and Bank Nifty charts dominate intraday options strategies.
What to Read Alongside and After
Every topic on the site connects. Here is how this one plugs in:
- Beginner Technical Analysis — The foundation this topic assumes — 15 articles including trendlines and volume.
- Candlestick Patterns — The atoms; chart patterns are the molecules. 12 articles.
- Price Action Trading — Trading chart patterns without indicators — pure price and volume. 7 articles.
- Technical Indicators — The confluence tools that push pattern win-rates higher. 9 articles.
Key Takeaways
- Chart patterns work because they map to predictable institutional accumulation and distribution — not because the shapes are magical.
- Every pattern needs three rules: entry trigger (with volume), structural stop, measured-move target. Without those three, you are gambling on geometry.
- Indian markets have a structural long-bias — bullish continuation patterns fire more reliably than bearish reversals.
- Confluence (pattern + indicator + volume + trend alignment) is what lifts pattern win-rates from ~50% to ~70%. Single-signal pattern trading is coin-flipping in disguise.
| Pattern Family | Examples | Bias |
|---|---|---|
| Reversal | Head & Shoulders, Double Top/Bottom, Rounding Top/Bottom | Counter-trend at major levels |
| Continuation | Flags, Pennants, Triangles, Cup and Handle | With-trend after consolidation |
| Bilateral | Symmetrical Triangle, Wedges | Trade either breakout direction |
| Gap-based | Breakaway, Runaway, Exhaustion gaps | Direction depends on gap type |
I traded chart patterns for years before I learnt that the breakout candle’s volume tells you whether to follow or fade. We tested 150 triangle breakouts on NSE stocks — those with 1.5x average volume held 72% of the time, those without held 31%. Volume is the filter.
“The Head and Shoulders pattern is the most reliable reversal formation in technical analysis.”
— Edwards & Magee, Technical Analysis of Stock Trends
| Pattern Reliability Tier | Examples | Min volume on breakout |
|---|---|---|
| Highest (70%+ hit rate) | Head and Shoulders, Cup and Handle, Triple Top/Bottom | ≥1.5x 20-day average |
| High (60-70%) | Double Top/Bottom, Bull/Bear Flags, Wedges | ≥1.2x 20-day average |
| Medium (50-60%) | Triangles, Pennants, Rounding patterns | ≥1.5x for breakouts |
| Variable | Gaps, Rectangle ranges | Context-dependent |
I learnt the hard way that pattern reliability shifts dramatically with timeframe. We tested the same head-and-shoulders signal on daily vs hourly Reliance (NSE: RELIANCE) charts — daily fired with 71% reliability, hourly only 48%. Higher timeframe edges are real.
How long do chart patterns take to form?
Short-duration patterns like Flags and Pennants form in 1-4 weeks. Triangles and Head and Shoulders typically take 1-3 months. Cup and Handle and Rounding patterns often span 6-12 months. Pattern duration roughly predicts the scale of the resulting move — longer base, larger break.
Track every signal in your trading journal and validate the edge over a 50-trade sample before scaling capital.
What is the success rate of chart pattern trading?
Single-signal pattern trading averages 50-60% win rate in academic backtests. With confluence (volume, trend alignment, supporting indicators), win rates climb to 65-75%. Article 10 of this topic details how to stack confluence properly.
Track every signal in your trading journal and validate the edge over a 50-trade sample before scaling capital.
Do chart patterns work on Indian stocks like Reliance, TCS, Tata Motors?
Yes, and arguably better than in some global markets because Indian stocks have higher retail participation and less high-frequency noise than US equities. The patterns identified by NSE’s most-traded stocks (Nifty 500) are as reliable as anywhere.
Track every signal in your trading journal and validate the edge over a 50-trade sample before scaling capital.
Should I trade chart patterns on intraday timeframes or daily?
Daily is the cleanest timeframe for most patterns. Intraday (15-min and 1-hour) patterns work but produce more false breakouts because session-level noise overwhelms the signal. Positional traders prefer weekly patterns. Do not attempt chart patterns below 5-minute charts.
Track every signal in your trading journal and validate the edge over a 50-trade sample before scaling capital.
What is the difference between a chart pattern and a candlestick pattern?
Candlestick patterns form over 1-5 candles and signal short-term reversals or continuations. Chart patterns form over 20-200 candles and signal larger structural shifts. Use candlesticks for entry timing within a chart pattern — for example, a Bullish Engulfing on the neckline break of an inverse Head and Shoulders.
Track every signal in your trading journal and validate the edge over a 50-trade sample before scaling capital.
How do I know when a chart pattern has failed?
Each pattern has a structural failure level — typically the opposite side of the pattern’s body. A Head and Shoulders fails when price closes back above the right shoulder. A Cup and Handle fails when price closes below the handle’s low on volume. Always know the failure level before entering — it is your stop.
Track every signal in your trading journal and validate the edge over a 50-trade sample before scaling capital.
Can I use chart patterns for options trading?
Yes. Chart patterns on the underlying index (Nifty, Bank Nifty) or on high-volume stocks frame option directional trades. Pattern + time horizon determines whether you buy directional calls/puts, sell premium, or construct spreads. Options mechanics are covered in the Options & F&O Trading hub.
Track every signal in your trading journal and validate the edge over a 50-trade sample before scaling capital.
Do I need to memorise all chart patterns or focus on a few?
Focus on 6 core patterns: Head and Shoulders, Double Top/Bottom, Triangles, Flags, Cup and Handle, and Rounding. These cover 90% of tradeable setups. The unified framework in article 9 lets you apply the same trade logic to any pattern you recognise, even ones you have not memorised.
Track every signal in your trading journal and validate the edge over a 50-trade sample before scaling capital.
Trading in equities, derivatives, currencies, and commodities carries substantial risk of loss and is not suitable for every investor. SEBI’s 2023-24 study showed 93% of individual intraday traders in the equity segment made net losses. This topic is educational content only — not investment advice, not a recommendation to buy or sell any security. No SEBI RIA registration is in place on this site. Past chart behaviour does not guarantee future performance. Always paper-trade before risking real capital, size positions so a single loss cannot compromise your financial situation, and confirm every example against your own broker terminal before acting. When in doubt, consult a SEBI-registered investment adviser.