Rounding patterns are long-duration reversal patterns shaped like saucers. A rounding bottom is a bullish reversal that looks like a gentle U over weeks or months. A rounding top is the bearish mirror — an inverted U showing gradual distribution. Unlike Cup & Handle, rounding patterns have no handle pullback — price breaks directly through the rim. This article covers seven NSE rounding examples from 2017 to 2023.

Chart window: Jun 2020 – Jan 2021 · Data refreshed April 18, 2026 · Source: NSE (daily OHLC)
Key Takeaways
- Rounding Bottom: bullish reversal, gradual U-shape, no handle pullback. Break above rim = entry.
- Rounding Top: bearish reversal, inverted U (saucer top). Break below rim = entry for short or long exit.
- Distinguishing from Cup & Handle: rounding patterns have NO handle. Price breaks directly through rim.
- Duration: 6-52 weeks. Longer patterns (3+ months) tend to produce stronger follow-through.
- Shape: U-shape required (not V). Gradual decline/rise, not panic or euphoria.
- Target: pattern range projected from rim in break direction.
Rounding Bottom vs Rounding Top

Chart data: Evergreen reference · Last reviewed April 18, 2026
Both rounding patterns share the same saucer geometry, just mirrored across the rim level. A rounding bottom forms at the end of a downtrend when selling exhaustion gives way to gradual accumulation. A rounding top forms at the end of an uptrend when buying exhaustion gives way to gradual distribution. The smoothness of the curve is critical — panic V-shapes do not qualify as rounding patterns.
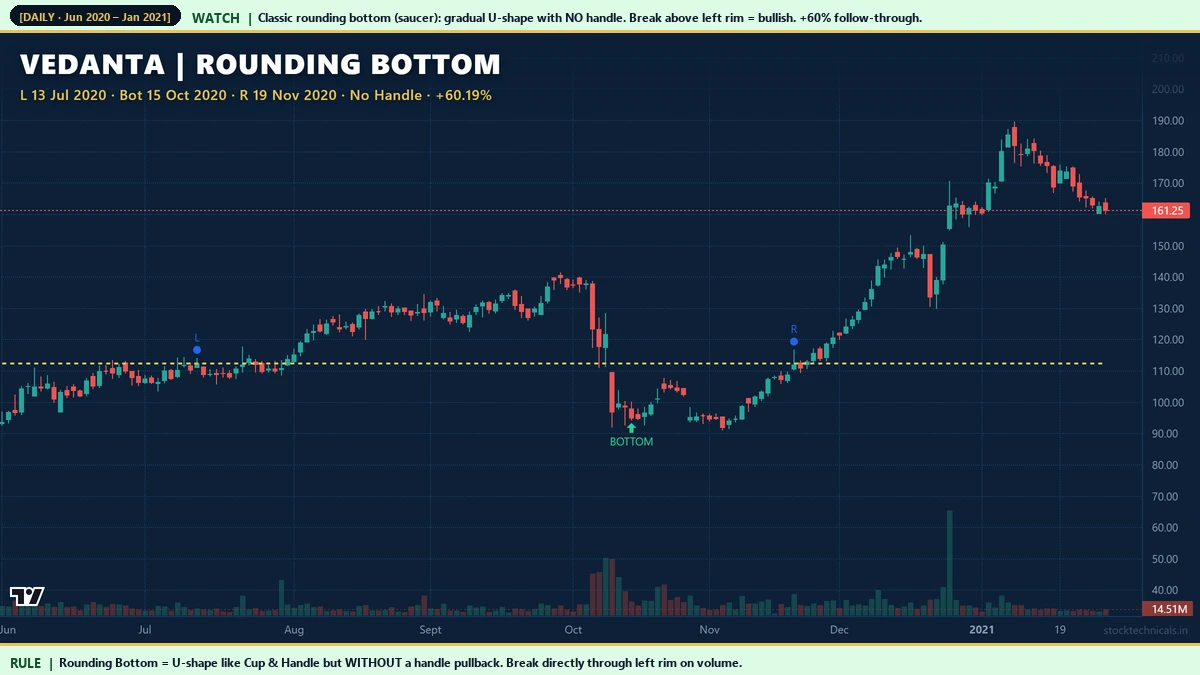
Hero Example: Vedanta Rounding Bottom 2020
IndusInd Bank Rounding Bottom

Chart window: Jul 2020 – Jan 2021 · Data refreshed April 18, 2026 · Source: NSE (daily OHLC)
IndusInd Bank (NSE: INDUSINDBK) printed a faster rounding bottom — just 35 sessions from left rim to right rim. Faster patterns (5-10 weeks) still work when the sector backdrop supports the reversal. In this case, banking-sector recovery after the Covid rate cuts provided the tailwind. +42.8% follow-through in 30 sessions.
Long-Duration Rounding Bottom: Adani Enterprises

Chart window: Oct 2017 – Oct 2018 · Data refreshed April 18, 2026 · Source: NSE (daily OHLC)
Adani Enterprises formed a 176-session rounding bottom from November 2017 to July 2018. At 35 weeks duration, this is close to the upper end of typical rounding patterns. Long-duration rounding patterns are rarer but produce higher-confidence reversals because the prolonged base reflects deep institutional accumulation. +40.96% follow-through in 30 sessions.
Rounding vs Cup & Handle

Chart data: Evergreen reference · Last reviewed April 18, 2026
The two patterns are siblings. Both have U-shaped bases. The difference is the handle:
- Rounding Bottom: Price breaks directly through the rim. No handle pullback. More aggressive entry with less confirmation.
- Cup & Handle: Price reaches the rim, pulls back slightly (the handle) for 1-4 weeks, then breaks out. Handle provides a second low-risk entry.
Trade-off: rounding bottoms let you catch the move earlier, but the entry is riskier because there is no handle to confirm buyer conviction. Cup & Handle patterns are more conservative but provide an additional filter against false breakouts.
Hero Rounding Top: Adani Enterprises 2022-2023

Chart window: Aug 2022 – Mar 2023 · Data refreshed April 18, 2026 · Source: NSE (daily OHLC)
Axis Bank Pre-Covid Rounding Top

Chart window: Jul 2019 – May 2020 · Data refreshed April 18, 2026 · Source: NSE (daily OHLC)
Axis Bank’s August 2019 to March 2020 rounding top is a 142-session inverted saucer. The peak on December 27, 2019 was followed by a gradual decline through January and February. When Covid hit in March 2020, the pre-existing bearish pattern amplified the crash. A trader who was watching the rounding top could have exited longs or added shorts 8-10 weeks before the mainstream panic.
Quality Filters

Chart data: Evergreen reference · Last reviewed April 18, 2026
- Minimum 6 weeks formation. Shorter = flag/pennant, not rounding.
- Peak/bottom in middle third. Extreme should be roughly centered in duration.
- Gradual slopes (no V-shapes). Rounding requires smooth curvature.
- Rim reclaim with volume. Break through rim with above-30-day-average volume.
- Range 15-35% from rim to extreme. Less = noise. More = reversal may fail or be regime-change rather than pattern move.
Maruti Pre-Covid Rounding Top

Chart window: Apr 2019 – May 2020 · Data refreshed April 18, 2026 · Source: NSE (daily OHLC)
Maruti Suzuki printed a 192-session rounding top from May 2019 to February 2020 — one of the longest patterns in our audit. The gradual nature of the pattern reflected the auto-sector slowdown narrative that played out through 2019. Peak on October 29, 2019 at Rs 7,766. Right rim in February 2020 just before the Covid crash. Extended patterns like this are rare but highly reliable.
Tata Steel Pre-Covid Rounding Top

Chart window: Jul 2019 – May 2020 · Data refreshed April 18, 2026 · Source: NSE (daily OHLC)
Tata Steel’s pre-Covid rounding top coincided with the peak of the metals-cycle rally that had run through 2019. The December 2019 peak marked the inflection point. When multiple sector leaders (Axis Bank, Maruti, Tata Steel, Reliance) print rounding tops within weeks of each other, it is an index-level bearish signal far more powerful than any single-stock pattern.
Interactive Tool: Rounding Pattern Identifier
Toggle between Rounding Bottom and Rounding Top. Enter rim price, extreme price, duration, position, and breakout price. Tool renders the pattern, computes target, and scores quality (0-5).
Practical Rule Book
- Minimum 6-week duration. Shorter formations are too fast to be rounding patterns.
- Require U-shape, reject V-shape. Smooth curvature is the defining feature.
- Volume should contract through formation. Classic base-building/distribution signature.
- Volume must expand on rim break. Low-volume breaks fail often.
- Stop below lowest pattern low (bottoms) or above highest pattern high (tops).
- Target = pattern range projected from rim in break direction.
Common Mistakes
Mistake 2: Entering before the rim break. The pattern is not confirmed until price reclaims the rim level.
Mistake 3: Ignoring volume contraction during formation. Rising volume during the pattern suggests distribution (for bottoms) or accumulation (for tops) — bad signs.
Mistake 4: Using rounding patterns on illiquid stocks. Thin volume distorts the saucer shape.
Mistake 5: Expecting fast follow-through. Rounding patterns are slow-developing; follow-through tends to play out over 4-12 weeks, not days.
Related Reading
- Cup and Handle Pattern — the sibling with a handle.
- Double Tops and Double Bottoms — faster reversal patterns.
- Head and Shoulders Pattern — classic reversal pattern.
- Wedge Patterns — other reversal patterns.
- Volume in Trading — volume confirmation framework.
Quick Quiz: Rounding Bottom and Rounding Top
Five questions to check your grasp. No login, no score saved — just instant feedback.
1. A rounding bottom on a weekly chart is best described as …
2. Typical duration of a rounding bottom is …
3. Volume pattern during a rounding bottom classically shows …
4. A rounding top signals …
5. The best entry trigger for a rounding bottom is typically …
| Pattern | Shape | Time required | Signal |
|---|---|---|---|
| Rounding Bottom (Saucer) | U-shaped curve | Months to year+ | Bullish reversal |
| Rounding Top | Inverted U | Months to year+ | Bearish reversal |
| Inverse Saucer | Smooth dome | Quarters | Bearish — slower than head and shoulders |
I watched a Rounding Bottom develop on Bharti Airtel over six months. The slow pace tested my conviction — but I learnt that long-base patterns reward patience.
“The rounding bottom is a pattern of patience — reward for those who can wait six months.”
— Edwards & Magee, Technical Analysis of Stock Trends
What is a rounding bottom?
A rounding bottom is a bullish reversal pattern shaped like a gentle U. It forms over 6-52 weeks as a prior downtrend gives way to gradual accumulation. When price reclaims the starting level (the rim) on volume, a sustained rally typically follows.
What is a rounding top?
A rounding top is the bearish mirror of a rounding bottom — an inverted U (saucer top). Price rises gradually, peaks near the middle of the pattern duration, then declines gradually. Break below the starting level confirms the bearish reversal.
How is rounding bottom different from Cup and Handle?
Both have U-shaped bases. Cup & Handle has a distinct handle pullback (1-4 weeks of consolidation) before the breakout. Rounding bottom has NO handle — price breaks directly through the rim. Rounding patterns provide earlier entry but less confirmation than Cup & Handle.
How long does a rounding pattern take to form?
Typically 6-52 weeks. Shorter than 6 weeks is usually a flag or pennant, not a rounding pattern. Longer than 52 weeks is rare but higher-conviction. Average duration 2-4 months on daily charts.
How do I calculate the target?
Measure the range from the rim to the pattern extreme (bottom for bullish, peak for bearish). Project that range from the breakout price in the break direction. For a rounding bottom with rim Rs 132 and bottom Rs 111 (range Rs 21), target from Rs 134 breakout is Rs 155.
Do rounding patterns work on weekly charts?
Yes, and they are even more reliable on weekly charts. A weekly rounding pattern of 10-20 weeks covers roughly 50-100 daily sessions, producing high-conviction reversal signals with reduced noise.
What is the success rate?
On NSE from 2017 to 2024, well-formed rounding patterns (smooth U/inverted-U, 6+ week duration, volume confirmation on rim break) reach measured-move target roughly 65-75 percent of the time. Poor-quality patterns fail near 50 percent.
Can rounding patterns appear intraday?
Occasionally on 15-minute or hourly charts, but the pattern works best on daily and weekly timeframes. Intraday rounding patterns are noisier and less reliable than their longer-duration counterparts.
The Bottom Line
Rounding patterns capture the geometric signature of slow, institutional-driven reversals — no panic, no euphoria, just steady accumulation or distribution over weeks or months. Seven NSE examples delivered 38-60% moves. The pattern works reliably when the quality filters are respected: minimum 6-week duration, smooth U-shape (not V), rim reclaim with volume.
These patterns require patience. They take months to form and follow-through plays out over weeks, not days. Trader personality matters here: swing traders and position traders will find rounding patterns valuable. Day traders and scalpers will not.
Scan weekly charts on Nifty 500 constituents for stocks showing smooth U-shaped or inverted-U bases over at least 3 months. Those are rounding-pattern candidates. Apply the quality filters. The setups that pass offer some of the cleanest long-duration reversal signals available on Indian stocks.
Risk Notice
Trading in equities, derivatives, and index products carries substantial risk of loss. The examples in this article are historical and do not guarantee future returns. Price data is sourced from NSE daily OHLC feeds; back-testing any strategy on your own data is essential before deploying capital. This content is educational only. It is not an investment recommendation, a tip, or a solicitation to trade any specific security. Consult a SEBI-registered advisor before acting on any information here. Size every trade at 1 percent of your total capital and never trade money you cannot afford to lose.