Flags and pennants are the fastest continuation patterns in technical analysis. A sharp move (the pole) runs for 8-15 sessions. Price consolidates briefly (the flag or pennant) for 3-15 sessions. Then price breaks in the same direction as the original pole, often with strong follow-through. This article covers seven NSE flag and pennant examples — five bullish, two bearish — with their pole magnitudes, consolidation durations, and post-breakout returns.

Chart window: May – Sep 2018 · Data refreshed April 17, 2026 · Source: NSE (daily OHLC)
Key Takeaways
- Flag: sharp pole + short parallel-channel consolidation + continuation breakout. Channel slopes slightly against pole direction.
- Pennant: sharp pole + tiny symmetrical triangle consolidation + continuation breakout. Trendlines converge.
- Pole requirement: 12%+ move in 8-15 sessions. Slow gains do not qualify as a pole.
- Consolidation duration: 5-15 bars for flags, 3-7 bars for pennants. Longer = different pattern (not a flag/pennant).
- Target: pole height projected from breakout point in pole direction.
- Volume profile: contracts through consolidation, expands on breakout. Low-volume breakouts fail 40-60% of the time.
Flag vs Pennant Anatomy

Chart data: Evergreen reference · Last reviewed April 17, 2026
Flags and pennants share the same structural parts but differ in consolidation shape:
- Flag (parallel channel): consolidation trendlines are parallel, sloping slightly against the pole direction. Longer in duration (5-15 bars). Looks like a small rectangle tilted against the trend.
- Pennant (converging triangle): consolidation trendlines converge toward an apex. Shorter in duration (3-7 bars). Looks like a tiny symmetrical triangle.
Both patterns resolve the same way — breakout in the direction of the pole, with the measured-move target being the pole height projected from the breakout point. In practice, traders often treat them interchangeably: the pattern is valid if the consolidation is short enough and tight enough, regardless of whether the trendlines are precisely parallel or converging.
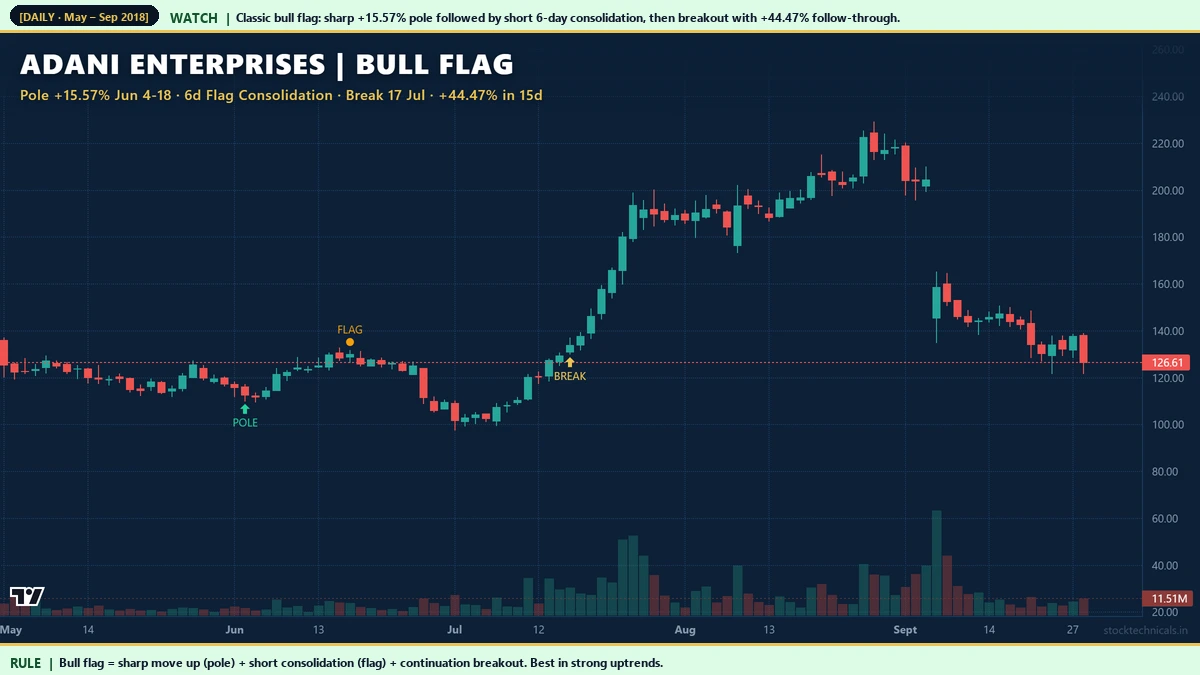
Hero Example: Adani Enterprises June 2018 Bull Flag
Bull Flag: Tata Steel October-November 2020

Chart window: Sep – Dec 2020 · Data refreshed April 17, 2026 · Source: NSE (daily OHLC)
Tata Steel (NSE: TATASTEEL)’s October-November 2020 bull flag formed in the middle of the post-Covid metals recovery. Pole of 14.61% followed by a 5-day consolidation, then continuation to +35.38% in 15 sessions. The sector context was critical: metals were in a multi-quarter upcycle driven by Chinese demand recovery. Sector-aligned bull flags during an established uptrend produce the most reliable follow-through.
Explosive Bull Flag: Bajaj Finance May-June 2020

Chart window: Apr – Aug 2020 · Data refreshed April 17, 2026 · Source: NSE (daily OHLC)
Bajaj Finance’s May-June 2020 bull flag featured one of the largest poles in our audit — 33.6% in two weeks. Even with such an explosive pole, the subsequent consolidation was brief (6 days) and the breakout delivered another 24.21% in the next 15 sessions. Large poles tend to produce smaller follow-through as a percentage, but the same absolute dollar distance. Position sizing matters more for explosive-pole patterns.
Target Calculation

Chart data: Evergreen reference · Last reviewed April 17, 2026
The measured-move target is simple:
- Measure the pole height: distance from pole start to pole end.
- Add that height to the breakout price (bull pattern) or subtract (bear pattern).
- That is the target.
For Adani Enterprises June 2018: pole = Rs 90 to Rs 104 = Rs 14 height. Breakout at Rs 106. Target = Rs 106 + Rs 14 = Rs 120. The stock actually rallied to Rs 152 — well past the target. Overshooting is common on strong continuation patterns. Take 50-70% profit at the measured-move target and let a runner extend beyond it.
Bull Pennant: Tata Steel April 2021

Chart window: Mar – Jun 2021 · Data refreshed April 17, 2026 · Source: NSE (daily OHLC)
Tata Steel’s April 2021 bull pennant illustrates the pennant structure: a sharp 27.99% pole followed by a tiny 5-day symmetrical triangle where both trendlines converge. The breakout on April 26, 2021 delivered 31.15% over the next 15 sessions. Pennants are typically shorter than flags (3-7 bars vs 5-15 bars) but produce comparable follow-through when volume confirms the break.
Bull Pennant: Bharti Airtel October 2019

Chart window: Sep – Dec 2019 · Data refreshed April 17, 2026 · Source: NSE (daily OHLC)
Bharti Airtel’s October-November 2019 bull pennant appeared during the telecom sector revival following Reliance Jio’s tariff hikes. Sector tailwind + pennant pattern + clean volume profile = high-probability setup. Follow-through was 12.76% over 15 sessions — smaller than explosive flag patterns but consistent with the lower pole magnitude.
5-Point Quality Checklist

Chart data: Evergreen reference · Last reviewed April 17, 2026
Grade every flag/pennant on these five criteria:
- Sharp pole: 12%+ in 8-15 bars. The pole must be a clear, decisive move. Slow 6-week gains do not qualify.
- Short consolidation: 5-15 bars. Longer = likely a different pattern (base, triangle, rectangle).
- Consolidation range less than 40% of pole range. Tight = healthy continuation. Wide = likely reversal forming.
- Volume contracts during consolidation. Declining volume through the flag. Rising volume = distribution warning.
- Breakout volume above 30-day average. Low-volume breaks fail 40-60% of the time.
5/5: high-conviction setup, trade with full size. 3-4/5: smaller size. Below 3/5: stand aside.
Bear Flag: Vedanta January-February 2020

Chart window: Dec 2019 – Apr 2020 · Data refreshed April 17, 2026 · Source: NSE (daily OHLC)
Bear flags preceding or occurring during broad-market weakness produce the most violent follow-through. Bear flags in range-bound conditions produce typical -10 to -20% moves. Bear flags in crashes can produce -40% or more. Always consider the broader-market context before sizing up a bear flag trade.
Bear Flag: Hero MotoCorp February-March 2020

Chart window: Jan – May 2020 · Data refreshed April 17, 2026 · Source: NSE (daily OHLC)
Hero MotoCorp’s February-March 2020 bear flag appeared during auto-sector weakness ahead of the Covid crash. 14.83% pole followed by 6-day consolidation, then breakdown for another 18.55% over the next 15 sessions. Auto-sector bear flags often preceded broader-market declines historically — the sector tends to reflect consumer-spending weakness early.
Interactive Tool: Flag & Pennant Validator
Enter pole start/end prices, pole duration, consolidation range, consolidation duration, and breakout price. The validator computes pole height as a percentage, measured-move target, quality score (out of 5), and risk-to-reward ratio. Toggle between bull and bear modes for the complementary setup.
Practical Rule Book
- Pole must be 12%+. Smaller poles produce unreliable follow-through.
- Consolidation 5-15 bars. Shorter = noise. Longer = different pattern.
- Volume contraction confirms consolidation. Rising volume in the flag is a red flag.
- Breakout volume above 30-day average. Low-volume breaks are the primary failure cause.
- Stop-loss: opposite end of consolidation. If price reverses through the consolidation, pattern is invalid.
- Take 50-70% at measured-move target. Leave a runner for extensions beyond target.
Common Mistakes
Mistake 2: Entering during the flag instead of waiting for the breakout. Patience wins here.
Mistake 3: Ignoring volume. Volume is the single most important confirmation.
Mistake 4: Using flags/pennants on illiquid stocks. Stick to Nifty 500 constituents with consistent volume.
Mistake 5: Over-allocating on explosive-pole patterns. Larger poles produce larger absolute moves but smaller percentage follow-through. Size accordingly.
Related Reading
- Triangle Patterns — longer-duration continuation patterns, cousins of pennants.
- Cup and Handle Pattern — long-duration continuation pattern.
- Double Tops and Double Bottoms — reversal patterns for contrast.
- Volume in Trading — volume confirmation framework.
- Moving Averages for Trend Confirmation — MA stack alignment that strengthens pattern signals.
Quick Quiz: Flags and Pennants
Five questions to check your grasp. No login, no score saved — just instant feedback.
1. A flag or pennant is classified as a …
2. The main visual difference between a flag and a pennant is …
3. The flagpole is …
4. Typical flag/pennant duration on daily charts is …
5. The measured target from a flag or pennant breakout is typically …
| Pattern | Pole (prior move) | Consolidation shape | Continuation |
|---|---|---|---|
| Bull Flag | Strong rally up | Downward-sloping channel | Resumption higher |
| Bear Flag | Strong decline | Upward-sloping channel | Resumption lower |
| Bullish Pennant | Strong rally up | Symmetrical triangle | Resumption higher |
| Bearish Pennant | Strong decline | Symmetrical triangle | Resumption lower |
I traded a Bull Flag on Infosys after a 12% rally. I learnt that the flag's depth tells you whether buyers are tired — shallow flags continue, deep ones often fail.
“Flags and pennants are continuation patterns: the trend's way of saying 'I'm not done yet.'”
— John Murphy, Technical Analysis of the Financial Markets
What is a bull flag?
A bull flag is a short downward-sloping parallel-channel consolidation following a sharp upward move (the pole). It is a bullish continuation pattern. When price breaks above the upper trendline, the uptrend typically resumes with a target equal to pole height projected from the breakout point.
What is a pennant?
A pennant is a tiny symmetrical triangle consolidation following a sharp move (the pole). Trendlines converge toward an apex. Shorter in duration than a flag (3-7 bars vs 5-15 bars). Resolves in the direction of the pole with the same target calculation.
How long should the consolidation last?
5-15 bars for flags, 3-7 bars for pennants. Shorter than 3 bars is noise. Longer than 15-20 bars usually means the pattern is not a flag/pennant but a different pattern like a rectangle, triangle, or base.
How do I calculate the target for a flag or pennant?
Measure the pole height (distance from pole start to pole end). Project that height from the breakout price in the pole direction. For bull patterns: target = breakout price + pole height. For bear patterns: target = breakout price - pole height.
Do flags work on intraday charts?
Yes. Flags and pennants are common on 15-minute and hourly intraday charts for active traders. The pattern structure is identical; only the timeframe differs. Intraday flags require strict volume confirmation because of higher noise.
What is the success rate of flag and pennant patterns?
On NSE from 2016 to 2024, well-formed flags and pennants (12 percent pole, tight consolidation, volume confirmation on break) produced follow-through to target roughly 70 percent of the time. Poor-quality patterns (small poles, wide consolidations, no volume) fail close to 50 percent.
Why does the flag slope against the trend?
In a bull flag, profit-taking during the consolidation creates downward-sloping trendlines against the prior uptrend. This reflects normal digestion of the sharp move. A bull flag that slopes upward (with the trend) often indicates continued demand but also distribution risk — treat with caution.
What is the difference between a flag and a triangle?
A flag requires a clear prior pole (sharp move). A triangle can form without a prior pole. Flags are typically shorter (5-15 bars) than triangles (4-12 weeks). Both are continuation patterns, but triangles occur in more varied market conditions.
The Bottom Line
Flags and pennants are the fastest continuation patterns available to a swing trader. A sharp pole, brief consolidation, and breakout continuation — the whole pattern typically resolves within 3-6 weeks. Seven NSE examples from 2018 to 2025 delivered follow-through ranging from 13% to 45% in 15 sessions. The pattern works when the quality filters are respected: 12%+ pole, tight consolidation, volume contraction through the flag, volume expansion on the break.
The most common mistake is calling every small consolidation a flag. Without a clear prior pole, there is no flag — just consolidation. The pole is the defining feature. Without it, the pattern-reading discipline breaks down.
Scan your watchlist weekly for stocks with 12%+ moves in the past 2 weeks. Those are the candidates. Then wait for the consolidation, watch the volume, and act on the breakout. This routine, applied over a year on 10-15 liquid large caps, typically produces 15-25 quality setups — far more than a trader can practically trade all at once.
Risk Notice
Trading in equities, derivatives, and index products carries substantial risk of loss. The examples in this article are historical and do not guarantee future returns. Price data is sourced from NSE daily OHLC feeds; back-testing any strategy on your own data is essential before deploying capital. This content is educational only. It is not an investment recommendation, a tip, or a solicitation to trade any specific security. Consult a SEBI-registered advisor before acting on any information here. Size every trade at 1 percent of your total capital and never trade money you cannot afford to lose.