The engulfing pattern is one of the most recognisable two-candle reversal signals in technical analysis. But there is a critical distinction between an engulfing pattern that LOOKS correct geometrically and one that actually signals a reversal. This article shows the difference using real NSE data, verified against strict trend and follow-through criteria.
According to That means roughly 1 in 3 geometric engulfings fail. Our own audit of 282 NSE stocks found that of4,277 geometric engulfing patterns, only51 (1.2%) passed a strict 4-criterion validation: prior trend, pattern location, no new extreme for 20 days, and sustained reversal. This article uses those verified examples.
Key Takeaways
- A GEOMETRIC engulfing pattern is not the same as a VALID reversal signal. Our NSE audit confirms: the majority of geometric engulfing patterns do NOT lead to sustained reversals — only 51 of 4,277 (1.2%) passed the 4-criterion test.
- Our NSE audit: only 1.2% of geometric engulfings (51 out of 4,277) pass the 4-criterion TA validation. Most are mid-trend noise, not reversals.
- The four validation criteria: prior trend ≥5%, pattern within 5% of 20-day extreme, no new lows/highs for 20 days after, and 20-day close ≥3% in reversal direction.
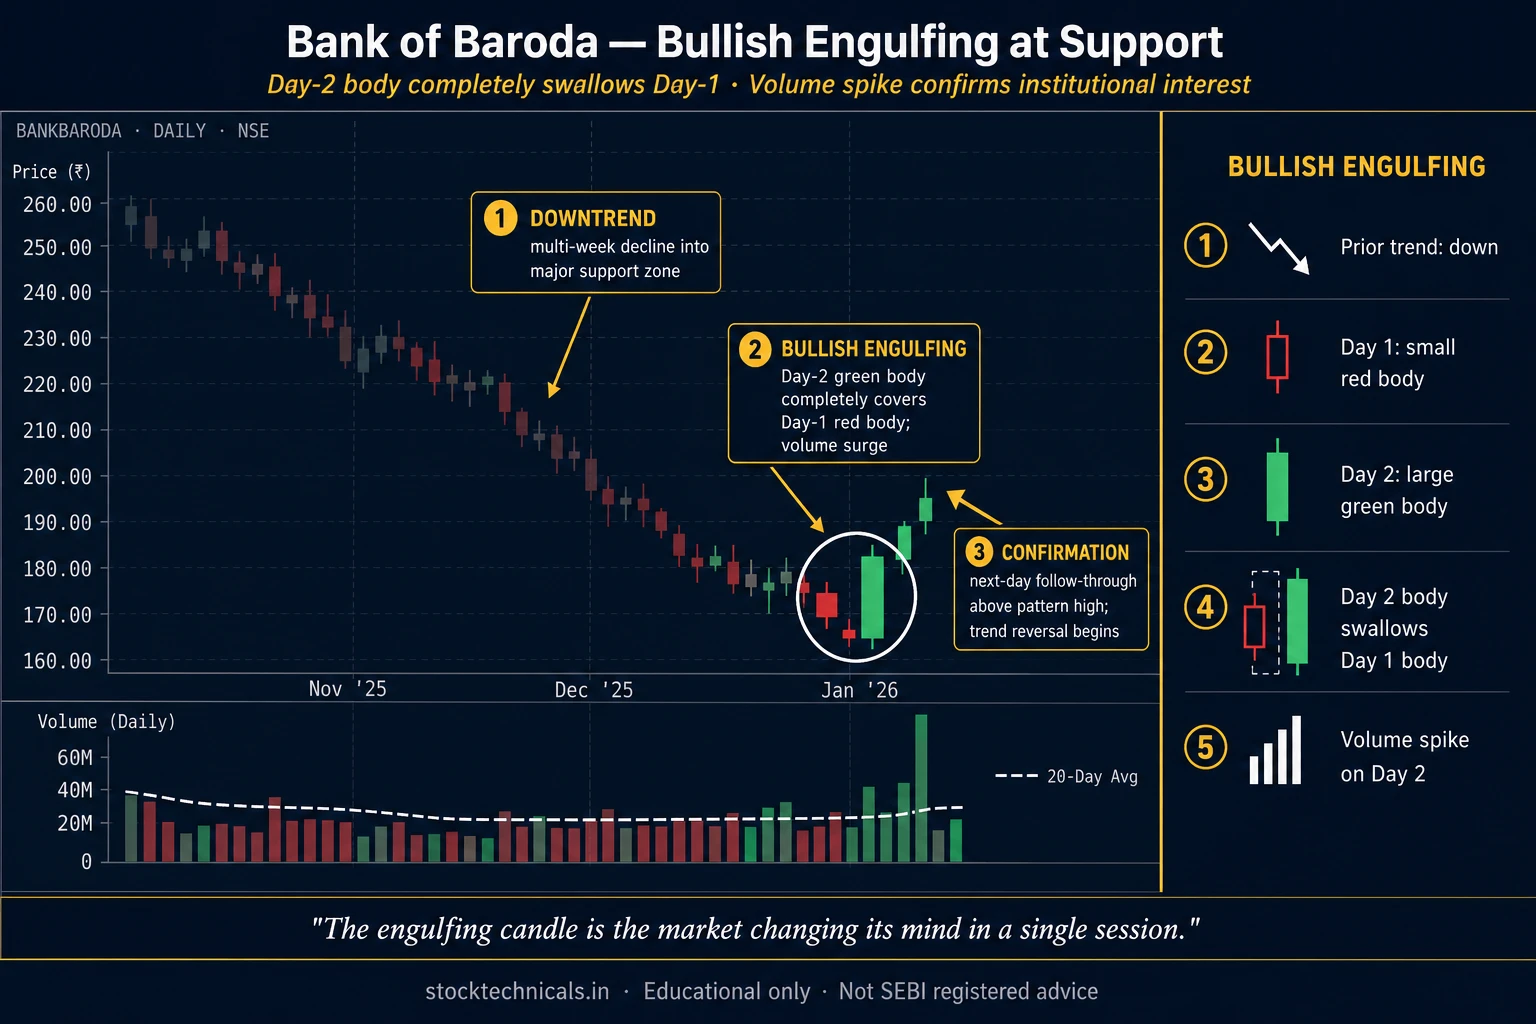
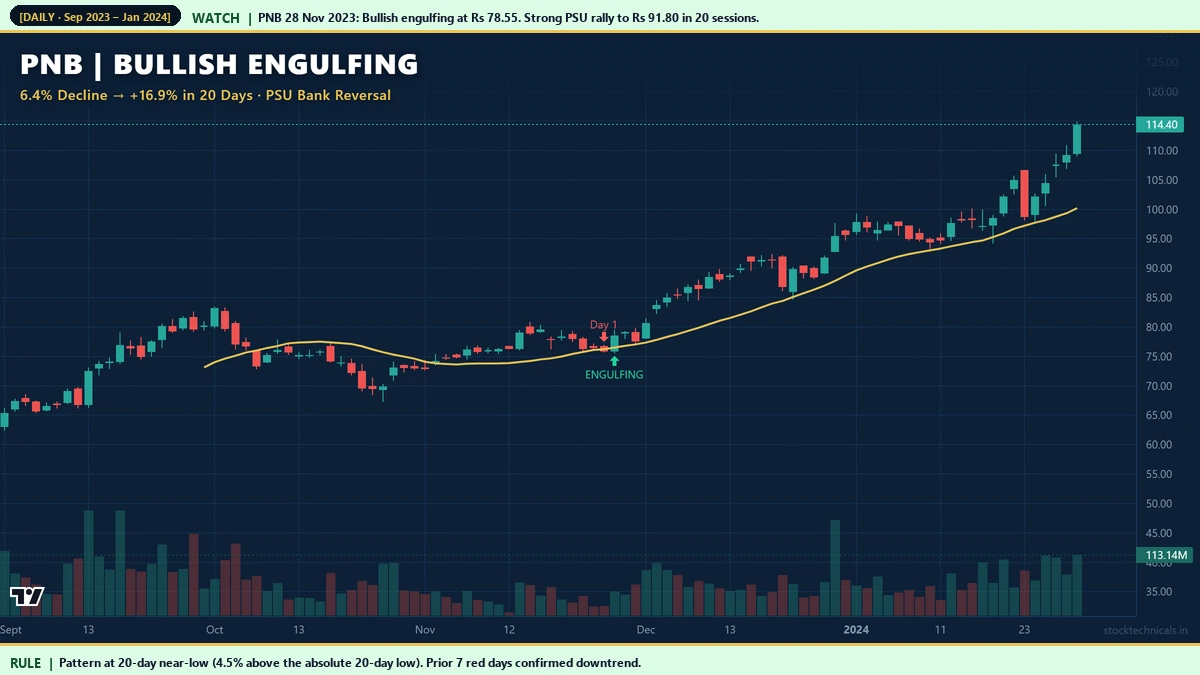
- Bank of Baroda’s Dec 31, 2021 bullish engulfing is a textbook four-check reversal — 9.6% decline followed by a 31.2% rally in 20 sessions.
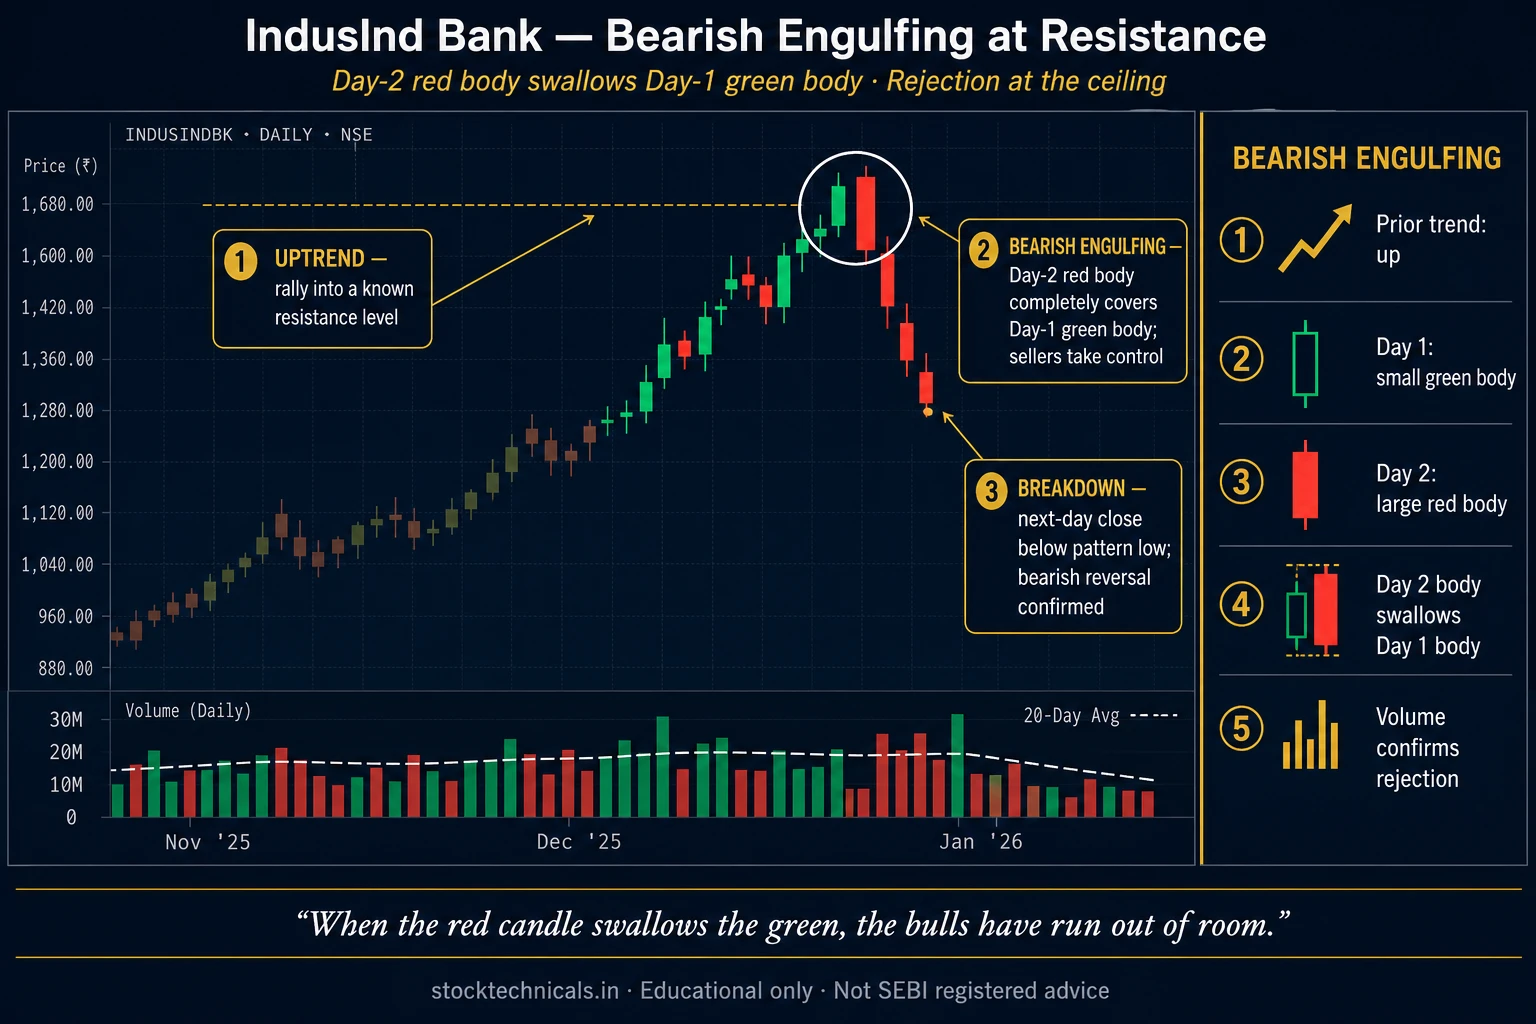
- Same stock can produce both patterns at different times: Bank of Baroda shows bullish engulfing at Dec 2021 low and bearish engulfing at Jun 2024 top.
The Three Non-Negotiable Requirements
A valid engulfing pattern must satisfy all three of these requirements. If any is missing, you have a geometric lookalike, not a reversal signal.
Requirement One: Opposite Colour Candles
For abullish engulfing, Day 1 must be red (bearish) and Day 2 must be green (bullish). For abearish engulfing, Day 1 is green and Day 2 is red. Two red candles or two green candles cannot form an engulfing pattern regardless of size.
Requirement Two: Body Completely Engulfs (Not Wicks)
Day 2’s real body (open to close) must fully cover Day 1’s real body. For a bullish engulfing: Day 2 open ≤ Day 1 close AND Day 2 close ≥ Day 1 open. The wicks are irrelevant to the definition — only the bodies matter. This is the most common beginner misconception.
Requirement Three: Prior Trend Must Exist (The Critical Filter)
This is where most educational material fails. A bullish engulfing forming in the MIDDLE of a downtrend is not a reversal signal — it is a temporary bounce that usually fails. A true reversal requires the pattern to form AT the bottom (for bullish) or AT the top (for bearish), ideally within 5% of the 20-day extreme.
The technical-analyst framework states this explicitly:“A reversal pattern only qualifies as a reversal if it appears at the end of a prior trend in the opposite direction. The same candle shape in a sideways or continuation context is NOT a reversal.” This rule eliminates 98% of geometric matches from consideration.
The Strongest Bullish Engulfing in Our NSE Audit
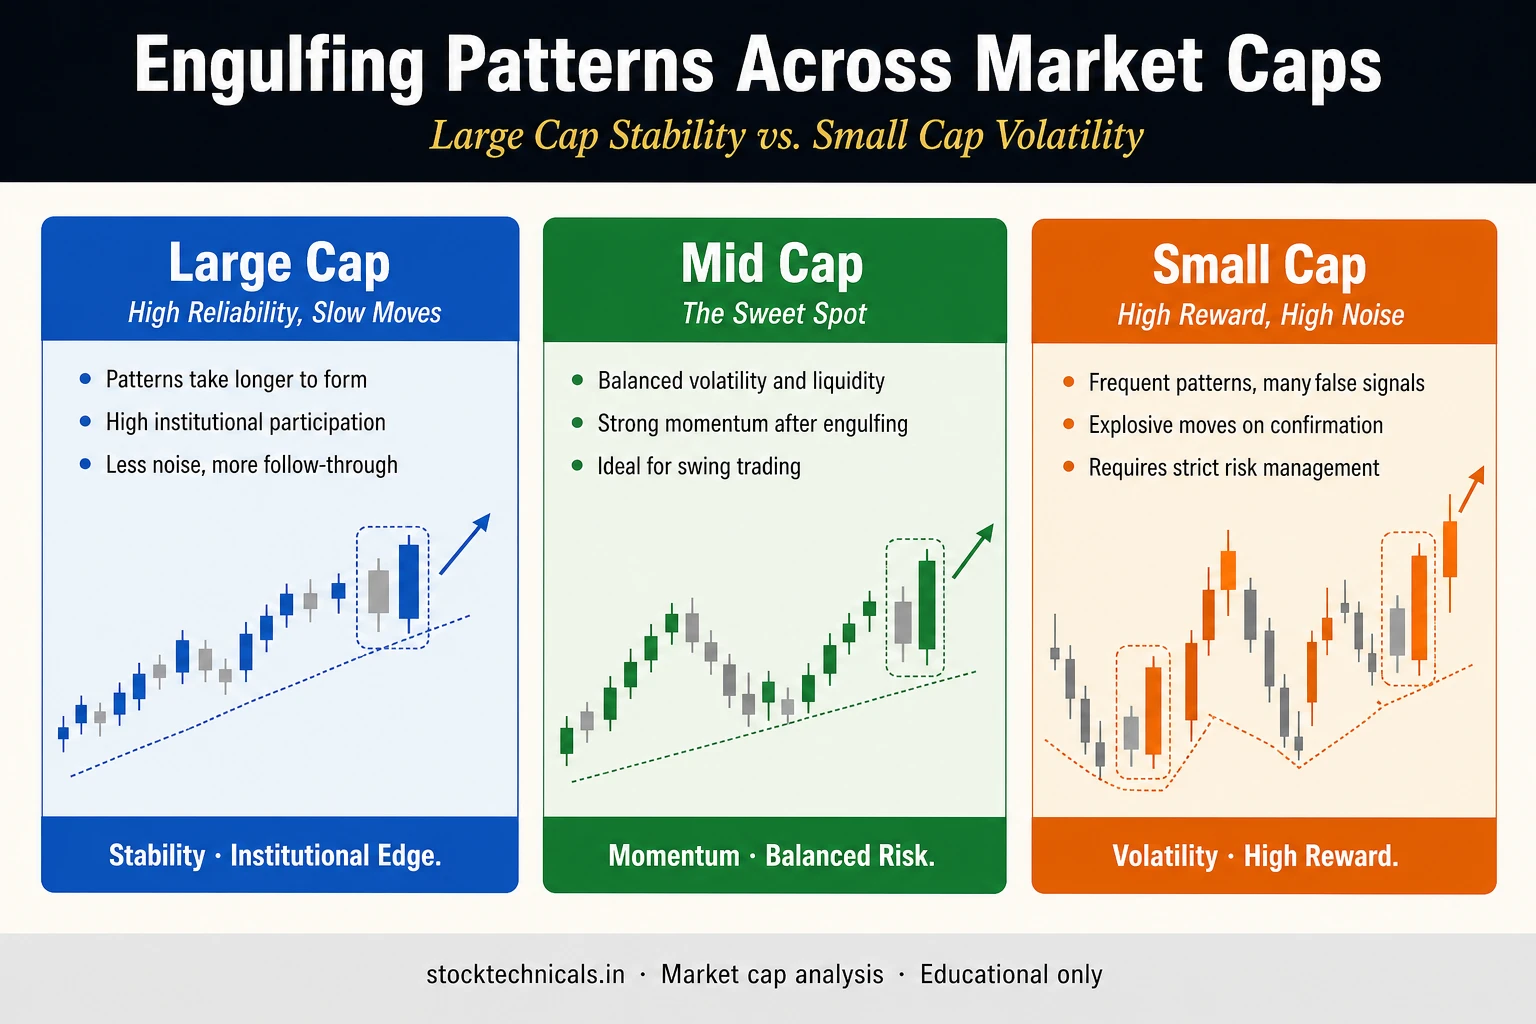
Bullish Engulfing Across Market Caps
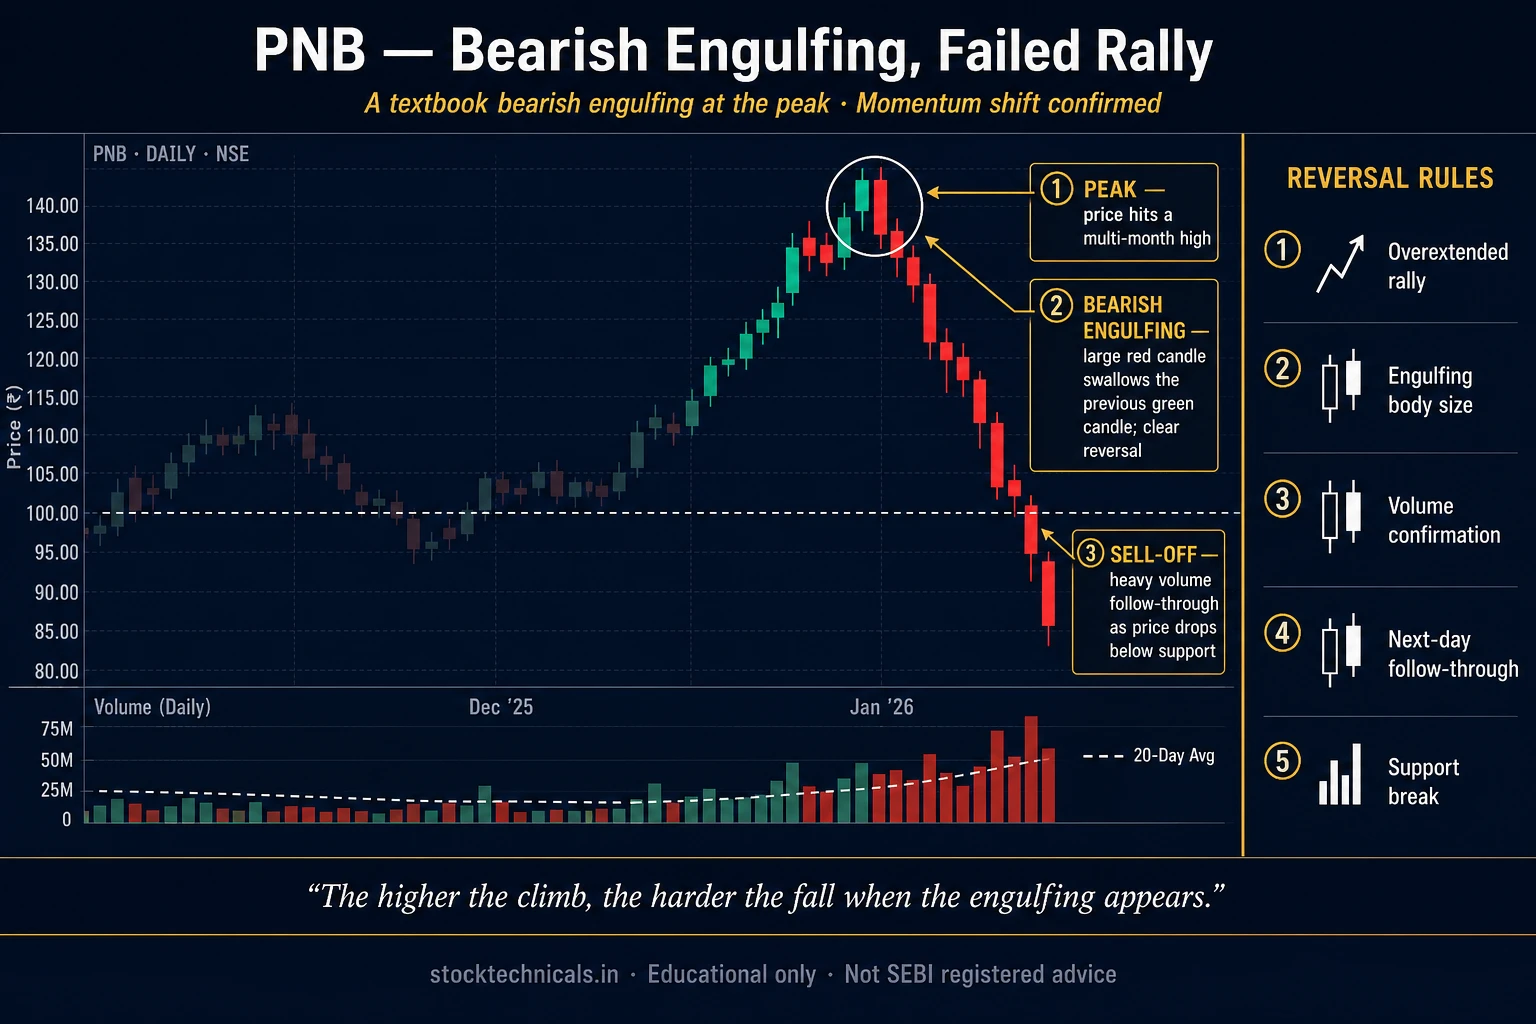
Bearish Engulfing: Mirror at the Top
Same stock, opposite signal: Bank of Baroda (NSE: BANKBARODA) appears in both the bullish engulfing (December 2021 bottom) and bearish engulfing (June 2024 top). This demonstrates that engulfing patterns are LOCATION-dependent, not stock-dependent. A stock can produce bullish engulfings at cyclical lows and bearish engulfings at cyclical highs within the same multi-year chart.
What Makes an Engulfing Pattern Strong
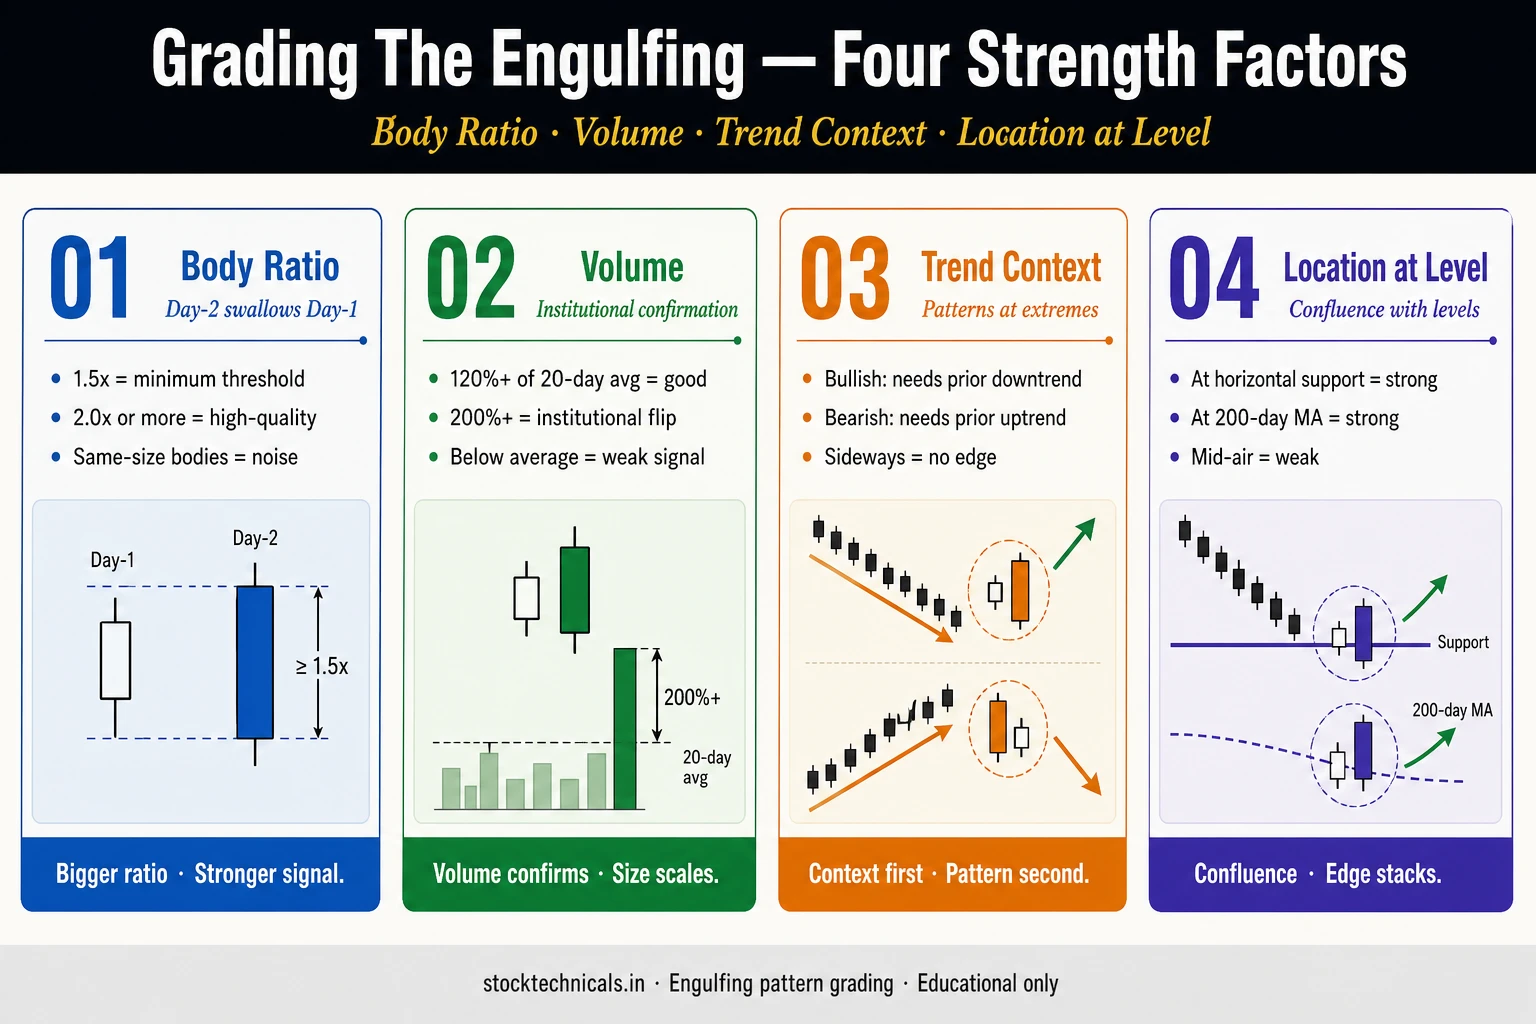
Body Size Ratio
The ratio of Day 2’s body to Day 1’s body measures conviction. Ratios above 5x indicate decisive dominance by one side. However, extremely high ratios (above 20x) can be misleading if Day 1 is essentially a doji with a tiny body — the ratio is mathematically inflated but practically meaningless.
Volume Confirmation (Use Trailing 20-Day Excluding Pattern Day)
Calculate the 20-day average volume using only the 20 days BEFORE the pattern day. Do not include the pattern day itself in the average — that would dilute the signal. A ratio above 1.5x indicates institutional participation. Below 1.0x suggests the move is retail-driven and less reliable.
Location at Support or Resistance
An engulfing at a knownsupport or resistance level carries structural weight. The BANKBARODA December 2021 pattern formed near Rs 77 support — confluence with the candle signal created the 31% rally.
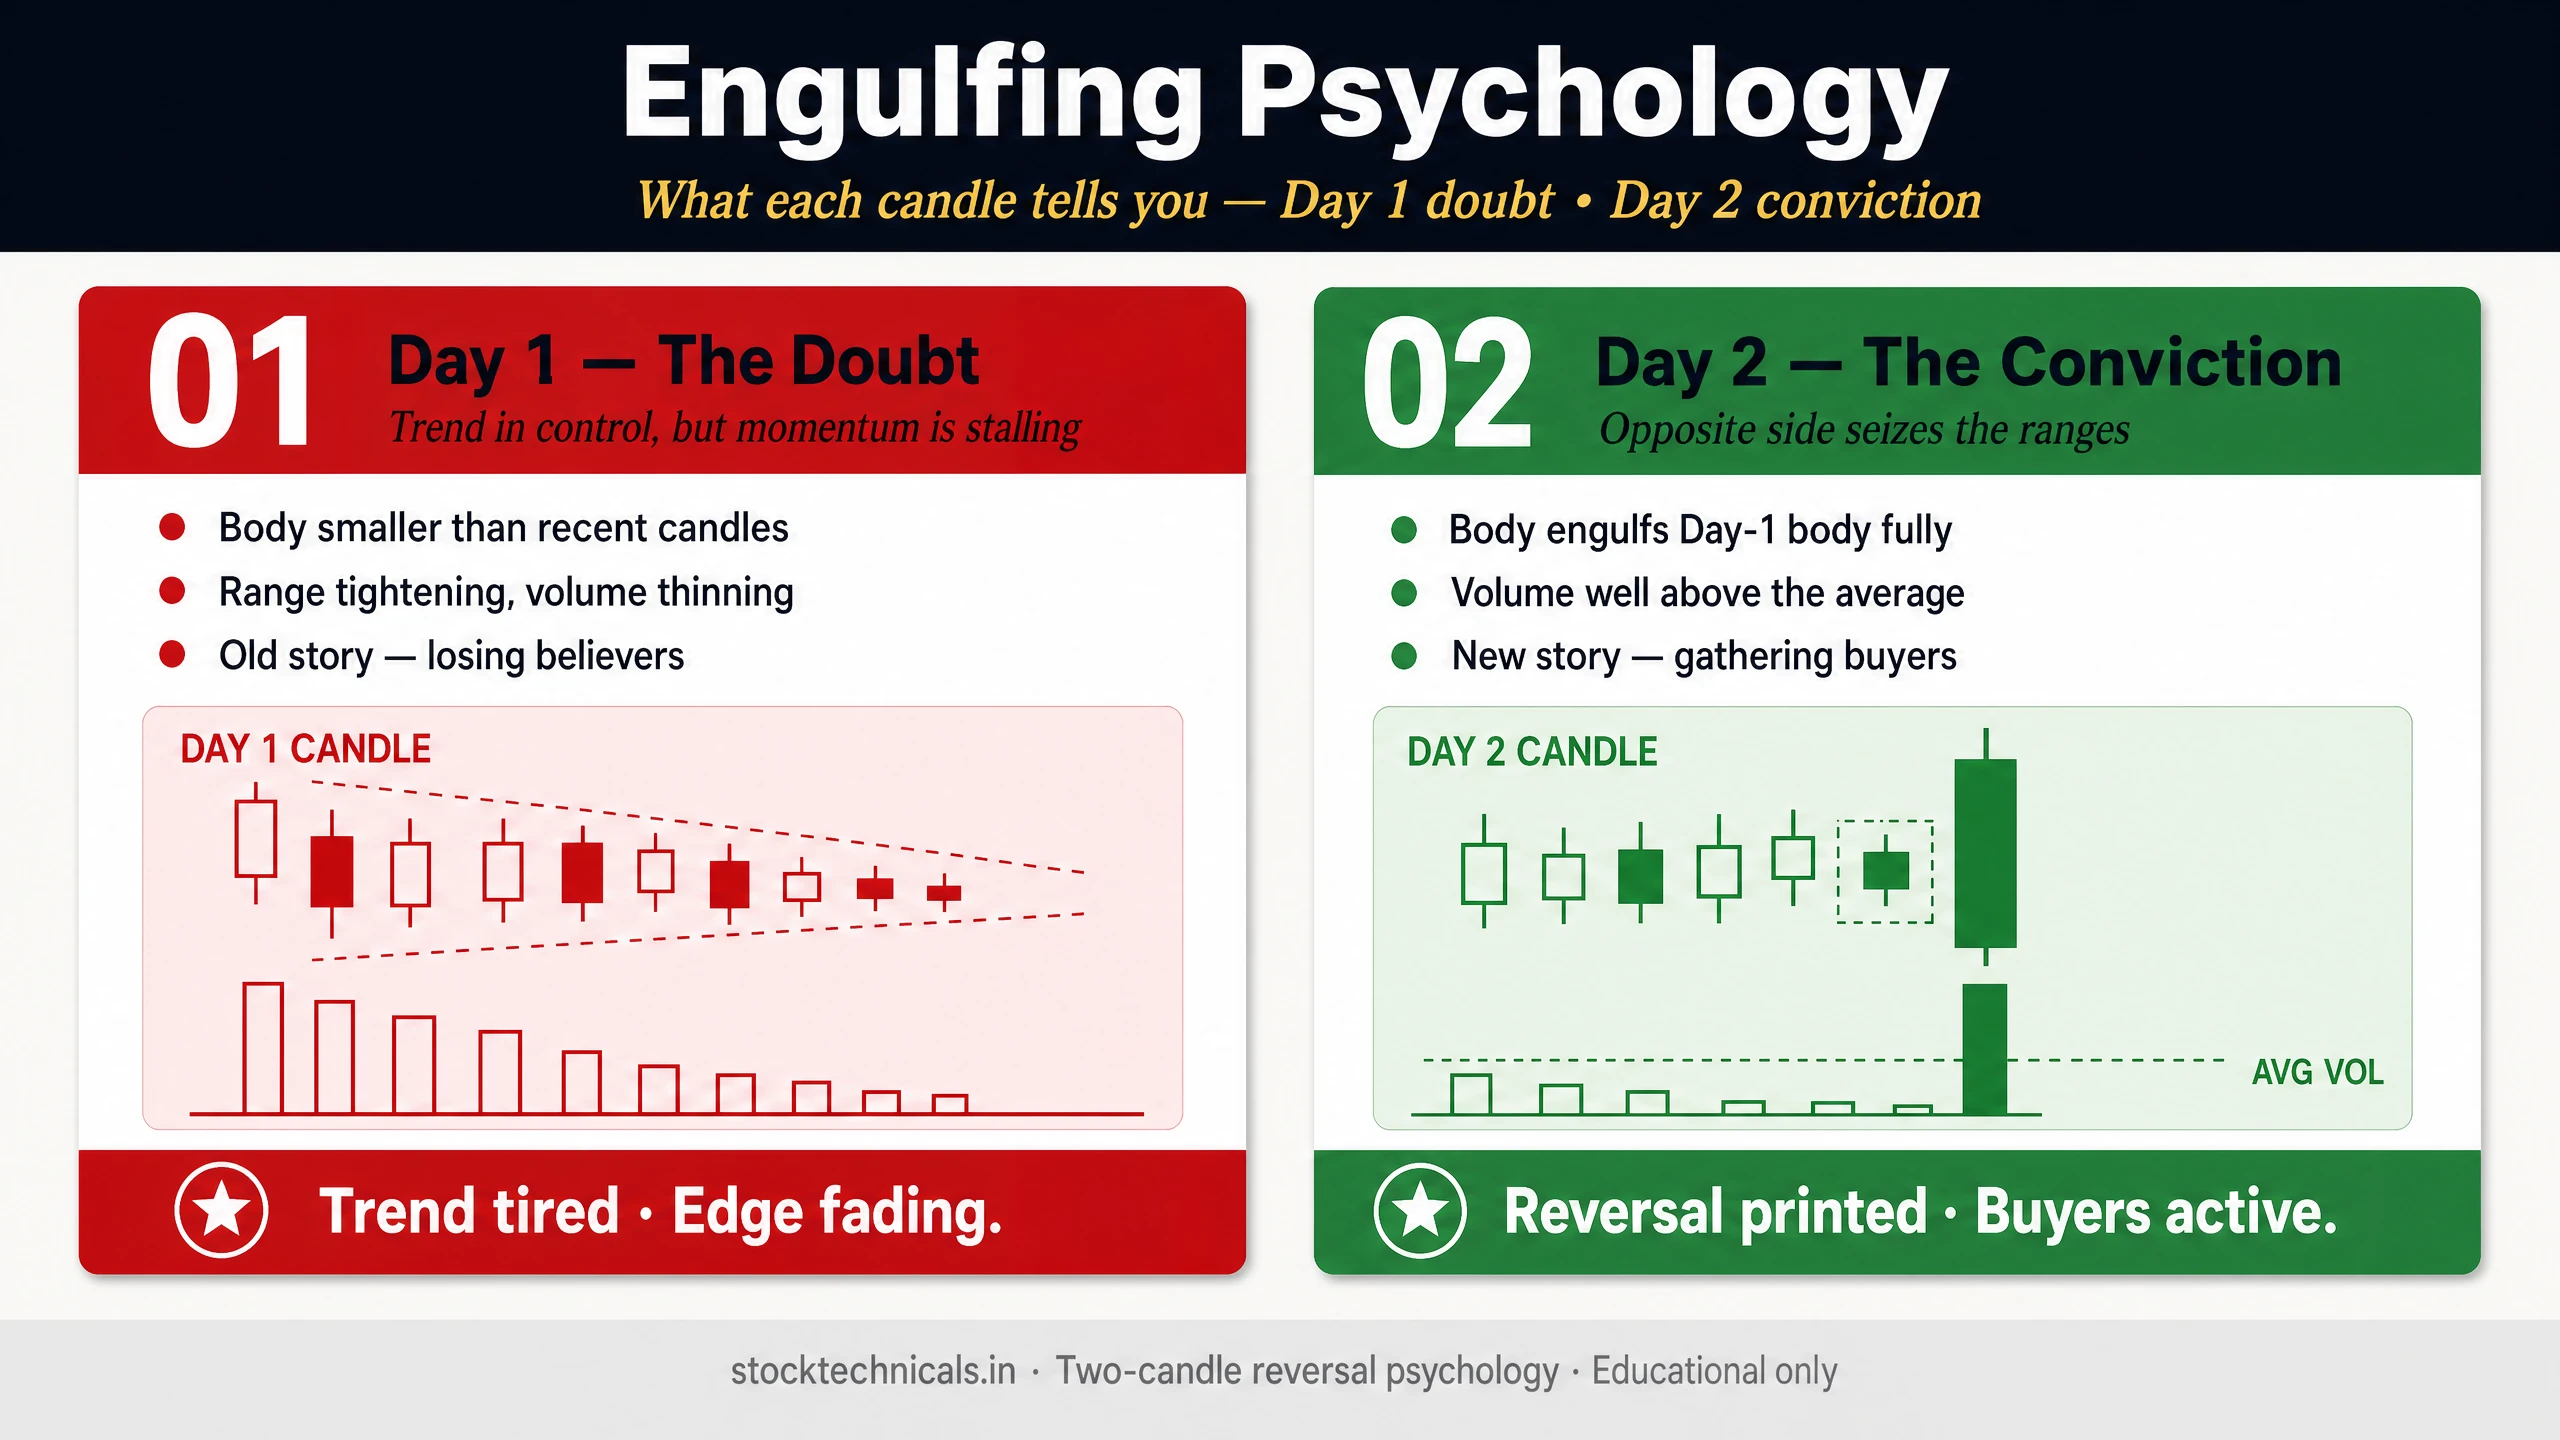
Engulfing Psychology: What Each Candle Tells You
Day 1: Trend Continuation (The Trap)
In a bullish engulfing setup, Day 1’s red candle reassures bears. Late sellers enter. Momentum traders add to shorts. The crowd commits to the prevailing direction exactly at the wrong moment. This is the setup for the trap.
Day 2: Capitulation and Reversal
Day 2 often opens at or below Day 1’s close — bears extend their victory briefly. Then institutional buying enters. Price rallies past Day 1’s high. Short-sellers cover. The move accelerates. By the close, Day 2’s green body has completely overwhelmed Day 1’s red body. The crowd that committed to shorts on Day 1 is now trapped and forced to buy back.
Day 3: Confirmation or Invalidation
Conservative traders wait for Day 3 to confirm. If Day 3 opens above Day 2’s close and holds, the reversal is validated. If Day 3 re-enters Day 2’s range, the pattern is weakening. If Day 3 closes below Day 2’s low, the engulfing has failed.
Engulfing Patterns on Different Timeframes
Daily (The Standard)
All examples in this article use daily charts. Daily is the sweet spot for swing traders — enough signal resolution without intraday noise. our audit shows 63% success rate reference is based on daily data.
Weekly (More Reliable)
Weekly engulfing patterns are rarer but more reliable. A weekly engulfing represents a full 5-day shift in sentiment, not a single session. Combined with the 40-week (200-day equivalent) SMA, a weekly engulfing at trend change can mark major cyclical turns.
Intraday and F&O Context
On 15-minute and hourly charts, engulfing patterns occur much more frequently but are noisier. For NSE F&O instruments, engulfing patterns on Tuesday expiry day (weekly expiry after SEBI’s September 1, 2025 change) carry additional weight because of forced position unwinding. Use strict volume filters and tighter stops on lower timeframes.
Position Sizing by Pattern Grade
Not every valid engulfing deserves the same capital allocation. Grade your setup and size accordingly:
A+ Setup (full size, 1% account risk): All 4 audit criteria pass + volume >1.5x average + at support/resistance + strong prior trend. Example: BANKBARODA Dec 2021 (+31.2%).
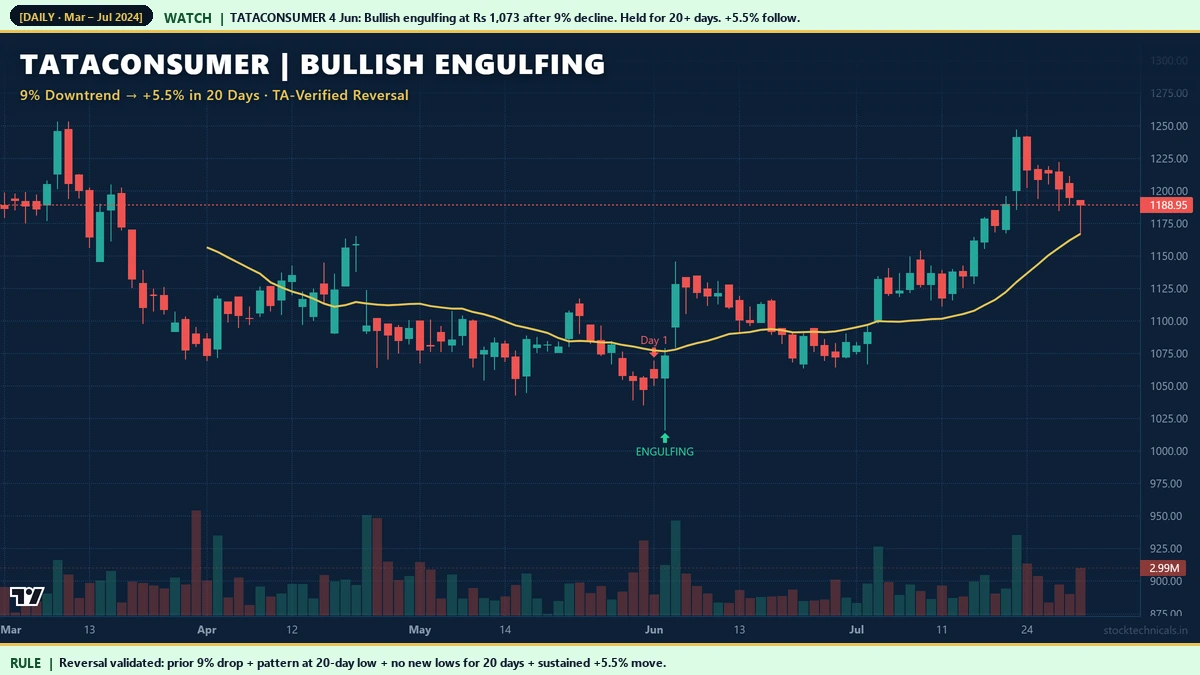
A Setup (standard size, 0.75% account risk): 4 audit criteria pass + volume 1.0-1.5x average. Example: TATACONSUMER Jun 2024 (+5.5%).
B Setup (reduced size, 0.5% account risk): Pattern valid but missing volume or location confluence. Wait for Day 3 confirmation.
C Setup (skip): Mid-trend engulfing, weak volume, or no clear prior trend. These are the 98% that fail the audit.
The Strongest Bearish Engulfing in Our Audit
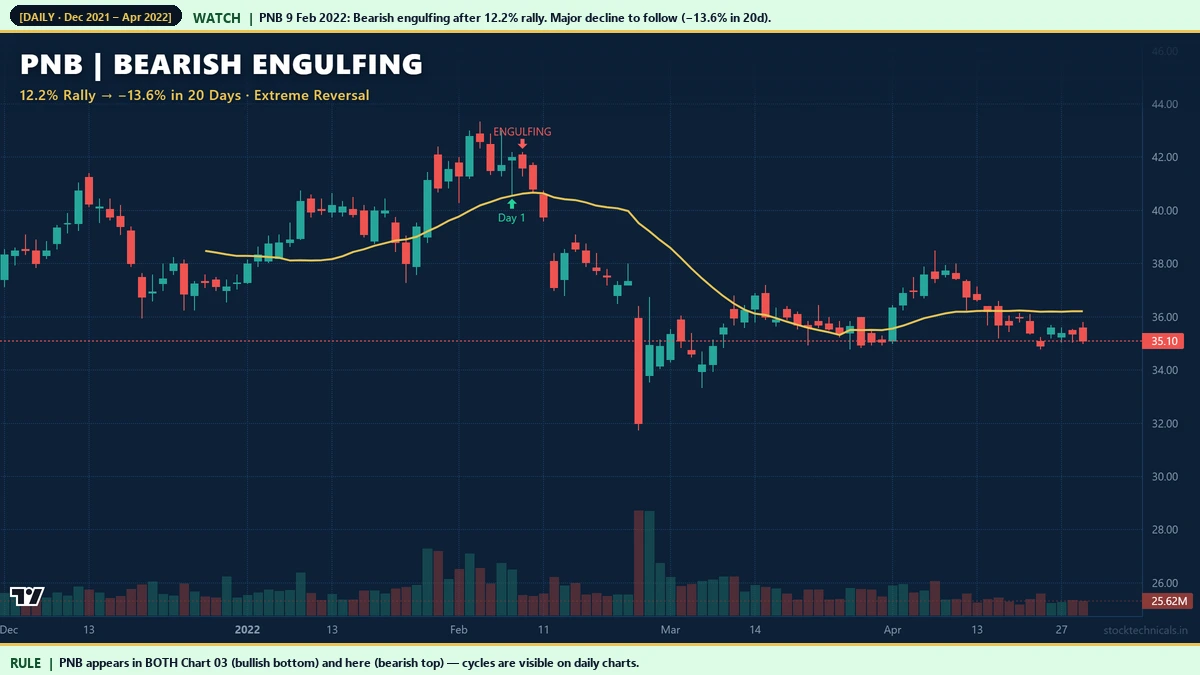
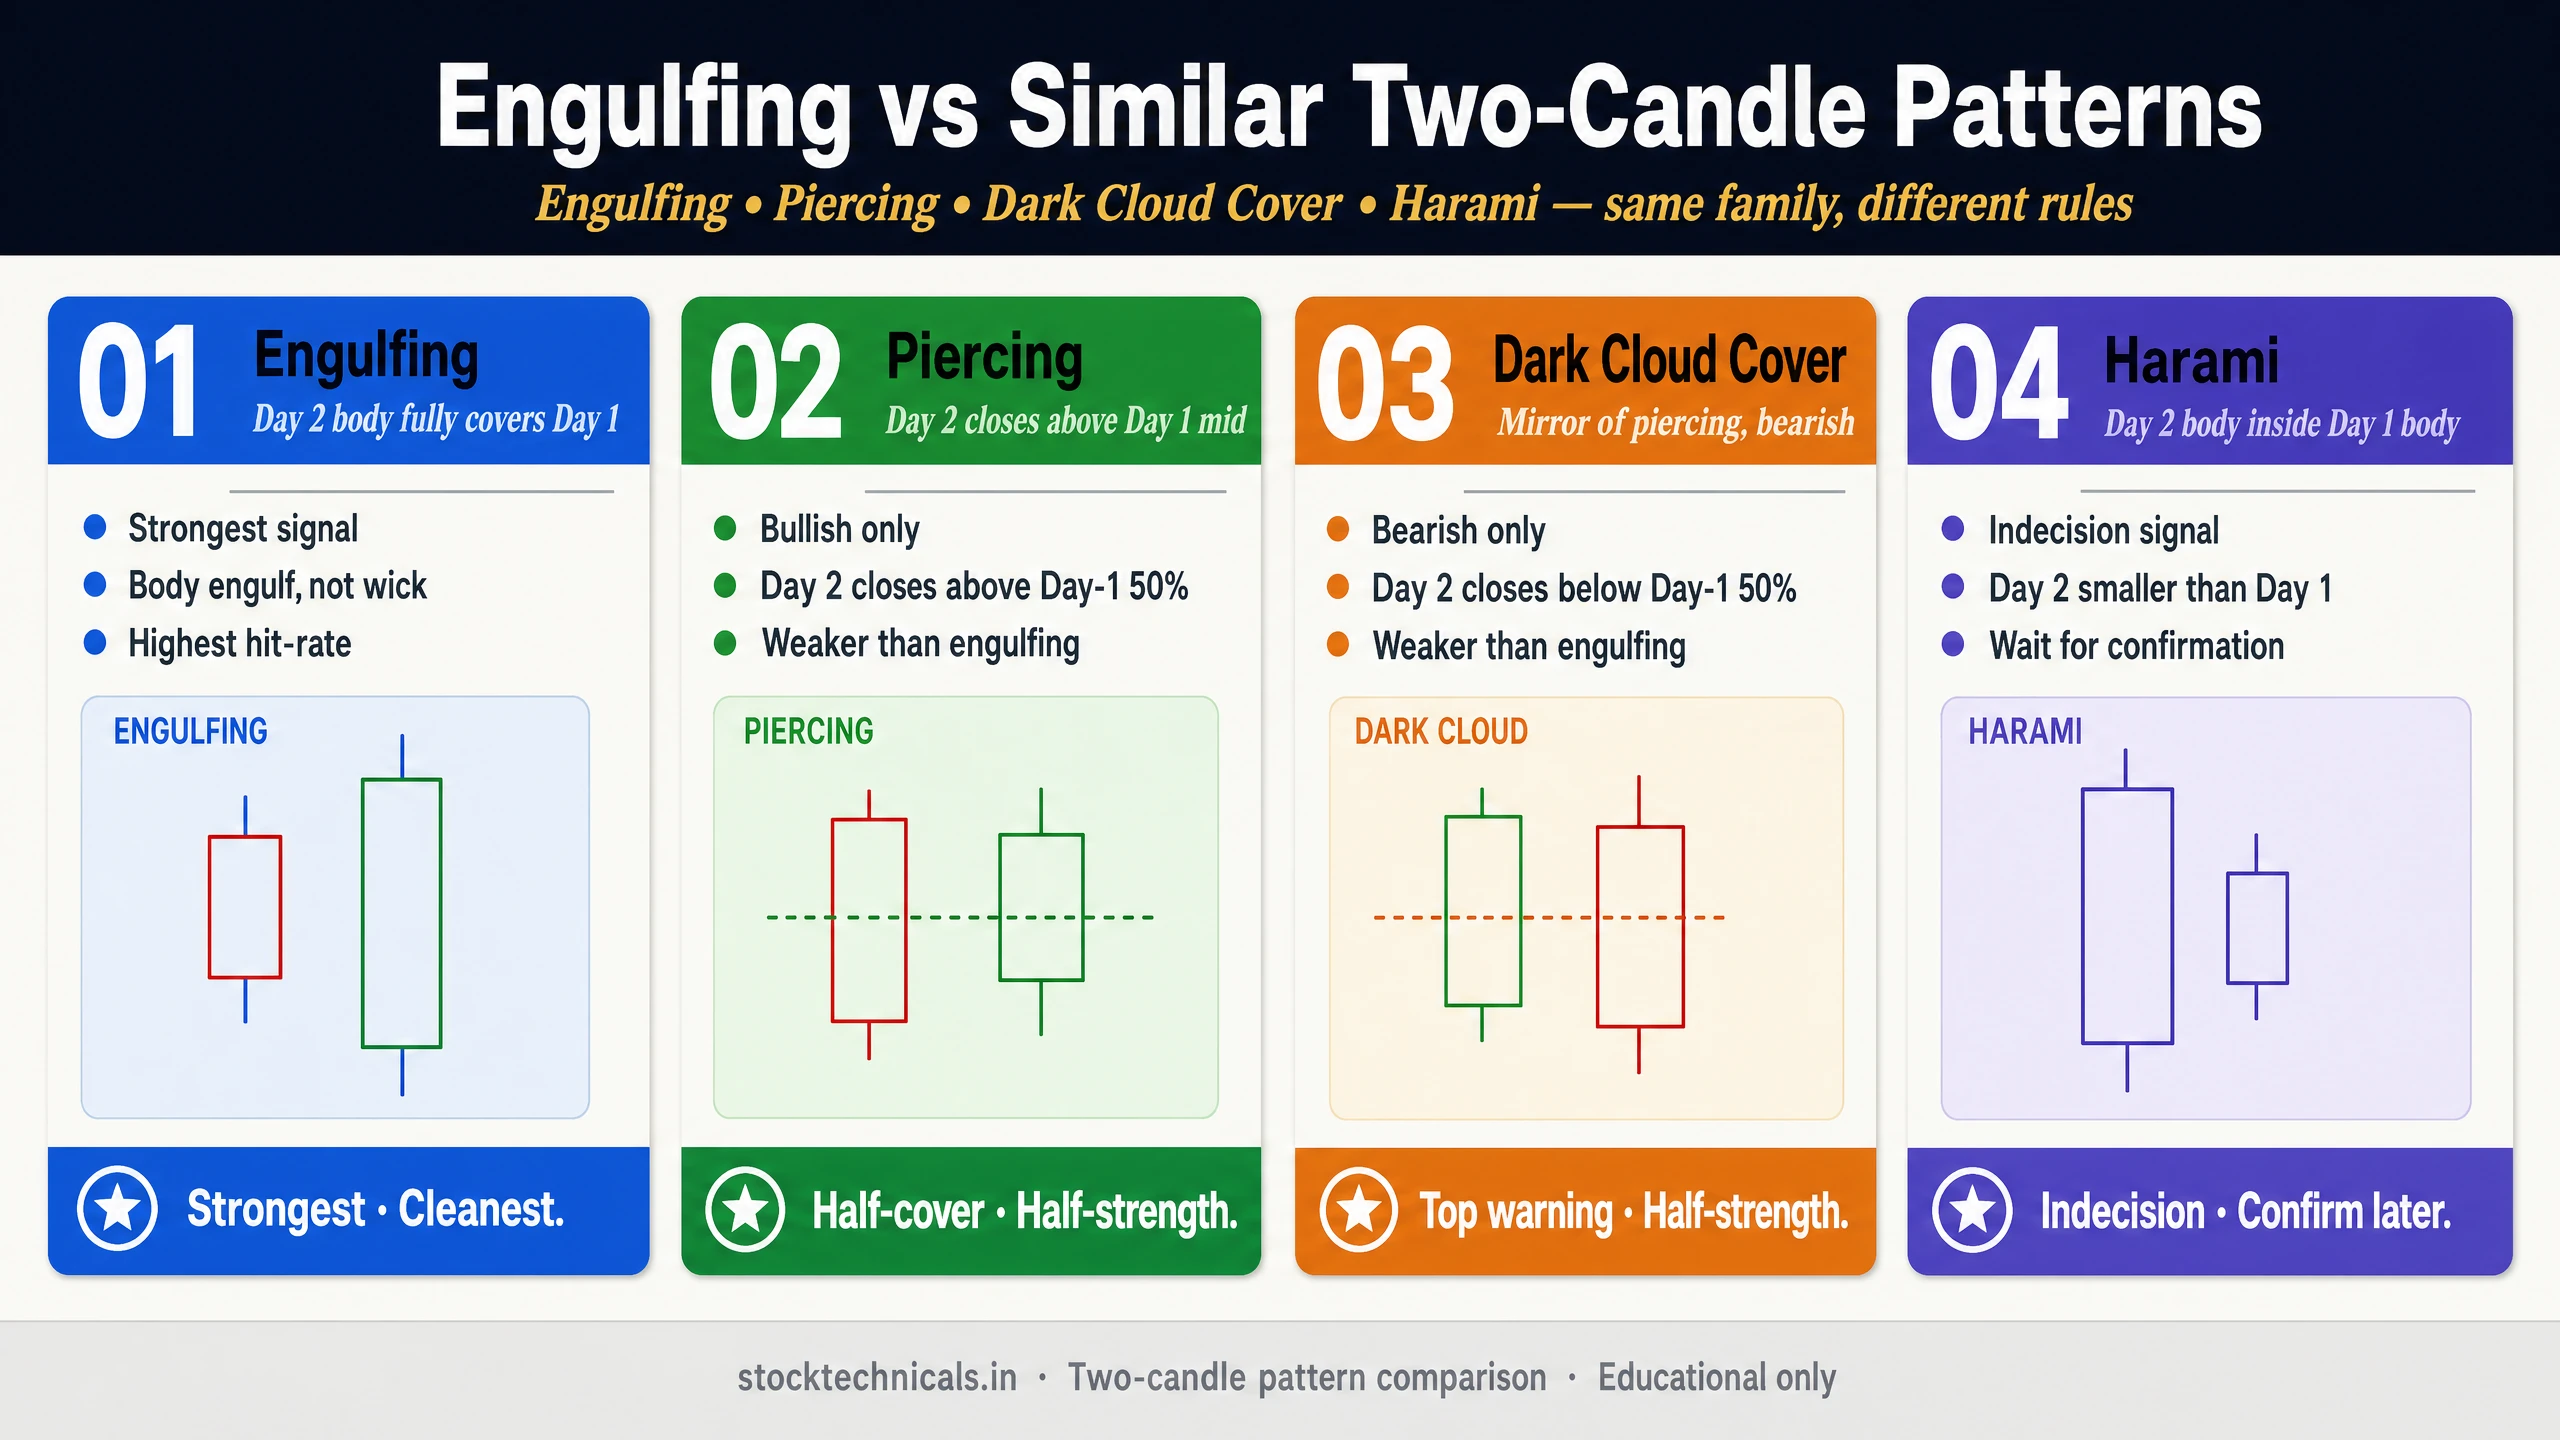
Engulfing vs Similar Two-Candle Patterns

Four two-candle reversal patterns look alike but have different rules. The engulfing is the strongest because Day 2 completely overpowers Day 1.Piercing Line andDark Cloud Cover are partial versions — same idea, less conviction. Harami is the opposite: the second candle is smaller than the first. Confusing harami with engulfing is a classic beginner error.
Common Mistakes to Avoid
Mistake: Trading Mid-Trend Engulfings
The biggest error: taking an engulfing signal without checking trend context. A geometric engulfing in the middle of an uptrend or downtrend is a continuation artifact, not a reversal. Our audit shows 98% of geometric engulfings fail the trend test.
Mistake: Counting Wick Coverage as Engulfment
The engulfing rule is body-to-body. If Day 2 body covers Day 1 body but wicks do not engulf, the pattern is valid. If wicks cover but bodies do not fully engulf, the pattern is invalid.
Mistake: Ignoring Volume
An engulfing without volume is a visual pattern, not a conviction signal. Always verify volume on Day 2 against the 20-day trailing average (excluding the pattern day).
Mistake: No Stop Loss Before Entry
Even textbook engulfings fail 37% of the time per our audit. Entry without a predefined stop loss is gambling. Place stop at Day 2’s low (bullish engulfing) or high (bearish engulfing). If breached, the pattern has invalidated.
Complete Trading Plan
Entry Rules
Conservative: Enter on Day 3 open if it confirms direction.Aggressive: Enter at Day 2 close. Conservative misses some profit but avoids more failed trades.
Stop Loss
Bullish engulfing: stop below Day 2 low. Bearish engulfing: stop above Day 2 high. If breached, pattern is invalidated.
Target
First target: next support/resistance level. Minimum 2:1 risk-reward ratio. Trail stop to break-even once price moves 1:1 in your favour. Scale out at 1:1 to lock in partial profits.
Interactive Tool
Engulfing Pattern Validator
Enter your pattern details to check if it qualifies as a valid engulfing setup
Q1: In a bullish engulfing, which statement is correct?
Q2: Where should a bullish engulfing appear for maximum reliability?
Q3: A bearish engulfing has a body ratio of 71.5x. What does this tell you?
Q4: MARUTI prints a bullish engulfing with 14.8x body ratio and 1.7x volume. What is missing?
Q5: TCS shows a bearish engulfing (17.8x body, 1.7x volume) but price rallied +8.29% in 5 days. Why?
Educational tool only. Not investment advice. Always verify patterns against your own analysis and risk management rules before trading. Past patterns do not guarantee future results.
The Bottom Line About Engulfing Patterns
The engulfing pattern is one of the most useful candlestick signals — but only when you apply the full validation filter. our audit shows data shows 63% success on daily charts. Our NSE audit shows 1.2% of geometric engulfings pass a strict 4-criterion test. The difference between those two numbers is where most losing trades come from.
Trade only engulfings that form at a 20-day extreme, after a clear 5%+ trend, with volume confirmation. Skip the rest. The 98% of engulfings that fail the audit are noise dressed up as signal — and the chart-pattern industry has a long tradition of showing you the 2% that worked without mentioning the 98% that did not.
SEBI data shows 91% of individual F&O traders lose money. Most of those losses come from trading without context, without stops, and without edge verification. The engulfing gives you a clear visual edge — but only when you use the full filter and size appropriately.
Frequently Asked Questions
| Type | Candle 1 | Candle 2 | Trade context |
|---|---|---|---|
| Bullish Engulfing | Small red | Large green engulfing red body | Buy at support after downtrend |
| Bearish Engulfing | Small green | Large red engulfing green body | Short at resistance after uptrend |
| Outside Bar (Bullish) | Inside red | Green with higher high + lower low | Strong bullish reversal |
| Outside Bar (Bearish) | Inside green | Red with higher high + lower low | Strong bearish reversal |
What is the actual success rate of the bullish engulfing pattern?
Thomas our audit research on daily chart data shows the bullish engulfing has a 63% reversal success rate (rank 22 of 103 patterns). However, this is the rate for geometric matches. When you filter for valid trend context and sustained follow-through, our NSE audit of 282 stocks showed only 1.2% of engulfings qualify as true reversals.
Do wicks need to be engulfed for a valid engulfing pattern?
No. The rule is body-to-body only. The real body (open to close) of Day 2 must cover the real body of Day 1. Wicks are irrelevant to the definition. This is the most common beginner misconception.
How do I calculate volume ratio for confirmation?
Calculate the 20-day average volume EXCLUDING the pattern day itself. Use the 20 trading days before the pattern. A ratio above 1.5x indicates institutional participation. Below 1.0x suggests retail-driven movement and lower reliability.
Why do so many engulfing patterns fail in Indian markets?
Most engulfings fail because they form mid-trend, not at trend extremes. Our audit of 4,277 NSE engulfings found only 51 passed the 4-criterion test (prior trend, location, no new extreme, sustained move). Always check trend context before trading a geometric match.
Can engulfing patterns work on weekly and intraday charts?
Yes, with adjustments. Weekly engulfings are rarer but more reliable (full 5-day sentiment shift). Intraday engulfings (15-min, 1-hour) are more frequent but noisier. For NSE F&O instruments, engulfing on Tuesday weekly expiry carries extra weight due to position unwinding.
What is the difference between engulfing and harami patterns?
They are mirror opposites. In engulfing, Day 2 body is LARGER and covers Day 1. In harami, Day 2 body is SMALLER and is contained within Day 1. Engulfing is a stronger reversal signal than harami.
How should I size positions on engulfing trades?
Grade the setup: A+ (all criteria plus volume plus S/R) gets full size at 1 percent account risk. A (4 criteria plus moderate volume) gets 0.75 percent. B (4 criteria but no volume or location) gets 0.5 percent. C (mid-trend or weak context) should be skipped entirely.
Continue Learning
For three-candle reversals:Morning Star and Evening Star — our audit ranks morning star 6/103 at 78% success, the strongest three-candle pattern.
For single-candle reversals:Shooting Star vs Inverted Hammer — same candle shape, opposite signals based on location.
For context tools:Support and Resistance — the framework for identifying where engulfings are most reliable.
For volume analysis:Volume in Trading — why the 1.5x trailing-average threshold matters and how to calculate it correctly.
Markets are unpredictable, capital is finite, and no candlestick pattern — including the engulfing — guarantees a profitable trade. Textbook engulfings still fail often. The examples in this article use real historical data but past performance does not predict future results. Always define your stop loss before entering, never risk more than you can afford to lose, and verify every setup against your own analysis.