
The Commodity Channel Index (CCI) is a momentum oscillator built by Donald Lambert in 1980 that measures how far the current price is from its statistical average. Readings above +100 signal strong bullish momentum, below −100 signal strong bearish momentum, and the zero line is a momentum equilibrium. Despite the name, CCI works just as well on Nifty 50, Bank Nifty, and individual stocks as it does on commodities.
Intermediate traders who want an unbounded momentum oscillator. CCI’s no-ceiling design makes it particularly useful in strong trending markets where RSI and Stochastic get pinned at their limits. Best on 15-minute and higher timeframes for Nifty 50, Bank Nifty, and large-cap stocks like Reliance, TCS, HDFC Bank.
CCI was designed for commodity futures — hence the name — but its logic is instrument-agnostic. The indicator answers a single question: how far is today’s typical price from its own 20-period average, measured in mean deviations? A reading of +100 means price is 1.5 mean deviations above average and +200 means 3, which in practice looks like a fast rally. A reading of −250 looks like a crash.
The unbounded scale is CCI’s main advantage. RSI and Stochastic max out at 100; CCI doesn’t, which means it still gives you information when price is in a runaway move. That’s why CCI stays in the toolkits of many Indian intraday and swing traders even though newer indicators have come along.
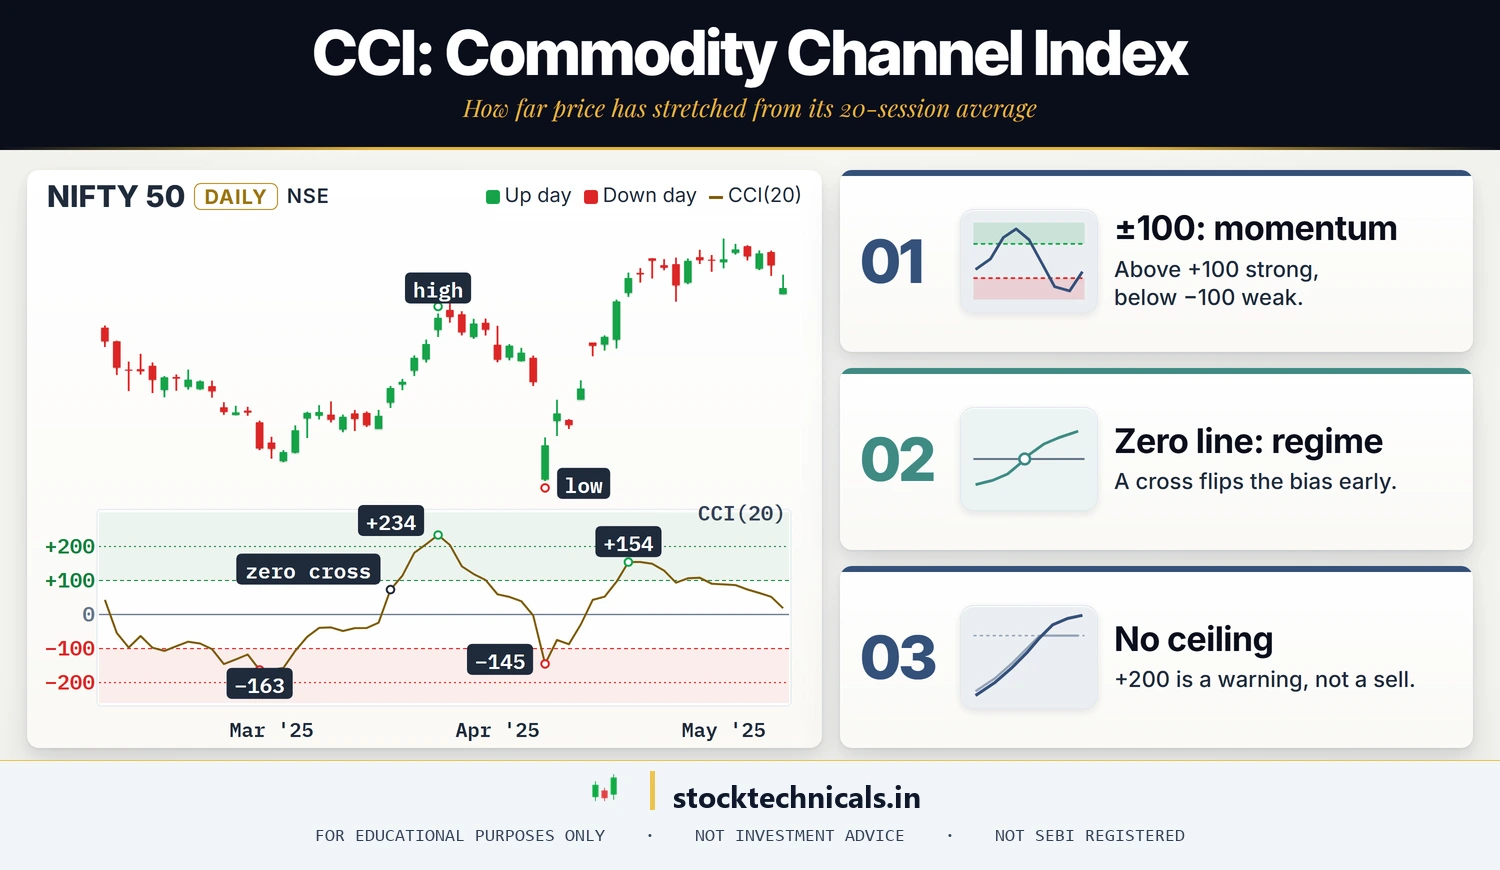
- Formula: CCI = (Typical Price − SMA of Typical Price) / (0.015 × Mean Deviation), default 20 periods.
- Key thresholds: +100 bullish momentum, +200 extreme, 0 neutral, −100 bearish momentum, −200 extreme.
- The zero-line cross is a cleaner trend signal than ±100 crosses in range-bound tapes.
- In strong trends, CCI will stay above +100 (or below −100) for extended stretches — that’s strength, not a reversal signal.
- CCI is unbounded, which is both its advantage (keeps working in runaway moves) and its risk (no ceiling to stop you from over-reading an extreme).
The CCI formula, decoded
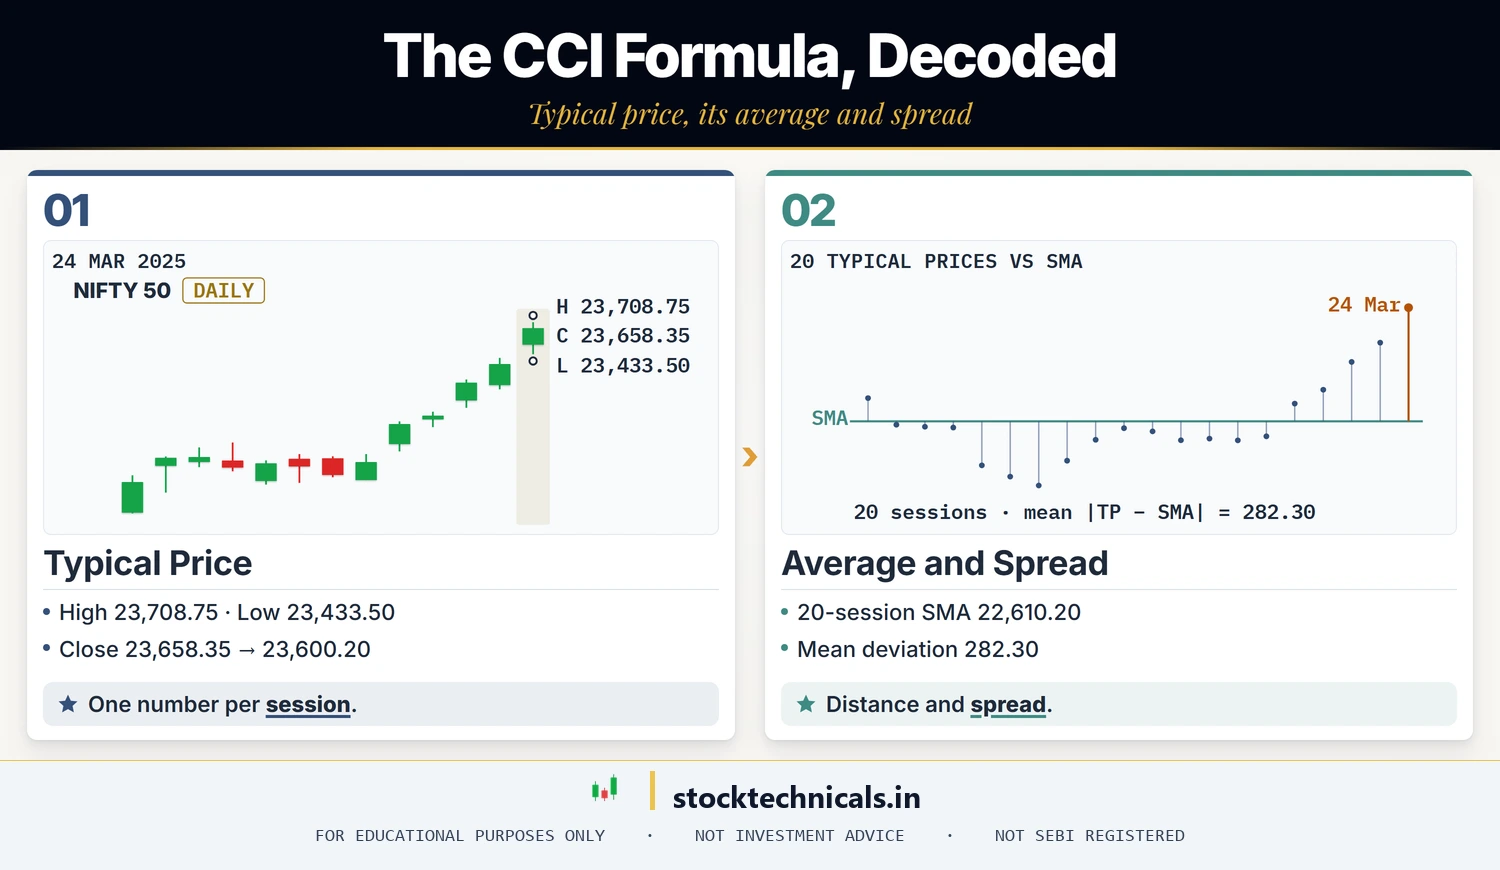
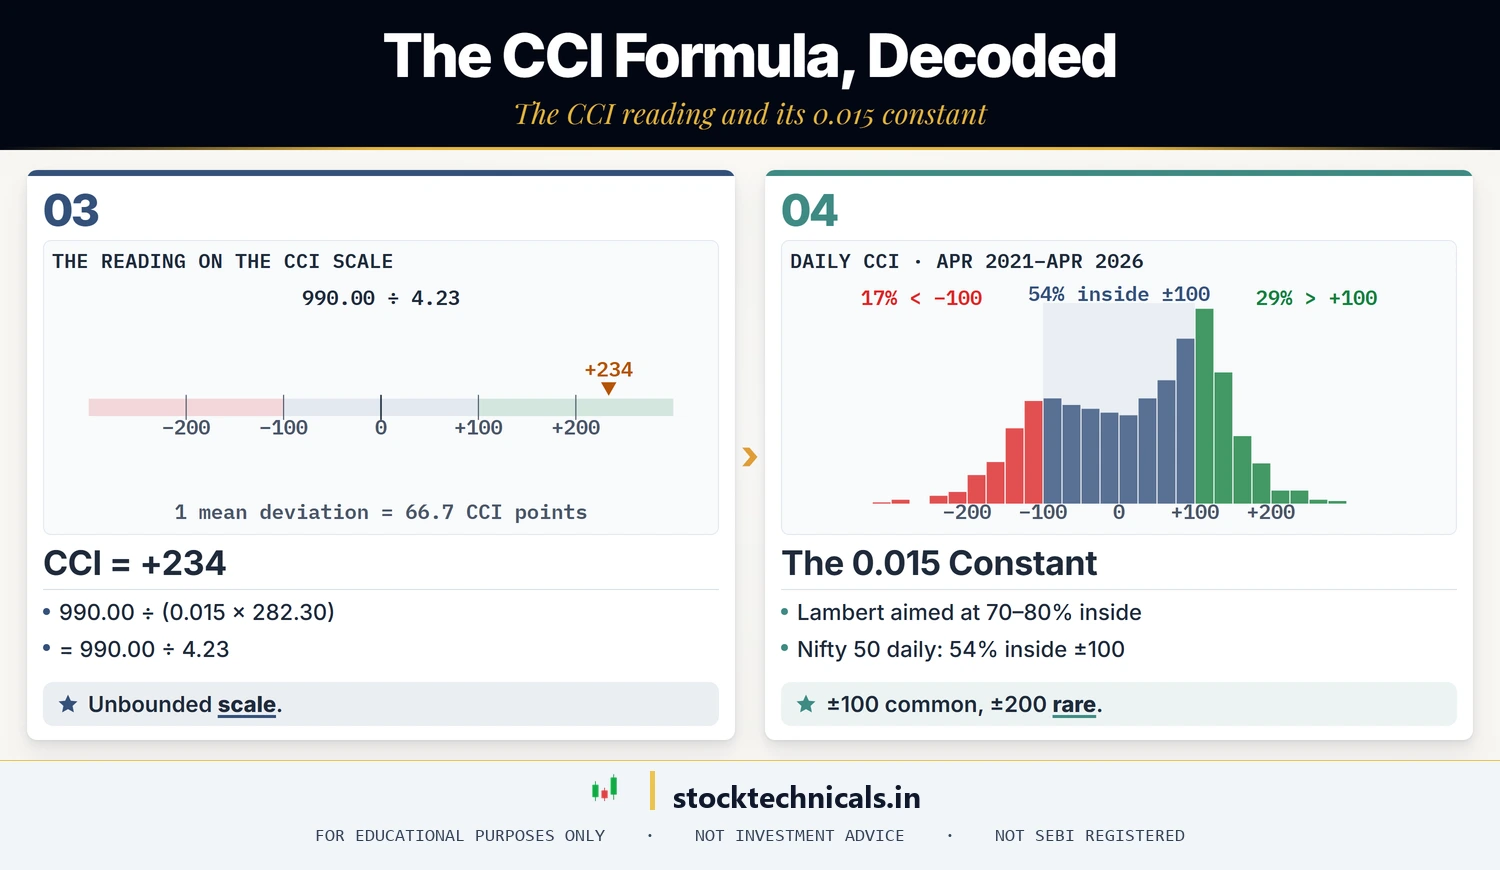
Three steps. You’ll never compute this by hand — every platform does it — but understanding the pieces helps you read the number:
- Typical Price for each period = (High + Low + Close) / 3.
- 20-period SMA of the Typical Price.
- CCI = (Typical Price − SMA) / (0.015 × Mean Absolute Deviation from SMA over 20 periods).
Lambert chose the 0.015 constant so that roughly 70–80% of values would land between −100 and +100. On daily Nifty 50 data from 2021 to 2026 the figure is lower, about 54%. That’s where the famous thresholds come from — not from theory, but from Lambert’s empirical observation.
How to read CCI on a live chart
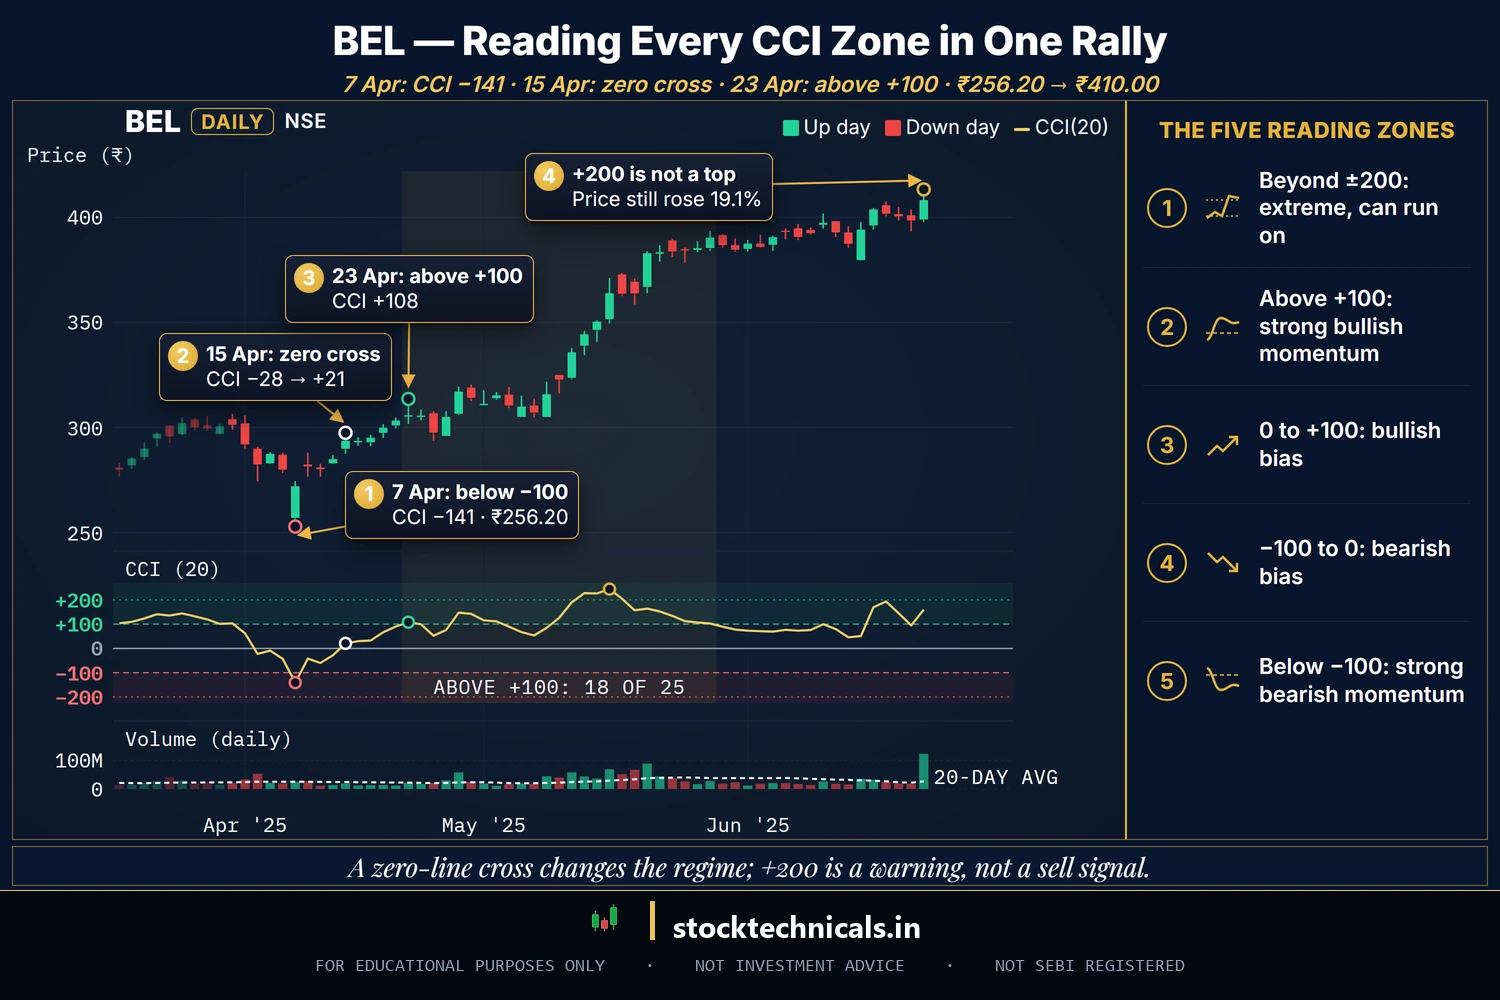
Chart window: Mar 2025–Jun 2025 · Data refreshed 10 Apr 2026 · Source: NSE (daily OHLC)
- Above +100 — strong bullish momentum. In a range, consider exits; in a trend, stay with the trade.
- 0 to +100 — bullish bias, normal trend territory.
- −100 to 0 — bearish bias, normal downtrend territory.
- Below −100 — strong bearish momentum.
- Above +200 or below −200 — statistical extreme. Reversal risk rises but can continue much further in big trends.
The zero-line cross is underrated. Crossing zero upward is a momentum regime change from bearish to bullish. Zero-line crosses on higher timeframes (daily, weekly) are particularly strong because they filter out intraday noise.
Three CCI signals worth trading
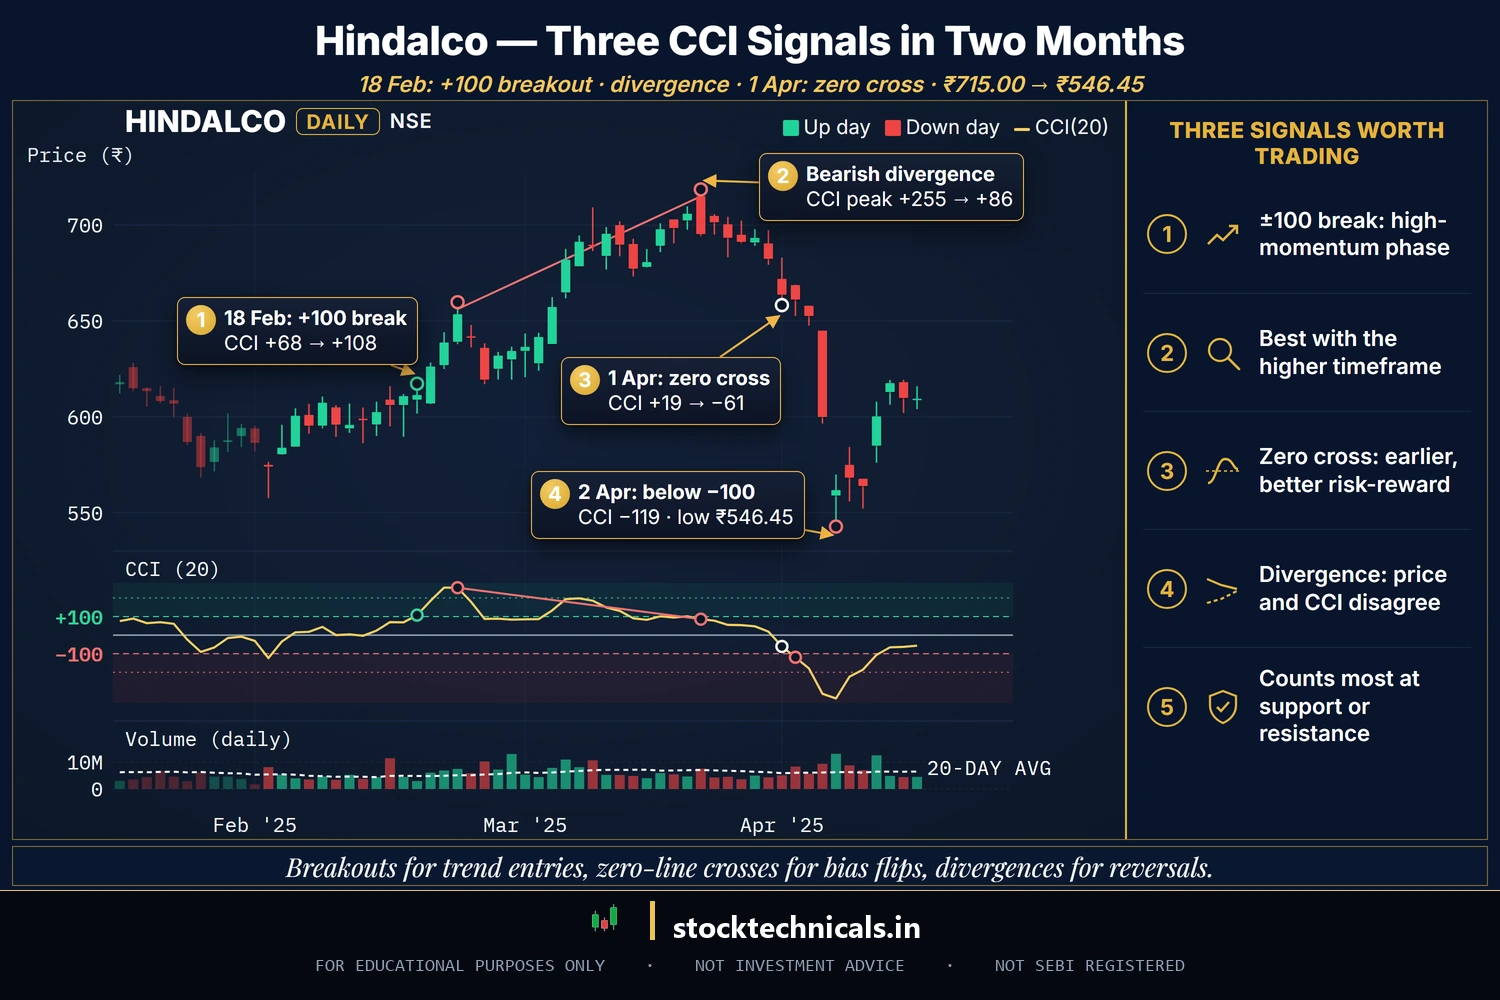
Chart window: Jan 2025–Apr 2025 · Data refreshed 10 Apr 2026 · Source: NSE (daily OHLC)
1. ±100 breakout
CCI crossing above +100 after trading in the middle range is a bullish breakout signal. Crossing below −100 is bearish. These crosses mark the start of a high-momentum phase. Best used when the higher timeframe is trending in the same direction.
2. Zero-line cross
A zero-line cross in the direction of the higher-timeframe trend is a cleaner swing-entry signal than a ±100 break, because it fires earlier and gives better risk-reward.
3. Divergence
Bullish divergence: price prints a lower low but CCI prints a higher low. Bearish divergence: price prints a higher high but CCI prints a lower high. CCI divergences on the daily chart at horizontal support/resistance are among the most reliable reversal signals in momentum trading.
CCI strategies that actually trade
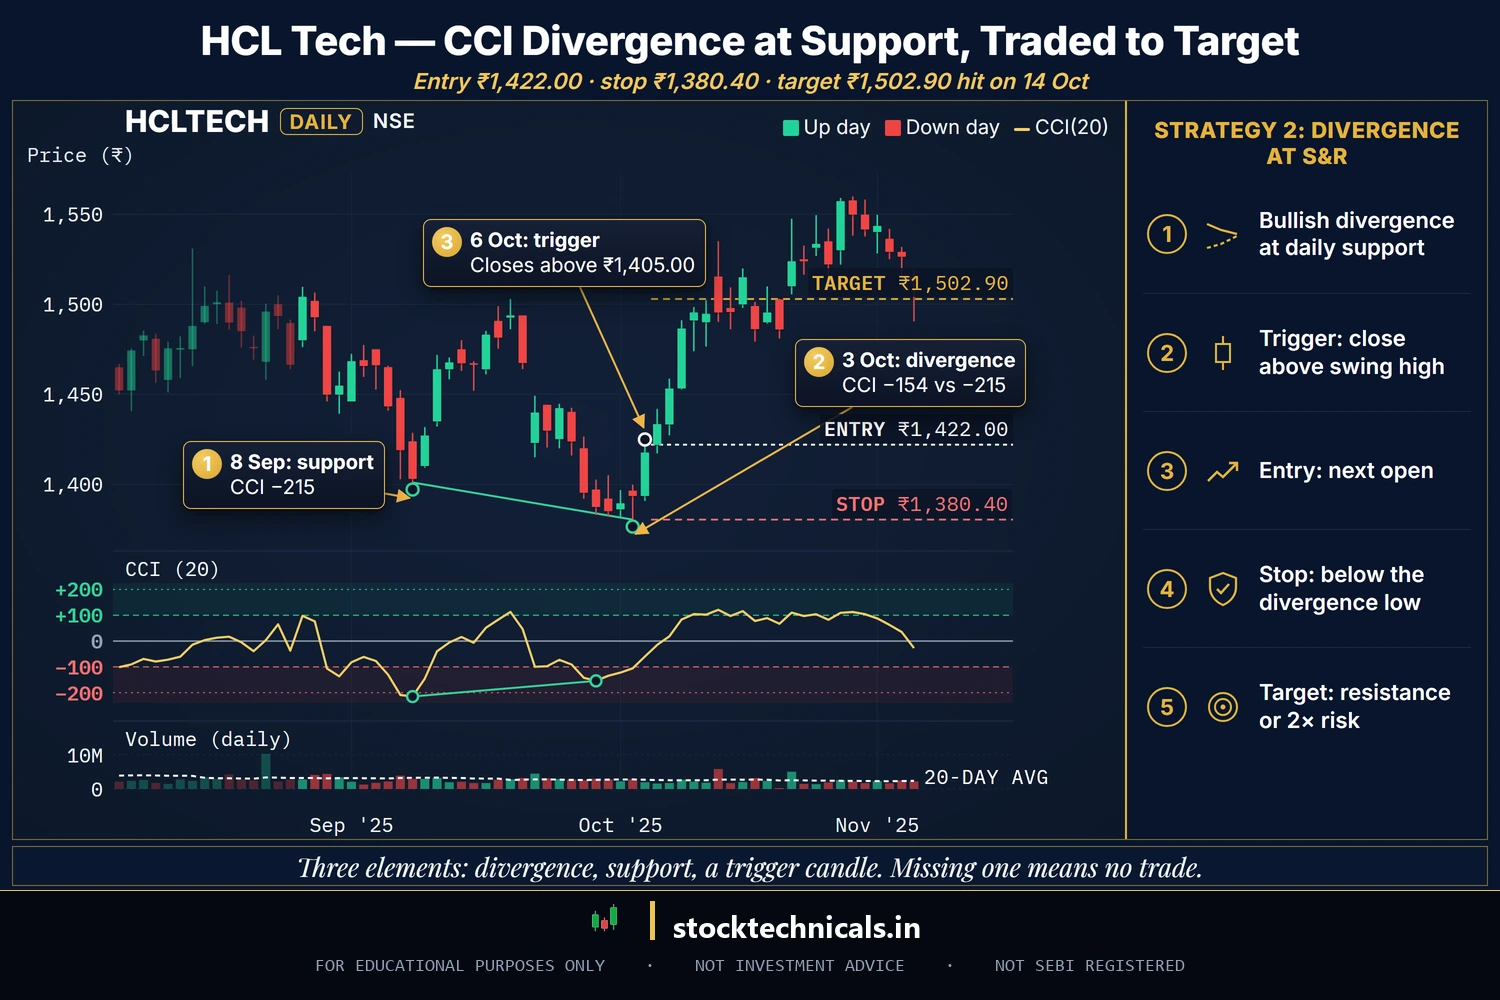
Chart window: Aug 2025–Nov 2025 · Data refreshed 10 Apr 2026 · Source: NSE (daily OHLC)
When daily CCI is above 0 (bullish regime), wait for the hourly CCI to dip below +100 and then re-cross above it. That dip-and-reclaim is a continuation entry.
- Entry: next candle close after CCI crosses back above +100
- Stop: below the swing low of the dip candle
- Target 1: recent swing high; trail with Kijun-sen or 20 EMA
Bullish divergence between price and CCI at a horizontal support zone on the daily chart. Requires three elements — all three must be present.
- Trigger: bullish candle closes above the prior swing high intraday
- Entry: next open after the trigger candle
- Stop: below the divergence low
- Target: previous resistance zone or 2× risk, whichever comes first
Setting up CCI on TradingView and Zerodha Kite
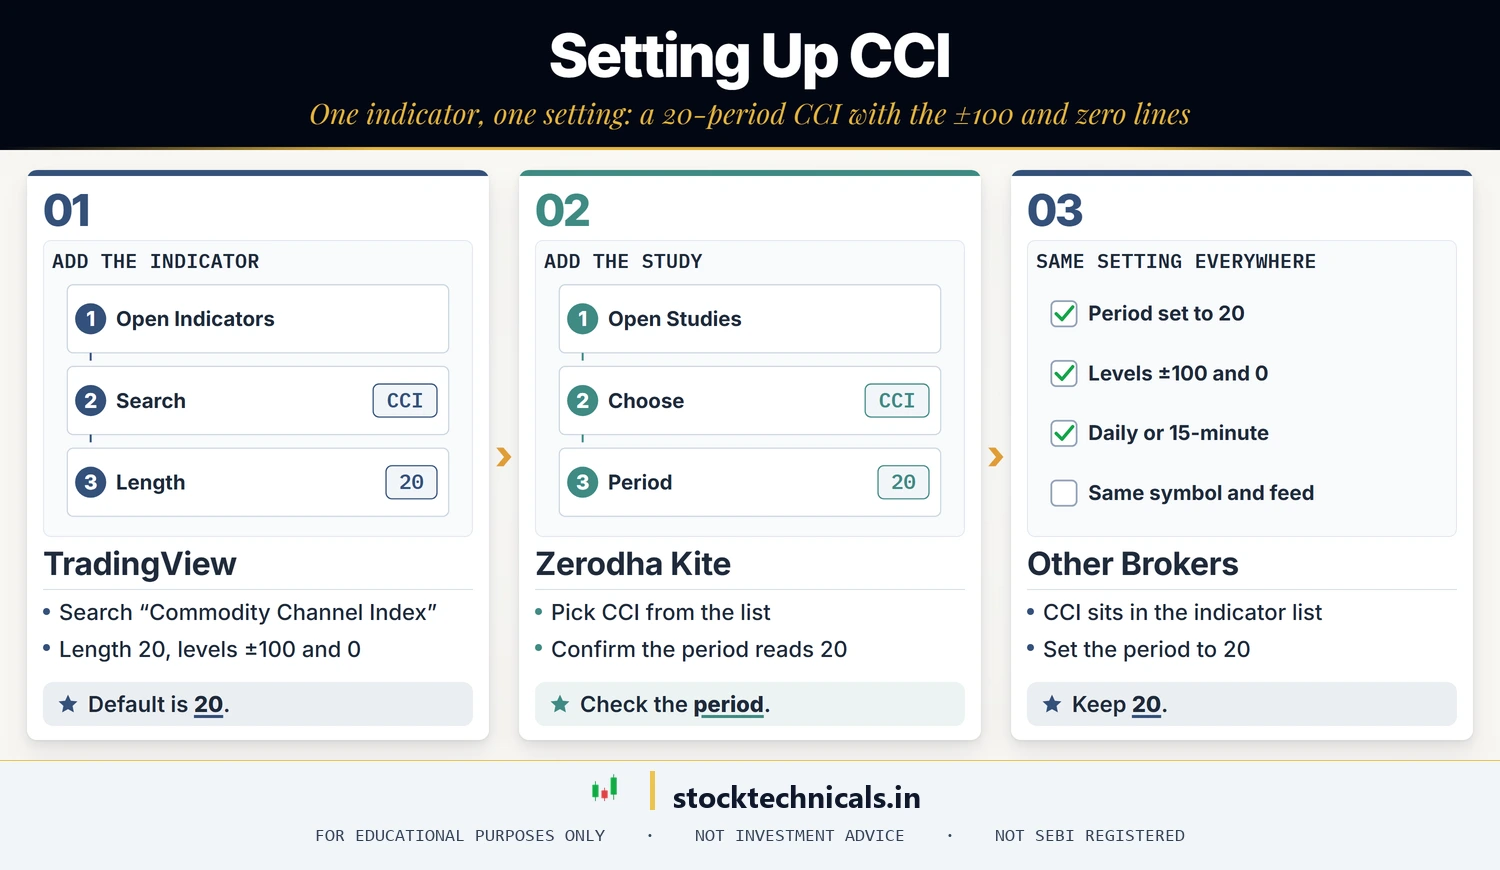
- TradingView — Indicators → “Commodity Channel Index” → default period 20. Levels +100, 0, −100 plotted automatically. Add a +200/−200 pair manually if you want the extreme zones.
- Zerodha Kite — Studies → “CCI” → default 20. Values can differ slightly between platforms because of data feeds, so confirm the period reads 20.
- Angel One / Dhan / Groww — CCI is in their chart indicator lists; confirm the period is set to 20 before use.
Keep the 20-period default. Shorter periods produce more signals but most of them fail; longer periods lag too much. The indicator’s four-decade track record is built on 20.
Combining CCI with other indicators
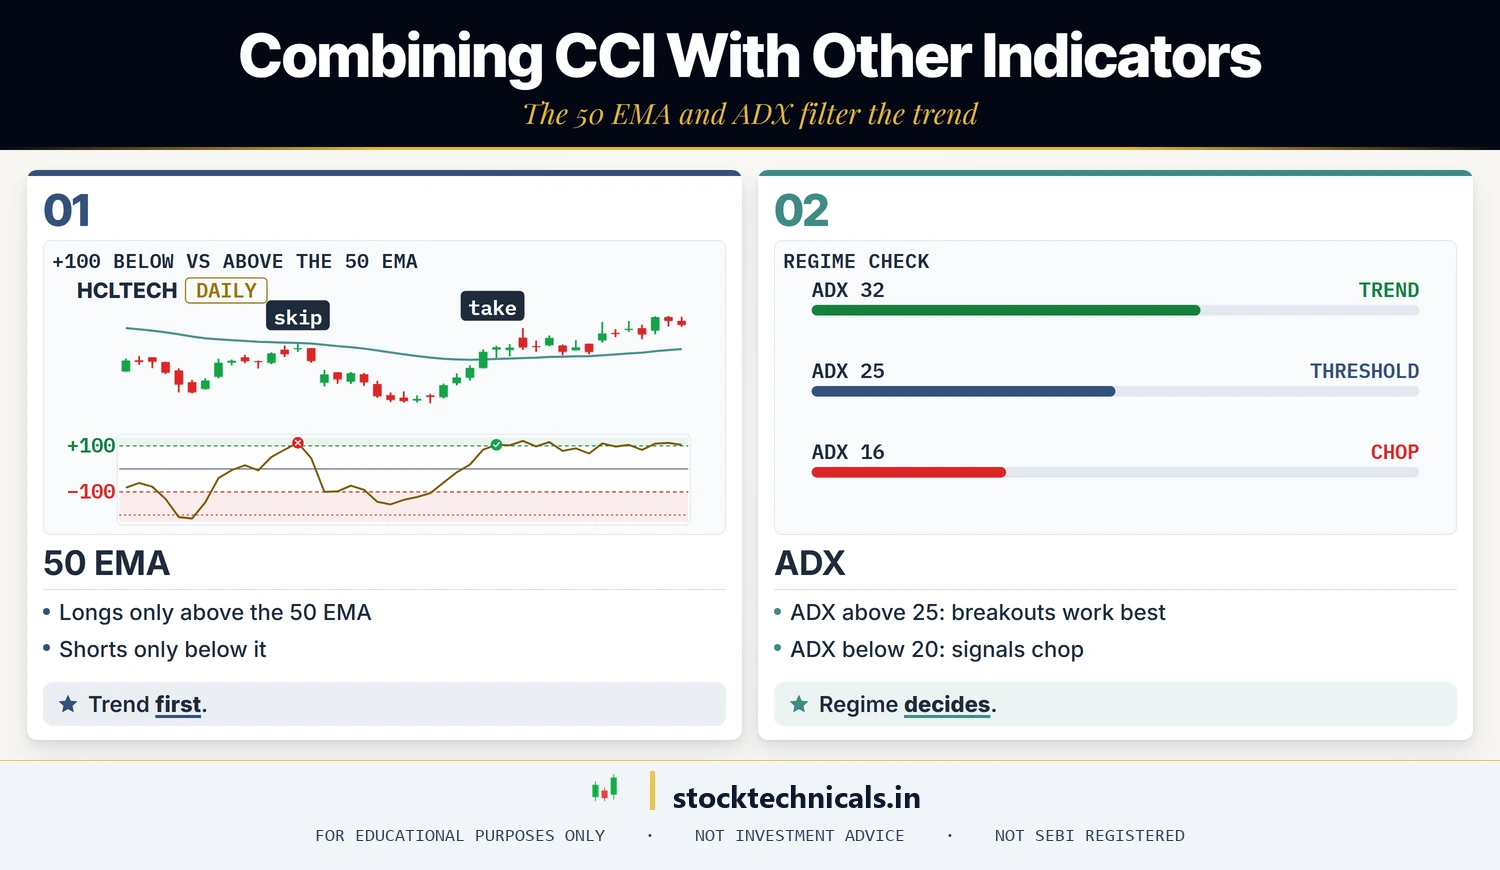
CCI + 50 EMA — the standard trend filter
Long CCI signals only when price is above the 50 EMA. Short signals only when below. This single overlay removes most of the noise (see EMA Basics).
CCI + ADX — measure trend strength first
ADX above 25 indicates a strong trend — that’s when CCI breakouts work best. ADX below 20 means CCI signals will chop. Let ADX set the regime (see ADX Explained).
CCI + price action
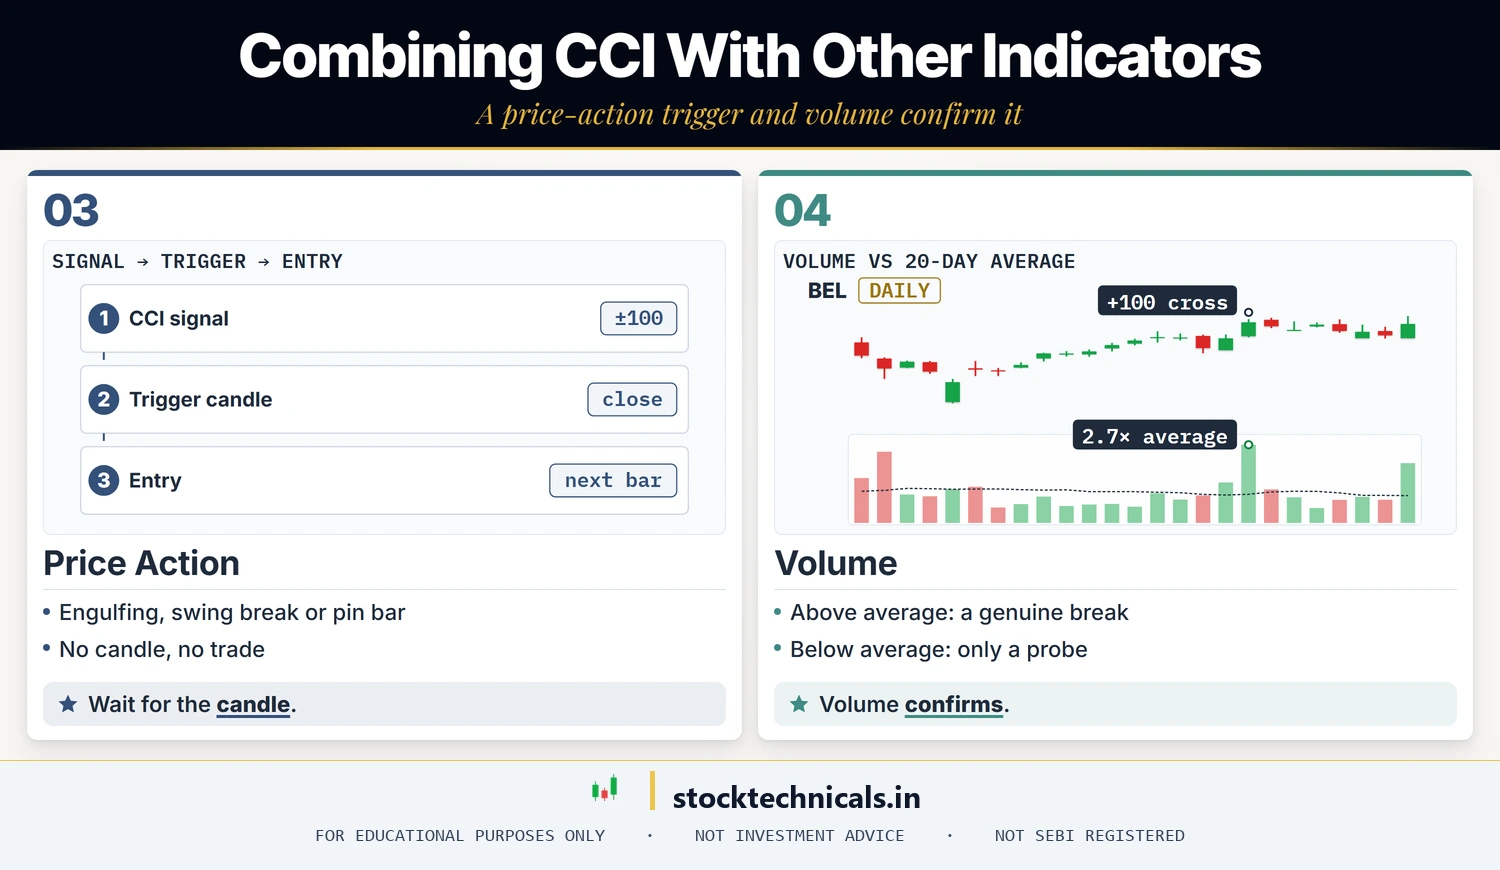
A CCI signal is not a trade trigger by itself. Wait for a price-action confirmation — engulfing candle, swing break, or pinbar — before entering.
CCI + volume
Breakout through +100 or −100 on above-average volume is real. Below-average volume is a probe. Keep a volume pane open at all times.
Five rules for CCI trading
Rule 1 — Respect the trend
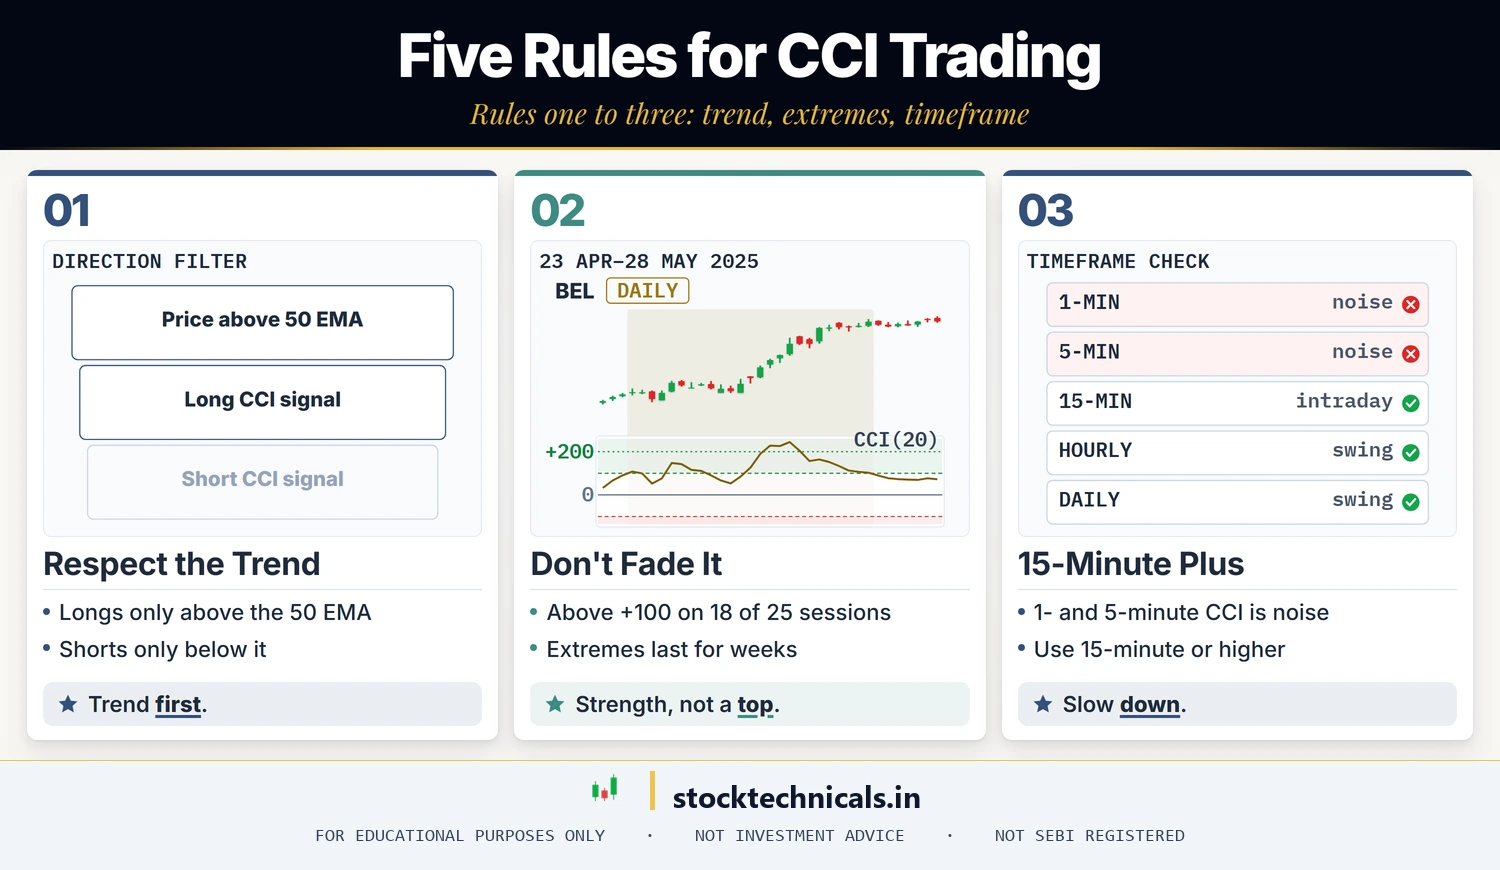
Take long CCI signals only when price is above the 50 EMA. Reverse for shorts. Period.
Rule 2 — Don’t fade CCI above +100 or below −100 in strong trends
In sustained rallies and selloffs, CCI stays extreme for weeks. Fading extremes is a reliable way to give back months of profits.
Rule 3 — 15-minute or higher
CCI on 1-minute and 5-minute charts is noise. 15-minute for intraday, hourly or daily for swing trading. The default 20-period CCI was tuned for daily futures — faster timeframes need extra care.
Rule 4 — Divergences on daily or 4-hour only
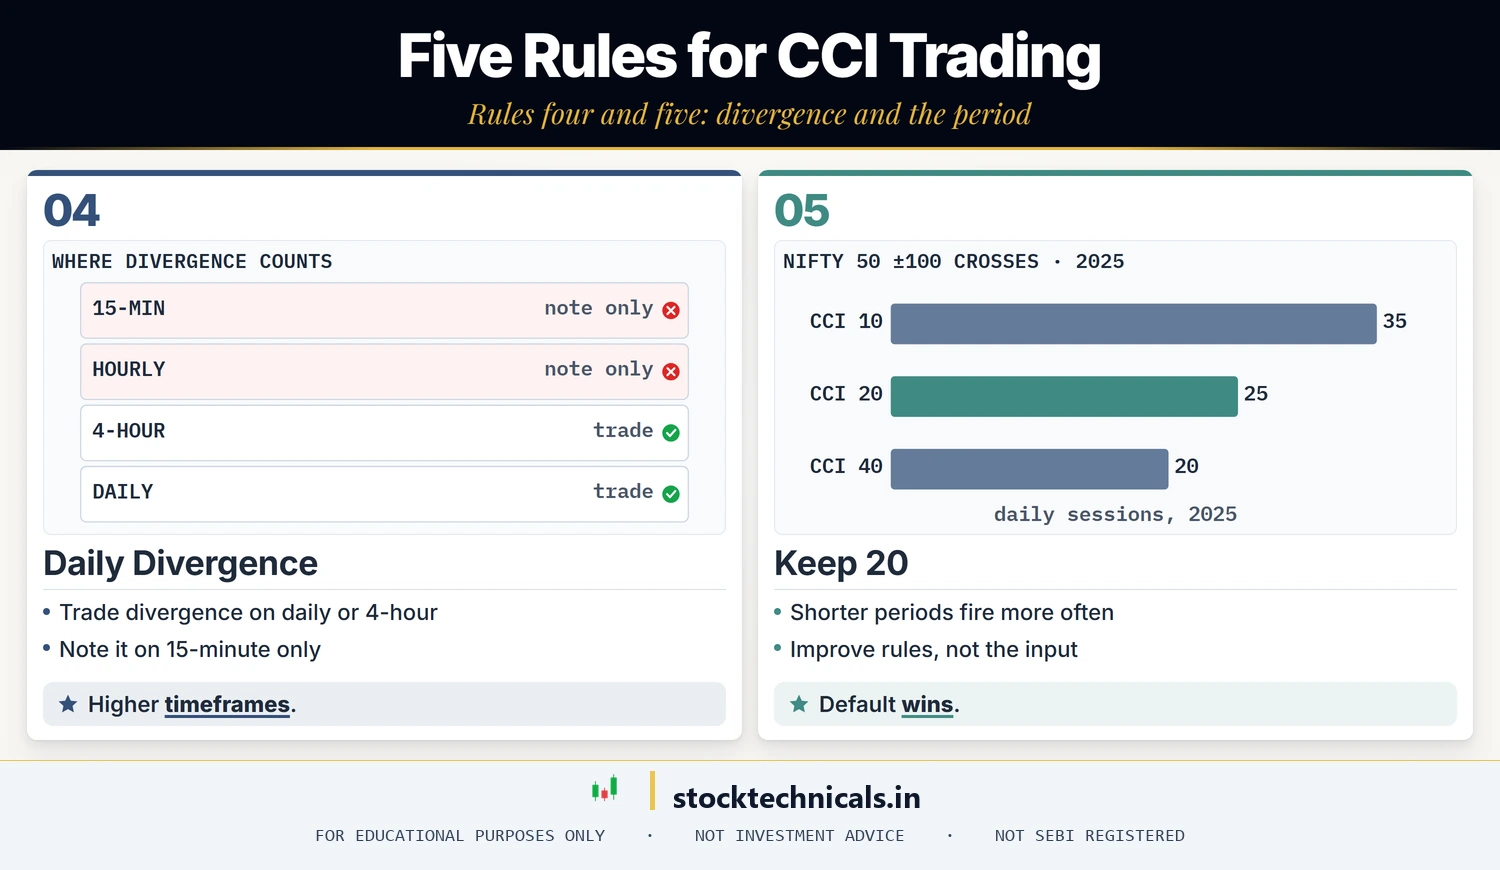
Divergence signals proliferate on lower timeframes and fail often. Trade CCI divergences on daily or 4-hour charts; note them but ignore them on 15-minute.
Rule 5 — Keep the default 20 period
Every “improved CCI setting” you see on the internet is curve-fitted to a specific past window. The 20-period default works across markets, timeframes, and decades. Improve your rules, not the input.
Pre-trade checklist
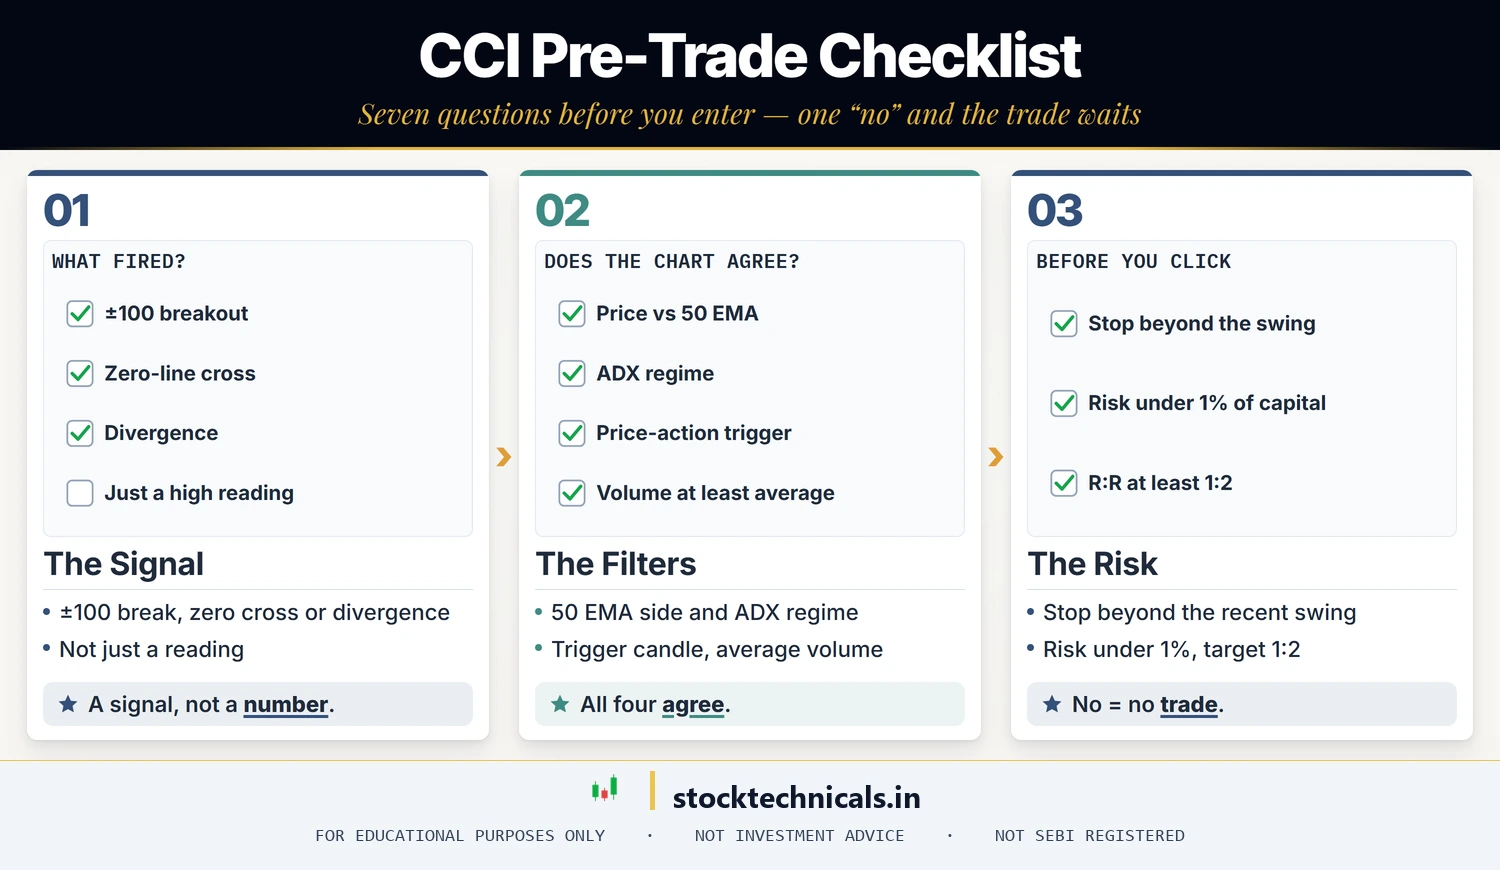
- Is my CCI signal a ±100 breakout, zero-line cross, or divergence — not just a reading?
- Is price on the correct side of the 50 EMA for my direction?
- Is ADX above 25 (for breakout trades) or below 20 (for divergence reversal trades)?
- Is there a price-action trigger candle?
- Is volume at least average on the trigger candle?
- Is my stop beyond the recent swing, sized to less than 1% of capital?
- Does R:R on the first target exceed 1:2?
No = no trade. The next setup comes.
Five common CCI mistakes
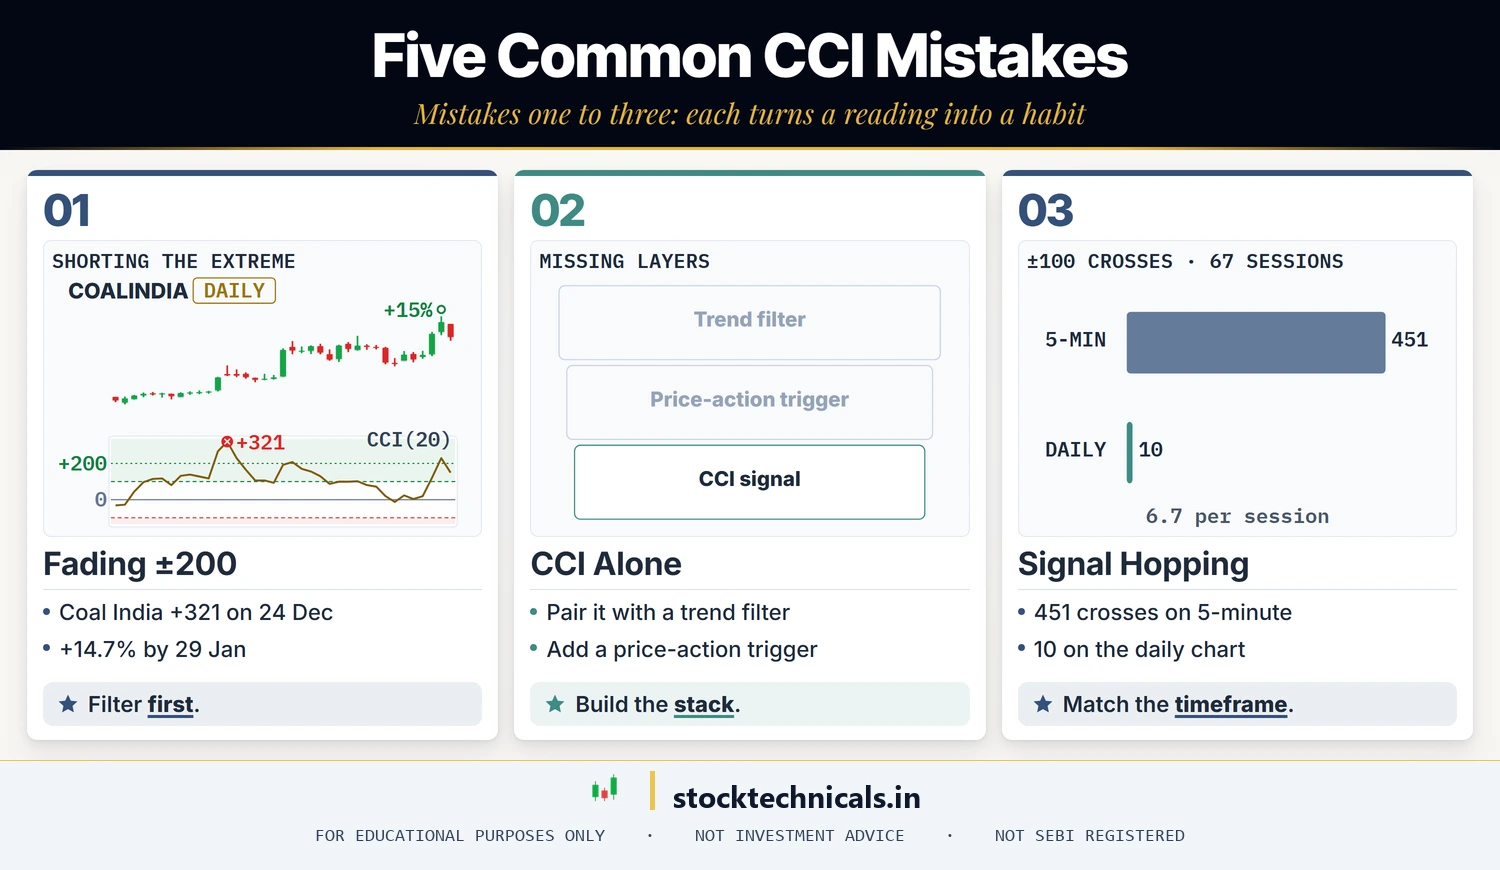
Fading every ±200 reading
Extreme readings can persist for long stretches in strong trends. Fading them without trend-filter confirmation is a predictable losing strategy.
Using CCI in isolation
CCI is a momentum reading, not a trading system. Always pair with a trend filter and a price-action trigger.
Lower-timeframe signal hopping
Taking every CCI cross on 5-minute Nifty futures is how intraday accounts chop themselves into oblivion. Match timeframe to strategy.
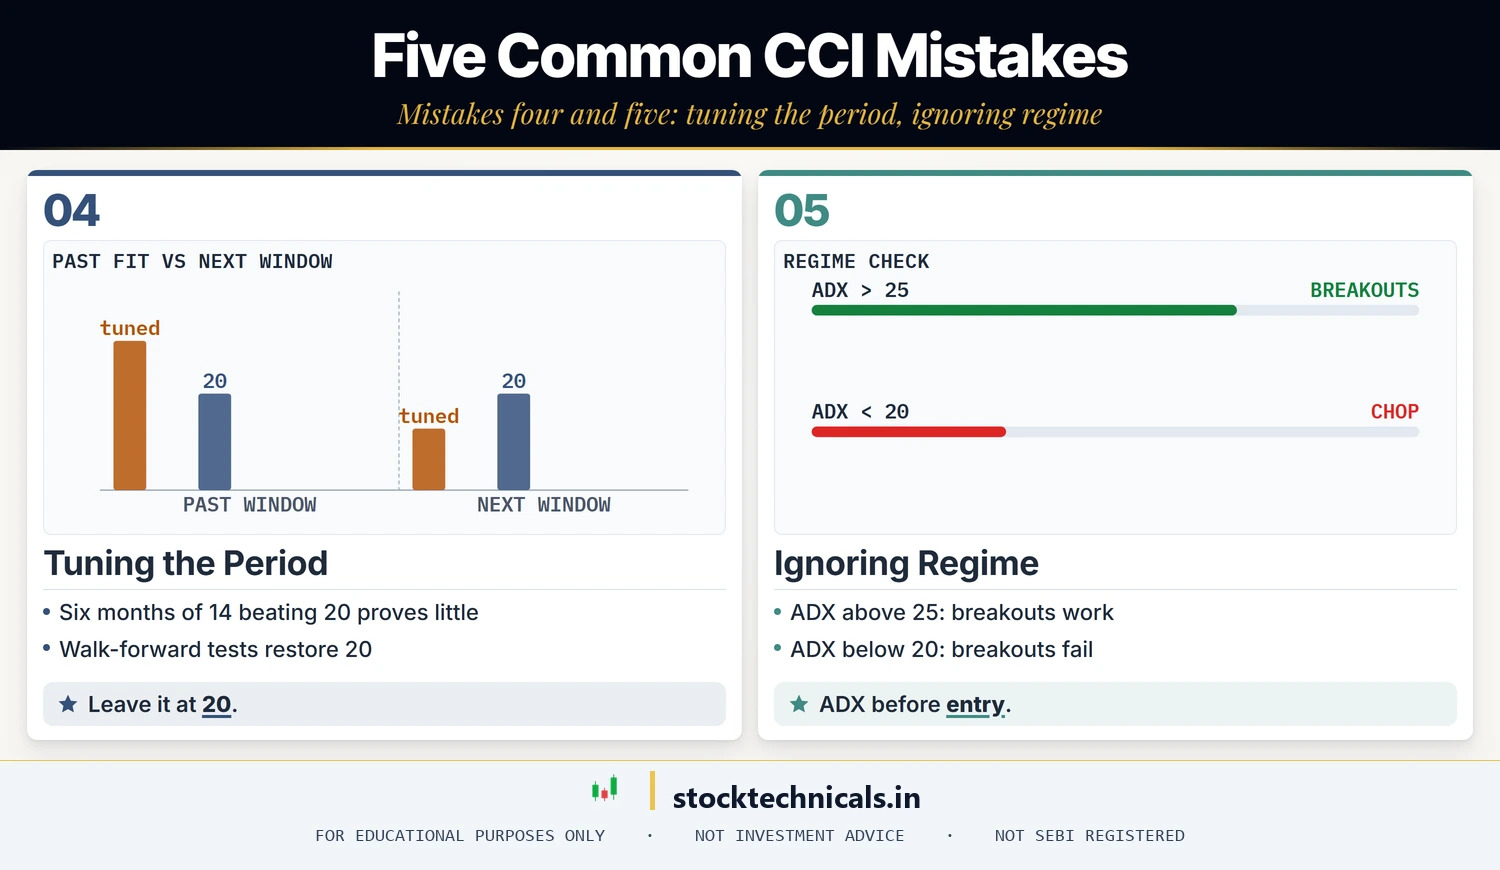
Optimising the period
If backtests show 14 is better than 20 on your chosen instrument for the last six months, that’s curve-fit, not edge. Walk-forward validation almost always restores 20 as the winner.
Ignoring regime
CCI breakouts in strong trends (ADX > 25) work. CCI breakouts in choppy markets (ADX < 20) fail. Check ADX before you commit.
CCI vs RSI vs Stochastic — quick comparison
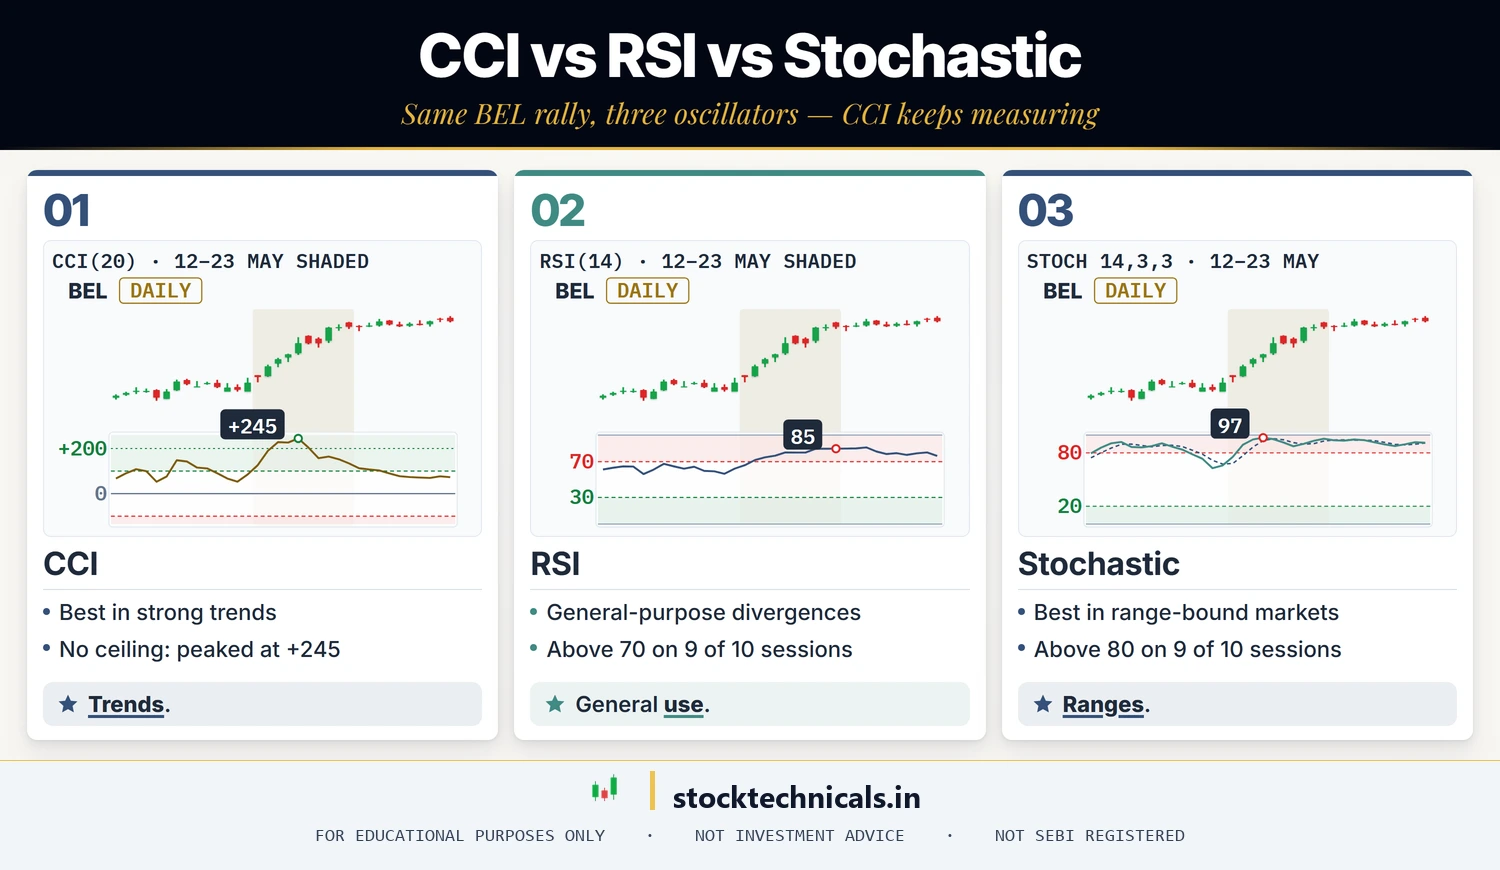
| Feature | CCI | RSI | Stochastic |
|---|---|---|---|
| Scale | Unbounded (typically ±200) | 0 to 100 | 0 to 100 |
| Default period | 20 | 14 | 14, 3, 3 |
| Best regime | Strong trends & breakouts | General-purpose | Range-bound markets |
| Divergence quality | Very good on daily | Best overall | Good on range days |
| Limits in strong trends | None (unbounded) | Hit ceiling/floor | Hit ceiling/floor |
Does CCI only work on commodities?
No. Despite the name, CCI is price-derived and works on any liquid instrument. It’s used widely on Nifty 50, Bank Nifty, and large-cap Indian equities.
Why is the default setting 20 periods?
20 is the default on TradingView, StockCharts and most charting platforms, and has been the standard setting since Lambert introduced CCI in 1980. Keep it unless you have specific out-of-sample evidence to move.
Should I trade every CCI cross of ±100?
No. Take ±100 breakouts only when the higher-timeframe trend agrees. Take zero-line crosses only with a trend filter. Take divergences only on daily or 4-hour charts at key support/resistance.
How is CCI different from RSI?
RSI is bounded 0–100 and hits its ceiling in strong trends. CCI is unbounded and keeps providing information even at extremes. RSI is better in ranges; CCI is better in trends.
Can CCI be used for intraday trading?
Yes, on 15-minute and higher timeframes. The 20-period default works there. Below 15-minute the signal-to-noise ratio becomes unreliable.
What’s the most profitable CCI signal?
There is no single best signal. Divergence at a prior support or resistance zone on the daily chart tends to offer the best risk-reward; zero-line crosses fire more often. The ±100 breakout is the middle ground.
How do I know if CCI is overextended?
Readings beyond ±200 are uncommon. Rare doesn’t mean reversal — overextension is a warning, not a signal. Need a divergence or trend filter flip to act on it.
Test Your Knowledge
Q1: What is the default CCI period?
Q2: What does a CCI reading of +150 mean?
Q3: Which is the CCI’s biggest structural advantage over RSI?
Q4: CCI is reading +250. Best action:
Q5: Which CCI signal does this article treat as the highest-quality reversal setup?
Your next step
CCI pairs cleanly with the ADX for regime detection and with the Ichimoku Cloud for higher-timeframe bias. Add one of those to your chart and start paper-trading the combination on daily Nifty 50 for two weeks.
The Bottom Line
CCI’s edge is simple: it keeps giving signal when bounded oscillators have stopped working. Use it for trend entries (±100 breakouts), bias flips (zero-line crosses), and reversals (divergences). Pair it with a 50 EMA trend filter and an ADX regime check. Keep the 20-period default. Don’t fade extremes in strong trends. Do all that and CCI becomes one of the most reliable momentum signals for Indian equity traders.
Educational content only — not SEBI-registered investment advice. Momentum indicators including CCI improve probability, not certainty. Extreme readings can persist for much longer than expected. Size every trade so a full stop-out costs less than 1% of capital. Never trade with borrowed money.