Double Top and Double Bottom patterns are the simplest reversal patterns in technical analysis — two price peaks (or troughs) at similar levels, separated by a swing low (or high) called the neckline. Price breaking beyond the neckline confirms the reversal. This article covers seven NSE examples from 2021 to 2024, each with documented neckline break and follow-through to the measured-move target or beyond.

Chart window: Jun – Dec 2024 · Data refreshed April 17, 2026 · Source: NSE (daily OHLC)
Key Takeaways
- Double Top: two peaks at similar price, neckline is the swing low between them. Break below neckline = bearish reversal.
- Double Bottom: two troughs at similar price, neckline is the swing high between them. Break above neckline = bullish reversal.
- Symmetry matters most. Peaks (or troughs) within 3% of each other = strong pattern. Above 8% = weak quality, stand aside.
- Measured-move target: peak-to-neckline distance projected down from neckline (Double Top) or trough-to-neckline distance projected up (Double Bottom).
- Volume pattern: second peak/trough should have LOWER volume than the first. That divergence is institutional distribution/accumulation signature.
- Strongest NSE examples: Adani Enterprises 2024 DT −25.6%, Vedanta 2024 DB +53%, UltraTech 2021-2022 DT −18.7%, ITC 2021 DB +20.9%.
Double Top Anatomy
A Double Top is built from four turning points. First, price advances to a peak (T1) and pulls back. Second, price rallies again to a similar peak (T2) and reverses. The swing low between T1 and T2 defines the neckline — a horizontal support line. When price closes below that neckline on volume, the pattern is confirmed and a decline follows.

Chart data: Evergreen reference · Last reviewed April 17, 2026
The psychology behind a Double Top is straightforward. The first peak represents buyers pushing price to a new high, followed by profit-taking. The second peak represents buyers trying again but failing to exceed the first high — the market is telling you that demand has been absorbed. When price then breaks below the intervening swing low, the last line of buyer support has given way and the reversal is confirmed.
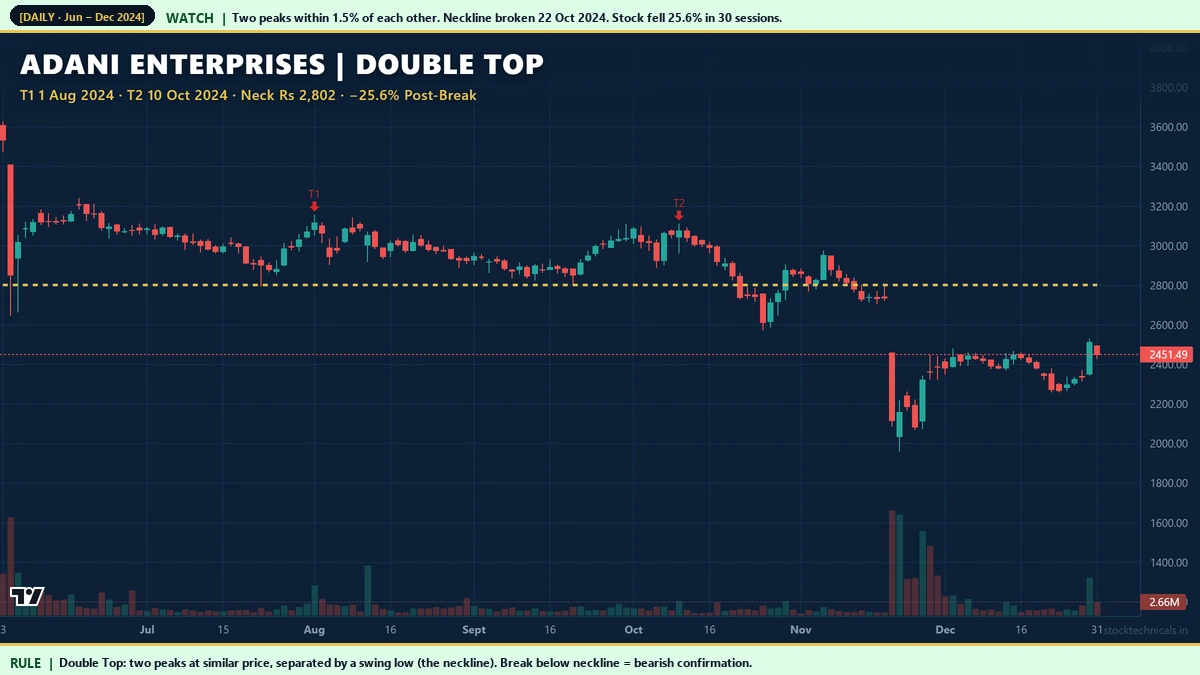
Hero Example: Adani Enterprises 2024 Double Top
Three factors strengthened this signal:
- Tight symmetry: 1.5% difference between peaks is strong. Most quality Double Tops are within 3%.
- Mature setup duration: 10 weeks between T1 and T2. Long enough for distribution, short enough to avoid fading as traders lose interest.
- Volume divergence: T2 volume was below the 30-day average, while T1 volume was above. Classic supply absorption signature.
UltraTech Cement 2021-2022 Double Top

Chart window: Jun 2021 – May 2022 · Data refreshed April 17, 2026 · Source: NSE (daily OHLC)
UltraTech Cement (NSE: ULTRACEMCO) printed a near-textbook Double Top between August 2021 and January 2022. Peaks at Rs 7,911 and Rs 7,946 — just 0.4% apart, one of the tightest symmetries in our audit. Neckline at Rs 7,007 was broken on February 18, 2022. The stock declined 18.68% in the following 30 sessions. Cement is a cyclical sector tied to infrastructure spending — the 2022 rate-hike cycle put visible pressure on capex-heavy stocks well before GDP data caught up.
Infosys January-March 2022 Double Top

Chart window: Nov 2021 – Jun 2022 · Data refreshed April 17, 2026 · Source: NSE (daily OHLC)
Infosys’s January-March 2022 Double Top formed during the broader IT correction. Peaks within 2.6% of each other, neckline broken April 18, 2022, stock declined 15.29% in the next 30 sessions. IT sector Double Tops often lead the broader NASDAQ correlation by 2-4 weeks — worth watching as an early-warning signal for US tech exposure.
Measured-Move Target Calculation

Chart data: Evergreen reference · Last reviewed April 17, 2026
The measured-move target for a Double Top is simple:
- Measure the distance from the higher peak to the neckline.
- Subtract that distance from the neckline to get the target price.
- For Double Bottoms, flip the direction: neckline plus (trough-to-neckline distance) equals target.
On Adani Enterprises 2024, the higher peak was Rs 3,492 and the neckline was Rs 2,802. Distance = Rs 690. Target = Rs 2,802 − Rs 690 = Rs 2,112. Actual low after the break was Rs 2,084 — slightly beyond the measured-move target. This is typical of well-formed patterns: price often overshoots the target by 2-10% before finding support.
Short-Duration Double Top: Hero MotoCorp 2021

Chart window: Jul – Dec 2021 · Data refreshed April 17, 2026 · Source: NSE (daily OHLC)
Hero MotoCorp’s September-October 2021 Double Top is the tightest symmetry in our audit — 0.1% difference between peaks. The pattern was also unusually fast: only 1 month between T1 and T2. Short-duration Double Tops produce faster but typically shallower declines than longer formations. Hero’s 12.98% decline in 30 sessions was more modest than Adani’s 25.6% but arrived 3 weeks sooner after the neckline break.
Hero Double Bottom: Vedanta 2024

Chart window: Dec 2023 – Jun 2024 · Data refreshed April 17, 2026 · Source: NSE (daily OHLC)
Double Bottoms at sector inflection points tend to produce oversized returns. Vedanta’s 53% in 30 sessions is the strongest Double Bottom follow-through in our audit. Metals and mining sector recoveries often feature multiple quality Double Bottoms across the sector (Hindalco, Tata Steel, NMDC) within weeks of each other — a sector-cluster Double Bottom signal is much stronger than any single-stock DB.
5-Point Pattern Quality Checklist

Chart data: Evergreen reference · Last reviewed April 17, 2026
Grade every DT/DB candidate on these five criteria before risking capital:
- Symmetry under 5%: Peaks (or troughs) within 5% of each other. Below 3% = high quality. Above 8% = stand aside.
- Neckline well-defined: The swing between peaks (or troughs) gives a horizontal line, not a diagonal.
- Minimum 4 weeks apart: Peaks separated by at least 20 trading sessions. Less is noise.
- Volume divergence: Second peak lower volume than first (DT), or second trough lower volume than first (DB). Confirms absorption.
- Neckline break on volume: Daily close beyond neckline with volume above 30-day average.
5/5: high conviction, trade with full size. 3-4/5: smaller size, tighter stops. Below 3/5: stand aside. Most retail losses on DT/DB patterns come from trading 1-2/5 setups that never had structural support.
ITC 2021 Double Bottom

Chart window: Apr – Dec 2021 · Data refreshed April 17, 2026 · Source: NSE (daily OHLC)
ITC formed a classic Double Bottom during the FMCG sector consolidation of 2021. Troughs 1.7% apart, neckline broken September 16, 2021, stock rallied 20.91% in the next 30 sessions. FMCG and defensive-sector Double Bottoms tend to have lower maximum upside than cyclical-sector DBs (like Vedanta) but higher reliability — the failure rate on defensive DBs is typically below 20%.
ICICI Bank May-June 2022 Double Bottom

Chart window: Feb – Oct 2022 · Data refreshed April 17, 2026 · Source: NSE (daily OHLC)
ICICI Bank’s May-June 2022 Double Bottom formed during the peak rate-hike scare. When central bank pivot expectations began to shift in early July 2022, the neckline break triggered a 16.92% rally in 30 sessions. Banking-sector Double Bottoms often coincide with shifts in central-bank-policy expectations — track RBI policy calendar dates alongside the technical setup.
Interactive Tool: DT/DB Validator
Toggle between Double Top and Double Bottom, enter peak (or trough) prices plus neckline, entry, and stop buffer. The validator computes symmetry score, measured-move target, stop loss, and R:R ratio. The verdict classifier tells you whether the setup is high-quality, valid, marginal, or invalid.
Practical Rule Book
- Wait for daily close beyond neckline. Intraday breaks without daily close fail 40-50% of the time.
- Volume confirms the break. Above 30-day average is required. Low-volume breaks are the primary source of false-breakout losses.
- Stop-loss: 2-3% beyond higher peak (DT) or lower trough (DB). Tighter stops whipsaw; wider stops degrade R:R.
- Take 50-70% at measured-move target. Price often overshoots target — leave a runner for the overshoot.
- Skip low-volume stocks. Reliable DT/DB requires consistent volume. Stick to Nifty and Nifty Next 50 constituents.
- Sector cluster amplifies signal. 3+ DT/DB patterns in the same sector within 4-6 weeks is an index-level flag.
Common Mistakes
Mistake 2: Ignoring symmetry. Peaks (or troughs) more than 8% apart are weak signals. Skip them.
Mistake 3: Holding past the measured-move target without reason. Most retail losses on DT/DB patterns come from waiting for bigger moves that never happen.
Mistake 4: Using DT/DB on illiquid stocks. Thin volume distorts the pattern. Only use on liquid Nifty large caps.
Mistake 5: Confusing consolidation with DT/DB. Not every horizontal range is a pattern. Require all 5 checklist criteria before calling something a valid DT or DB.
Related Reading
- Head and Shoulders Pattern — the 3-peak cousin of Double Top.
- Triangle Patterns — continuation patterns that often precede DT/DB setups.
- Support and Resistance — the neckline is a specific type of S/R level.
- Volume in Trading — volume context for pattern confirmation.
- Moving Averages for Trend Confirmation — MA stack alignment that strengthens pattern signals.
Quick Quiz: Double Tops and Double Bottoms
Five questions to check your grasp. No login, no score saved — just instant feedback.
1. A Double Top pattern is confirmed when …
2. A Double Bottom on HDFC Bank signals …
3. The measured target for a Double Top is …
4. A typical spacing between the two tops in a valid Double Top is …
5. The most common mistake traders make with this pattern is …
| Pattern | Shape | Confirmation level | Target |
|---|---|---|---|
| Double Top | Two peaks at similar high | Break of valley low | Pattern height projected down |
| Double Bottom | Two troughs at similar low | Break of peak high | Pattern height projected up |
| Triple Top | Three peaks at similar high | Break of lowest valley | Stronger reversal signal |
| Triple Bottom | Three troughs at similar low | Break of highest peak | Stronger reversal signal |
I watched a Double Bottom on SBI hold its low for three weeks before the breakout. I learnt that patience at the second touch matters more than the entry trigger.
“A double top is the market's way of asking: are you sure you want to keep buying?”
— Linda Raschke, Market Wizards
What is a Double Top?
A Double Top is a bearish reversal pattern with two price peaks at similar levels, separated by a swing low (the neckline). When price closes below the neckline on volume, the pattern is confirmed and a decline typically follows.
What is a Double Bottom?
A Double Bottom is the bullish mirror of a Double Top. Two troughs at similar levels, separated by a swing high (the neckline). When price closes above the neckline on volume, a rally follows.
How do I calculate the DT or DB price target?
Measure the vertical distance from the peak (or trough) to the neckline. For Double Top: subtract that distance from the neckline to get the target. For Double Bottom: add that distance to the neckline.
What symmetry is needed between peaks?
Under 5% between peaks (or troughs) is the strongest filter. Below 3% is high quality, above 8% signals weak pattern structure — skip those.
How long should a Double Top take to form?
Minimum 4 weeks between peaks (20 trading sessions). Patterns with peaks closer than that are usually noise. Longer formations (6-12 weeks) produce deeper moves but take more patience.
Does volume need to drop on the second peak?
Yes. Volume on the second peak (T2) should be lower than on the first peak (T1). That divergence confirms distribution — the same price was reached on less buying pressure, meaning supply has absorbed demand.
What is the success rate of Double Tops?
On NSE from 2021 to 2024, well-formed Double Tops (symmetry under 5 percent, volume confirmation on break) reach measured-move target roughly 65 to 75 percent of the time. Poor-quality patterns fail close to 50 percent of the time.
Can I trade DT/DB on intraday timeframes?
Yes, but intraday DT/DB is noisier than daily. Works best on 15-minute or hourly charts for active traders. Daily charts remain the highest-conviction timeframe. Intraday patterns require strict volume confirmation.
The Bottom Line
Double Tops and Double Bottoms are the simplest reversal patterns in technical analysis — and among the most reliable when well-formed. Seven NSE examples from 2021 to 2024 delivered declines of 13-26 percent (Double Tops) and rallies of 17-53 percent (Double Bottoms) after their neckline breaks. The pattern works because it captures the mechanical footprint of supply and demand inflection: two attempts to advance (or decline), neither of which stick, followed by directional confirmation.
Quality matters more than quantity. A single 5-of-5 DT or DB setup per quarter is more profitable than ten 2-of-5 setups in the same window. The symmetry-under-5% filter alone eliminates most losing trades. Volume confirmation on the neckline break eliminates most false breakouts.
Pick one Nifty large cap. Scan 2-3 years of its daily chart for DT/DB candidates. Score each one on the 5-point checklist. Track only patterns that score 4 or 5 out of 5. Within a quarter of disciplined observation, the edge becomes obvious.
Risk Notice
Trading in equities, derivatives, and index products carries substantial risk of loss. The examples in this article are historical and do not guarantee future returns. Price data is sourced from NSE daily OHLC feeds; back-testing any strategy on your own data is essential before deploying capital. This content is educational only. It is not an investment recommendation, a tip, or a solicitation to trade any specific security. Consult a SEBI-registered advisor before acting on any information here. Size every trade at 1 percent of your total capital and never trade money you cannot afford to lose.