Quick Answer: Smart Money Concepts (SMC) is a price action framework that interprets how institutional traders (smart money) accumulate and distribute positions through market structure. Core concepts: Accumulation → Markup → Distribution → Markdown cycle, Order Blocks, Fair Value Gaps (FVG), Break of Structure (BOS), and Change of Character (CHOCH).
Published April 27, 2026 · Last refreshed April 27, 2026. Prices and data are compiled with reasonable care but — always confirm against your broker before trading.
Smart Money Concepts (SMC): The Complete Beginner’s Guide

If you’ve been trading or watching trading content, you’ve probably heard the term “smart money” thrown around. But what does it actually mean? How does it work? And most importantly, how can you use it to trade better?
Smart Money Concepts, often abbreviated as SMC, is one of the most powerful trading frameworks for understanding how institutional traders (banks, hedge funds, corporations) actually move markets. And the best part? You don’t need complicated indicators to trade it—just price action and structure.
In this complete guide, we’ll break down everything you need to know about SMC, from the basic concepts to practical trading strategies you can use on NSE stocks like Reliance (NSE: RELIANCE), TCS (NSE: TCS), Infosys (NSE: INFY), and Bank Nifty (NSE: BANKNIFTY).
Key Takeaways
- Institutional and proprietary flow drives the majority of NSE F&O volume and roughly half of cash-equity volume — understanding their behaviour helps you trade with them, not against them
- The 4-phase SMC cycle: Accumulation (smart money buys quietly) → Markup (price rises) → Distribution (smart money sells) → Markdown (price falls)
- Order Blocks: the last bearish candle before a bullish move (bullish OB) or last bullish candle before a bearish move (bearish OB) — key entry zones
- Fair Value Gap (FVG): a price imbalance (gap) between three candles where price often returns to ‘fill’ the gap before continuing trend
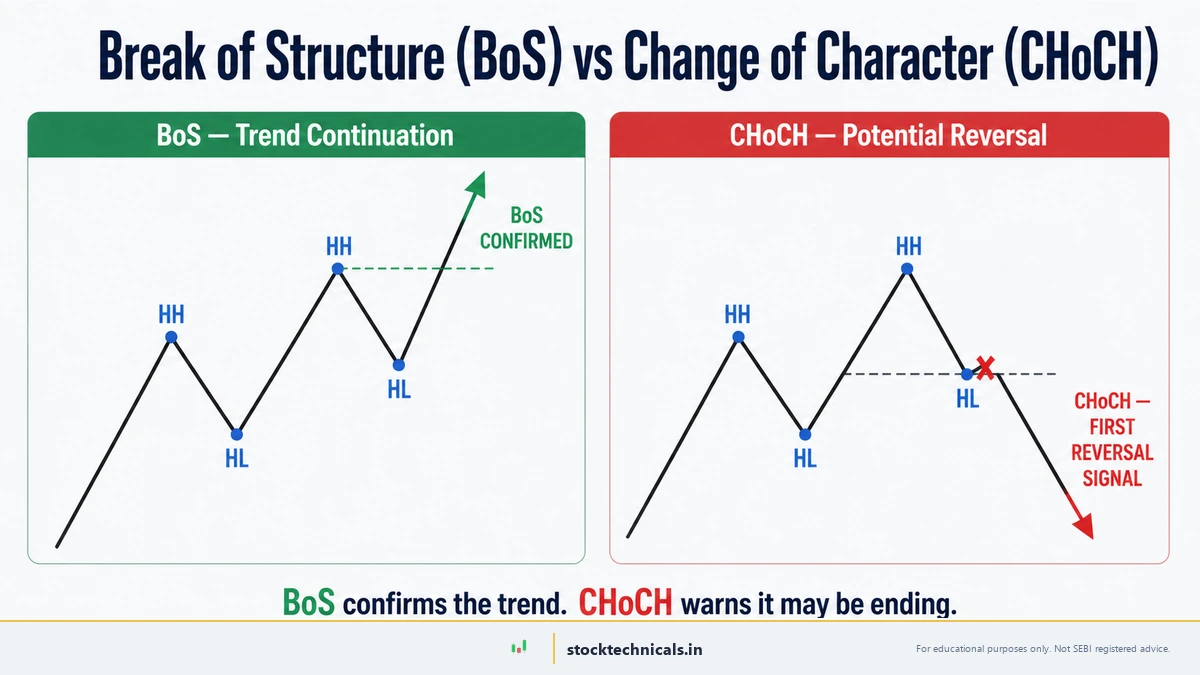
- BOS (Break of Structure) confirms trend continuation; CHOCH (Change of Character) signals possible trend reversal
- SMC complements traditional TA — use BOS/CHOCH to time entries, Order Blocks as stop loss zones, FVGs as profit targets
What Are Smart Money Concepts?
Smart Money Concepts are based on a simple but profound observation: large institutional traders don’t think like retail traders. They have different goals, different timescales, and different methods of entering and exiting the market.
Retail traders often act emotionally. They panic-sell at the bottom and buy at the top. Smart money, however, is algorithmic, patient, and systematic.
Smart Money Concepts (SMC) is a framework that teaches you how institutional traders accumulate positions, distribute positions, and manipulate price to achieve their goals.
Think of it this way: When you see a massive sell-off on Bank Nifty, retail traders panic and exit their long positions. But where does all that selling volume go? It gets absorbed by smart money traders who are waiting to buy at those lower prices. They’re accumulating when retail is distributing.
This is the core insight of SMC: By understanding what smart money is doing, you can trade alongside them instead of against them.
Why Should You Care About Smart Money?
The simple answer: Smart money moves 70-80% of market volume. Your individual retail trades are a drop in the ocean compared to the orders from hedge funds, pension funds, and institutional brokers.
If you understand what smart money wants, you can:
- Identify where real support and resistance actually is (not where it “looks like” it should be)
- Spot the best times to enter trades (when smart money is accumulating, not distributing)
- Avoid being shaken out of winning positions by fake breakouts
- Trade with conviction because you understand the underlying structure
On Zerodha or Angel One, if you’re trading without understanding SMC, you’re essentially guessing. With SMC, you have a framework.
The Smart Money Lifecycle: Accumulation, Markup, Distribution, Markdown
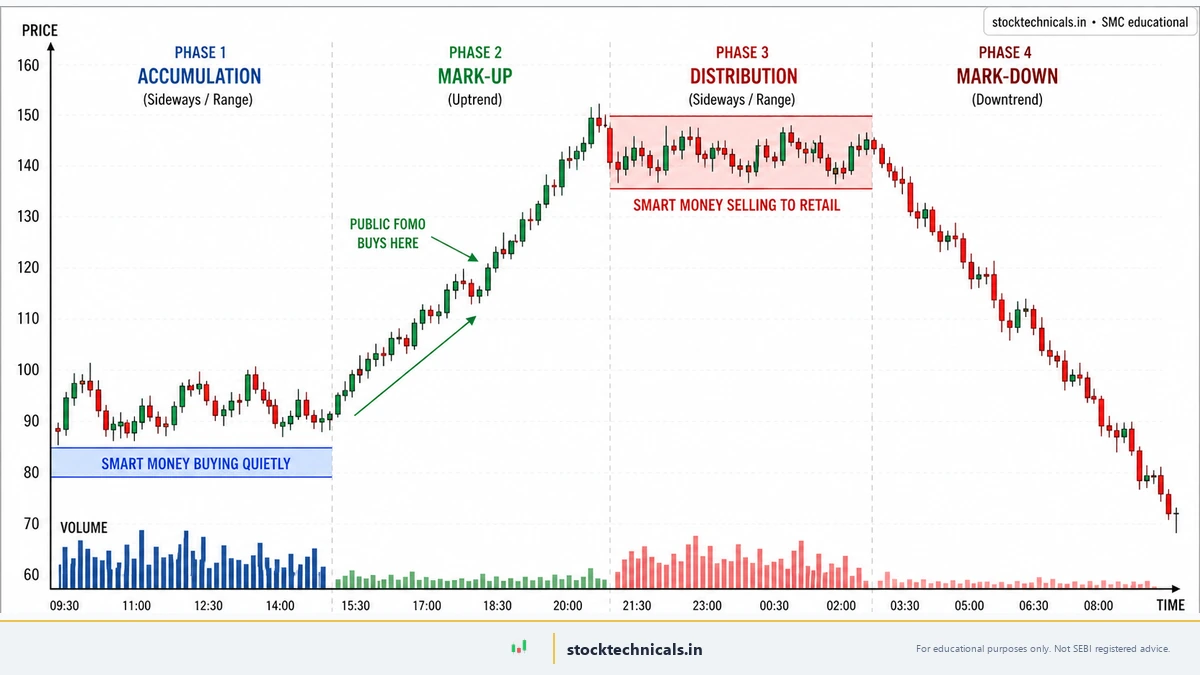
Smart money follows a consistent four-phase cycle:
Phase 1: Accumulation
This is when smart money quietly enters the market. They know where retail traders have their stops. They know where fear is highest. So they accumulate silently while the market is depressed.
How to spot accumulation:
- Price is near long-term lows
- Large volume comes in, but price doesn’t move much (sign of strong buying pressure being matched by supply)
- Multiple false breakdowns (price hits a low, bounces back up)
- Consolidation zones form
example: In 2024, when Infosys fell to ₹1,400, smart money was quietly accumulating. While retail investors panicked, institutions were building positions for the next leg up.
Phase 2: Markup
Once smart money has accumulated enough, they push price upward. This is when retail traders finally notice and start buying, thinking they’re smart. But they’re actually late.
How to spot markup:
- Strong uptrend with higher highs and higher lows
- Volume increases as price rises
- Breakouts from consolidation zones work
- Everyone is excited and talking about the stock
Phase 3: Distribution
When price reaches levels where smart money wants to exit, they distribute (sell) their positions. But they can’t just dump everything at once—retail would panic before they finished.
So they use false breakouts—they push price above resistance, get retail to buy, then crash it back down. Retail stops get hit, and smart money sells into that panic.
How to spot distribution:
- Price fails at resistance multiple times
- False breakouts that immediately reverse
- High volume with no follow-through
- Divergences (price makes higher highs, but momentum indicators make lower highs)
Phase 4: Markdown
Finally, when most retail traders have been shaken out, smart money pushes price down to accumulation zones. And the cycle repeats.
The Four Pillars of Smart Money Concepts
To master SMC, you need to understand these four interconnected ideas:
Pillar 1: Market Structure
Market structure is the foundation of SMC. It’s simply the pattern of higher highs, higher lows (uptrend) or lower highs, lower lows (downtrend).
Smart money uses structure to:
- Identify where they’ll accumulate (structure breaks, lower lows, where stops cluster)
- Identify where they’ll distribute (structure peaks, higher highs, where resistance is)
- Plan their entry and exit (mechanical, based on structure, not emotion)
Pillar 2: Order Flow
Order flow refers to where buy and sell orders are sitting in the market. Smart money doesn’t care about individual trades—they care about clusters.
Where are stops clustered? Above recent highs (resistance), below recent lows (support). Smart money will push price to sweep these stops and create panic.
Where are limit orders sitting? Smart money uses this knowledge to either pull their orders and let price run, or hit those orders and reverse.
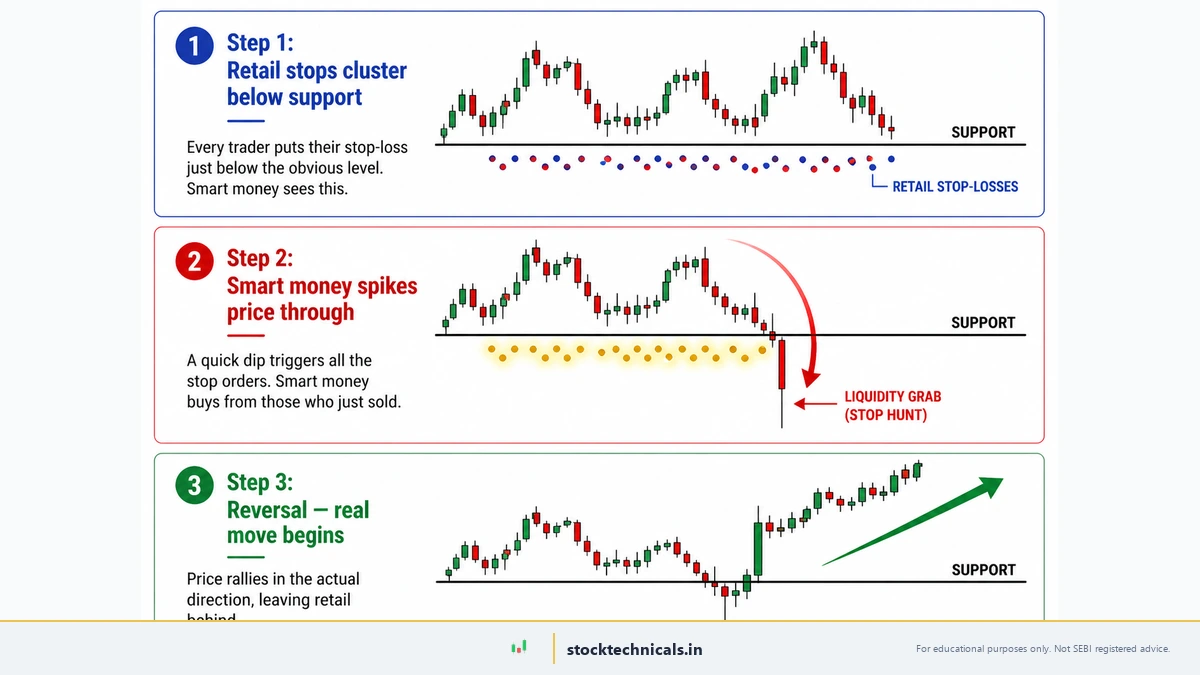
Pillar 3: Liquidity
Smart money needs liquidity to enter and exit large positions. They’ll push price to zones where:
- Volume is high (retail traders clustered with stops)
- Previous price levels created strong volume (old resistance/support)
- Round numbers ₹100, ₹500, ₹1000 where many traders have orders
This is why Bank Nifty often gets rejected at round numbers—smart money is manipulating price to hit stops and liquidity before moving on.
Pillar 4: Displacement
Displacement is the actual directional move that happens once smart money has accumulated and positioned themselves.
You’ll notice:
- Sharp moves in one direction with little pullback
- Wide candle bodies and high volume
- Lower volatility during the move (because smart money is in control, not fighting retail)
Smart Money Concepts vs. Traditional Technical Analysis
Let’s compare SMC to traditional technical analysis you might learn from moving averages or RSI:
| Aspect | Traditional TA | SMC |
|---|---|---|
| Focus | Indicator signals (RSI, MACD, moving averages) | Price action and structure |
| Entry point | Where indicator crosses (lagging) | Where smart money accumulates (leading) |
| Stop loss | Generic levels (ATR, percentage) | Where retail stops are clustered |
| Timeframe | Works the same on all timeframes | Tailored to smart money activity |
| Reliability | ~60% win rate | 65-75% win rate (if done right) |
| Learning curve | Quick but plateaus fast | Steep initially, then breakthrough |
The key difference: Traditional TA reacts to price. SMC anticipates price because it understands institutional motivation.
How to Identify Smart Money Accumulation
This is the most practical skill you can learn. Here’s the exact checklist:
Checklist for Spotting Accumulation
Step 1: Find the last significant low
- Look at the daily or weekly chart
- Where did the stock bottom out recently?
- Example: Reliance bottomed near its accumulation zone (pre-bonus ~₹2,850 / post-bonus ~₹1,200) in late 2024
Step 2: Check for multiple touches
- Does price touch that low level multiple times?
- Each touch = more stops getting placed below (retail traders “selling the breakdown”)
- Multiple touches = more stops = more liquidity for smart money to absorb
Step 3: Look for the bounce
- After hitting the low, does price bounce back with volume?
- Is the bounce choppy (supply still present) or smooth (supply exhausted)?
- Choppy bounces = smart money is still buying
- Smooth bounces = smart money has accumulated enough, ready to markup
Step 4: Watch for consolidation
- After the bounce, does price range-trade for several days/weeks?
- This is smart money accumulating silently
- Volume should decrease during consolidation (not much selling pressure)
Step 5: Watch for the breakout
- When consolidation breaks with volume, smart money is now moving into markup phase
- This is your signal to consider going long
Example: TCS Accumulation (Late 2024)
- Low point: TCS fell to ₹3,280 (oversold on panic about US slowdown)
- Multiple touches: Price touched ₹3,280 three times over 2 weeks
- Bounce with volume: Next day, price bounced to ₹3,320 on 3x average volume
- Consolidation: TCS ranged between ₹3,300-₹3,400 for 3 weeks
- Breakout: Broke above ₹3,400 with volume, signaling the start of a new uptrend
If you had spotted this pattern, you could have entered at ₹3,400 with conviction, knowing smart money was long and pushing the market up.
How to Spot Smart Money Distribution
Distribution is when smart money is exiting. This is crucial to recognize so you don’t buy into a trap:
Checklist for Spotting Distribution
Step 1: Identify the recent high
- Where did the stock recently top?
- This is where smart money will distribute
Step 2: Look for rejection at resistance
- Price pushes above the high, but then reverses
- Smart money is selling into the panic buying
- Retail traders think it’s a breakout and buy; smart money sells into them
Step 3: Watch for lower highs
- After rejection, price tries again but fails to make a new high
- This is the “lower high” = structure is breaking
- Distribution is happening
Step 4: Check volume
- High volume on the rejections = smart money offloading
- Low volume on bounces = retail trying to sustain the move
- This mismatch signals distribution
Step 5: The breakdown
- When lower highs are confirmed, look for a break below the recent swing low
- This signals the start of markdown phase
- Time to exit longs or consider shorts
Example: HDFC Bank (NSE: HDFCBANK) Distribution (Mid-2024)
- High point: HDFC Bank hit ₹1,650 (all-time high attempt)
- Rejection: Price pushed to ₹1,655, but big red candle closed at ₹1,625
- Lower high: Next push only reached ₹1,640 (lower than ₹1,655)
- Volume mismatch: Rejections had 2x volume, bounces had 0.5x volume
- The breakdown: Price broke below ₹1,600, starting a 60-point decline
If you recognized the distribution pattern, you would have exited your long positions at ₹1,640 with a small loss, instead of holding and watching a 60-point drop.
Key Smart Money Concepts You Must Know
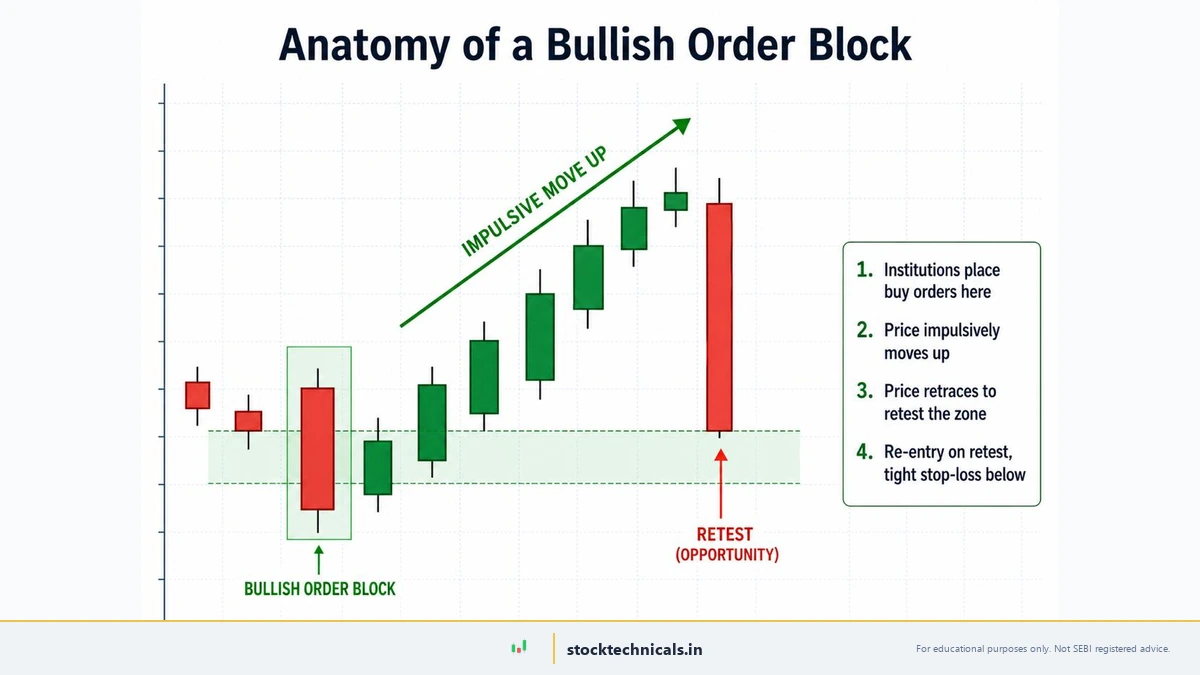
Order Blocks
An Order Block is the last opposing candle before a strong impulsive move in the opposite direction. In a bullish setup on NSE: NIFTY or NSE: BANKNIFTY, the OB is the LAST RED candle before a sharp green impulsive run-up — that’s where institutional traders absorbed sell orders before driving price higher. In a bearish setup, the OB is the last green candle before a sharp red drop. The OB acts as a future support (bullish) or resistance (bearish) zone — when price retraces back to it, smart-money traders look for entry on the retest with a stop-loss just beyond the candle’s range.
The next time price returns to that zone, it acts as support because smart money is defending their position.
How to use it: When price pulls back to an order block, it’s a high-probability entry. Smart money is buying again.
example: Bank Nifty made a big up candle at ₹45,000-₹45,500, then pulled back. Price stayed above ₹45,000 for 3 weeks (smart money defending). This was a strong buy zone.

Fair Value Gaps (FVGs)
A Fair Value Gap is a zone on the chart where there are no trades. It happens when a big candle gaps past a level without closing that gap.
Smart money uses FVGs as:
- Accumulation zones (if the gap is above, they’ll knock price back down to fill it and buy)
- Take-profit targets (if they’re long and price gaps up, they’ll sell into strength when price fills the gap)
Mitigation Blocks
A mitigation block is where smart money stopped their previous trade and placed their stop loss.
When price returns to these zones, it creates a collision between:
- Smart money defending their old position (buying to support)
- Retail traders placing stops (selling into weakness)
This collision creates explosive moves.
Breaker Blocks
These are zones where smart money will “break” the market structure to liquidate retail traders and accumulate more.
For example:
- Price is in an uptrend (higher highs, higher lows)
- Smart money suddenly pushes below the recent low (breaking the structure)
- Retail stops get hit below the low
- Smart money catches all that selling, then reverses price up sharply
This is why breakouts often fail on the first try.
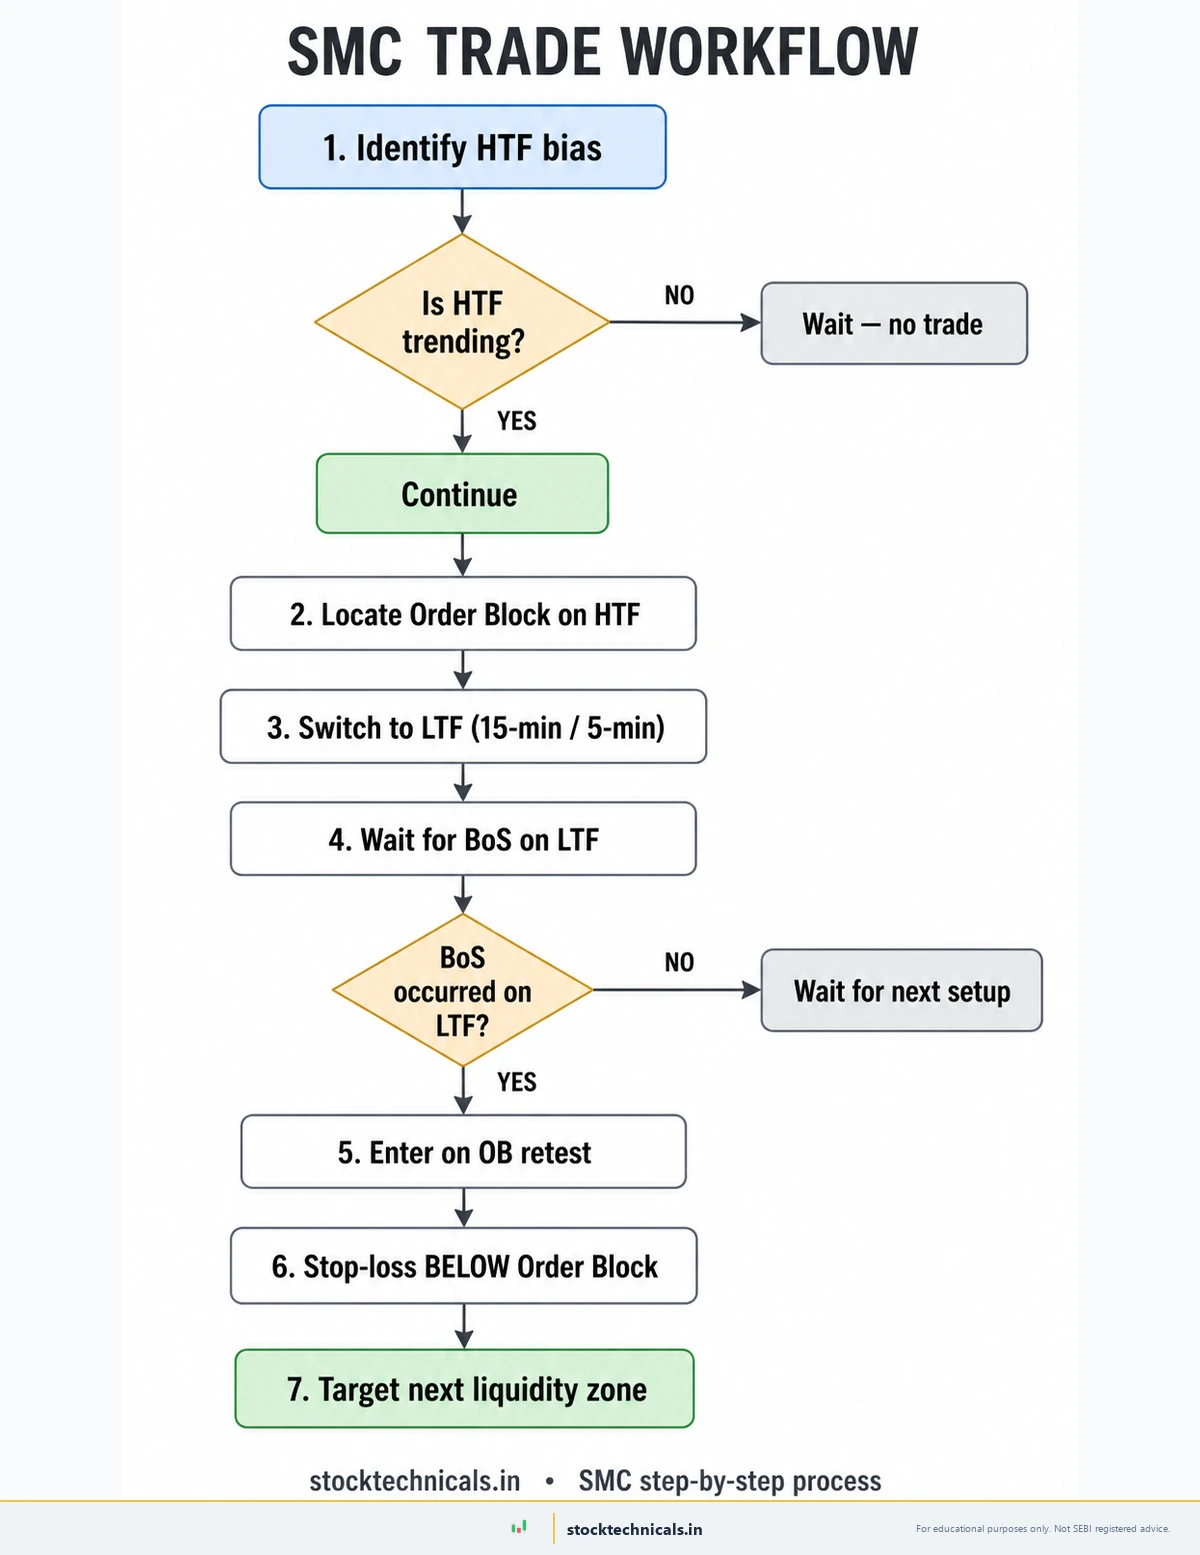
The SMC Trading Strategy: Step by Step
This is the procedural workflow most modern SMC traders use on Indian markets — moving from higher-timeframe (HTF) bias all the way down to a precise lower-timeframe (LTF) entry on an Order Block retest. Walk through it the same way every trade, in this exact order, until it becomes mechanical.
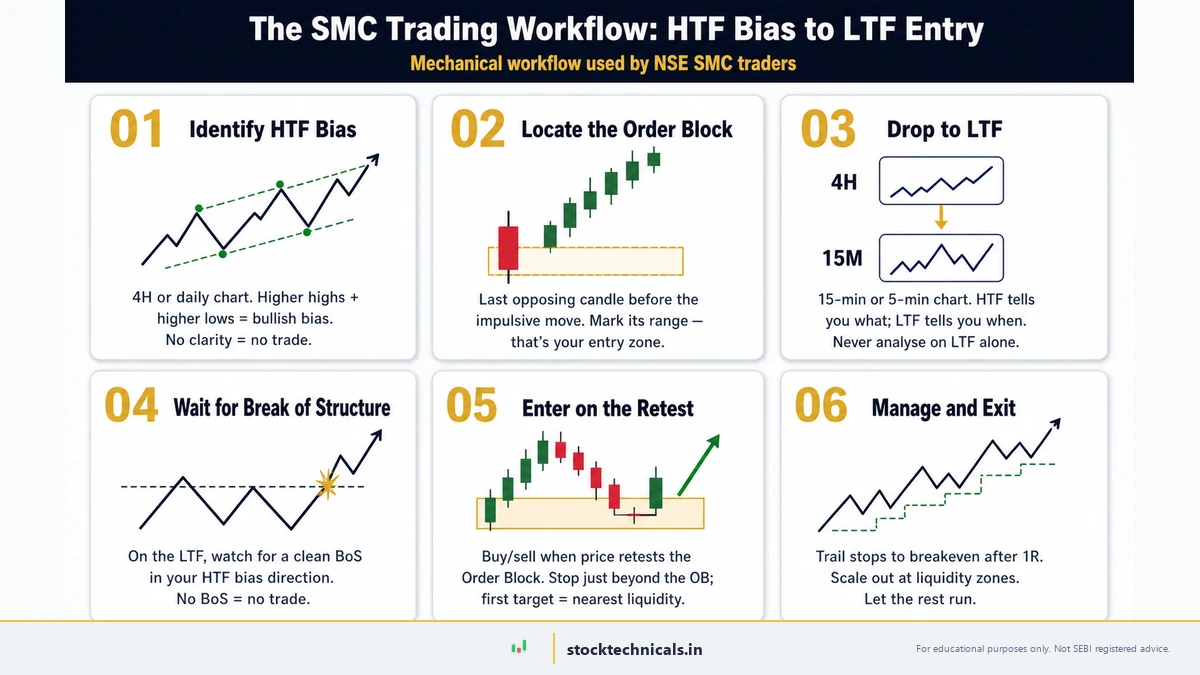
Step 1: Identify Higher-Timeframe Bias
Open the 4H or daily chart of NSE: NIFTY, NSE: BANKNIFTY, or the stock you’re trading. Is the structure making higher highs and higher lows (bullish bias) or lower highs and lower lows (bearish bias)? If it’s choppy with no clear pattern, there is no trade — wait for clarity. Your HTF bias dictates the direction of every trade you take below.
Step 2: Locate the Order Block on the Higher Timeframe
Once HTF bias is clear, find the most recent Order Block — the last opposing candle before the impulsive move in your bias direction. For a bullish bias, look for the last red candle before a sharp green run-up. Mark its high and low — that range becomes your entry zone. Institutional orders sit there, and price gravitates back to fill them.
Step 3: Switch to a Lower Timeframe (15-min or 5-min)
Drop down to the 15-minute or 5-minute chart for entry timing. The HTF tells you what to do; the LTF tells you when. Most retail traders skip this and trade the entire setup on the LTF — that is where mistakes start. The LTF should only confirm what the HTF already told you.
Step 4: Wait for Break of Structure on the LTF
On the LTF, watch for a Break of Structure in your bias direction. For a long position, you want price to break above the most recent LTF swing high. The BoS confirms momentum is back in your direction and tells you the retracement is over. Without an LTF BoS, you are guessing — never enter on hope alone.
Step 5: Enter on the Order Block Retest
After the LTF BoS, wait for price to retrace back to the Order Block zone you marked on the HTF. Enter on the touch — limit order at the upper boundary of the OB for longs, lower boundary for shorts. Do not chase if price runs away from the zone; the next setup is always around the corner. Discipline beats FOMO.
Step 6: Place Stop-Loss Just Outside the Order Block
Your stop goes just outside the Order Block — below it for longs, above it for shorts. Add a small buffer (5-10 points on NIFTY, 15-20 on BANKNIFTY, or 0.5% on equity) so normal noise does not wick you out. This is a hard stop placed at the broker, not a mental note. NSE intraday flash spikes can blow past mental stops in seconds.
Step 7: Target the Next Liquidity Zone
Your target is the next obvious liquidity pool — typically the most recent swing high (for longs) or swing low (for shorts), where retail stops cluster. That is where smart money expects price to run because that is where the orders are. A 2:1 or 3:1 reward-to-risk ratio is the standard; below 1.5:1, the trade is not worth taking.
Common SMC Mistakes That Retail Traders Make
Smart Money Concepts looks deceptively simple on a chart — find the Order Block, wait for a Break of Structure, enter on the retest. The execution is where retail accounts blow up. Five mistakes account for the majority of losses I see across NSE traders learning SMC: trading only the lower timeframe, treating every Fair Value Gap as an entry, skipping the stop-loss, ignoring scheduled news, and copying gurus without sizing context. Each one is fixable, but only if you name it first.
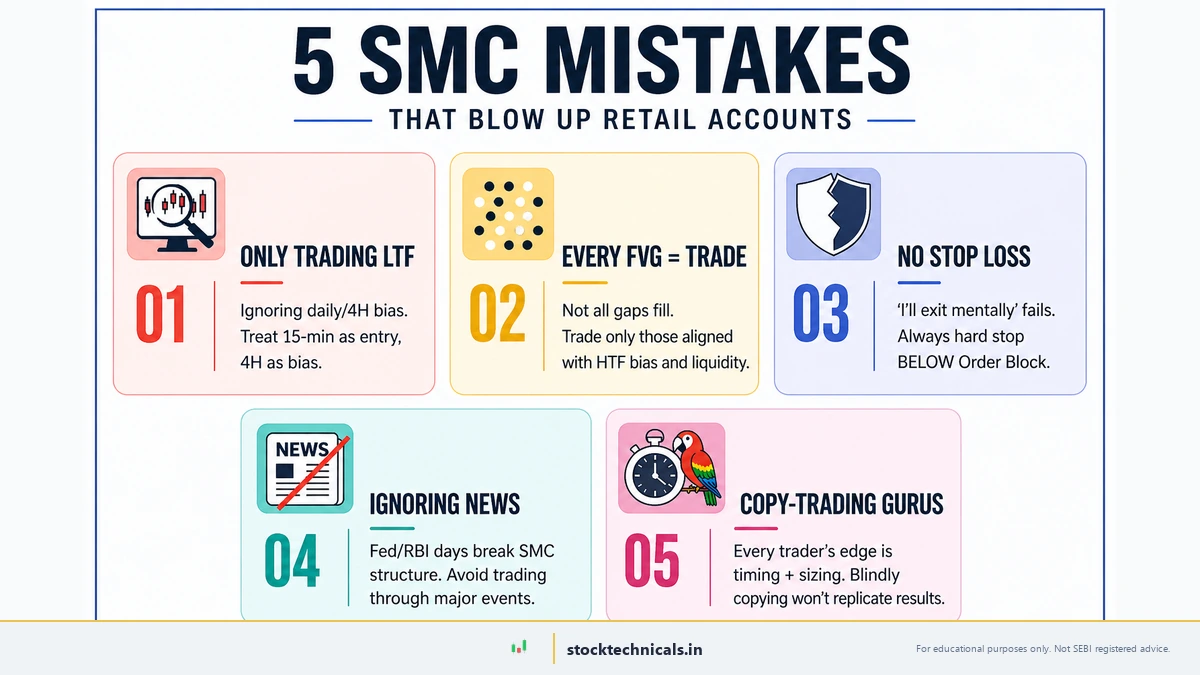
Mistake 1: Only Trading the Lower Timeframe (LTF)
The biggest mistake new SMC traders make is treating a 5-minute or 15-minute chart as their primary bias. Lower timeframes are full of noise — every minor swing looks like a Break of Structure, every dip looks like a liquidity grab. Without a higher-timeframe (HTF) filter (daily or 4-hour), your trade direction is just guesswork. Rule: pick your bias from the 4H or daily, then drop to 15-min only for entry timing. If 4H NSE: NIFTY is bullish, take only longs on 15-min — never shorts. The 4H is the steering wheel; the 15-min is the accelerator.
Mistake 2: Treating Every FVG as a Trade
Fair Value Gaps appear on almost every impulsive move, but not every gap fills — and certainly not every gap is a trade. A high-probability FVG sits at a higher-timeframe Order Block, aligns with a liquidity grab, and forms during a clean trending session. A throwaway FVG appears in the middle of a range, after a news spike, or in a low-volume window. Rule: trade only FVGs that align with HTF bias AND a confluence factor (OB retest, swing low, prior support, key round number). Skip the rest. Quality over quantity is how SMC traders survive the first six months on NSE: NIFTY and NSE: BANKNIFTY.
Mistake 3: No Stop Loss (“I’ll Exit Mentally”)
Mental stops fail because emotion overrides discipline. In an SMC trade, your stop goes BELOW the Order Block (for longs) or ABOVE the OB (for shorts) — at a fixed price, placed at the broker the moment you enter. NSE intraday flash spikes can blow past mental stops in seconds, especially around 9:15 AM open or 3:00 PM close. The cost of a 0.5% wider stop placed at the broker is far less than the cost of one trade where you “thought it would come back.” A hard stop is the only way to survive ten consecutive losses without compounding into a 50% drawdown.
Mistake 4: Ignoring News (Fed/RBI Days Break SMC Structure)
Smart Money Concepts is structural — it works when price is responding to liquidity, not to a news headline. On Fed FOMC days, RBI MPC days, Union Budget day, or major Indian corporate earnings, the structure breaks: gaps appear, liquidity zones get swept without retracement, Order Blocks fail. Rule: avoid taking new SMC trades 30 minutes before scheduled major events. Hold existing positions only if your stop is well outside the volatility band. The NSE economic calendar and RBI policy schedule should be the first tabs you check before sitting at the screen.
Mistake 5: Copy-Trading Gurus
Watching another trader’s chart with their entries and exits feels like a shortcut, but it skips the part that actually matters: timing and position sizing matched to YOUR account. A guru entering with ₹50L capital and a 2% rule has different stop placement, target distance, and tolerance than you do with ₹2L. Even if their setup is genuine, your execution will mistime it — and your slippage on a 1-lot Bank Nifty option is meaningfully worse. Use SMC content for FRAMEWORK education, not for live trade signals. Every trader’s edge is their own timing plus sizing — neither of which can be copied.
SMC on Different Timeframes
SMC works on all timeframes, but the interpretation changes:
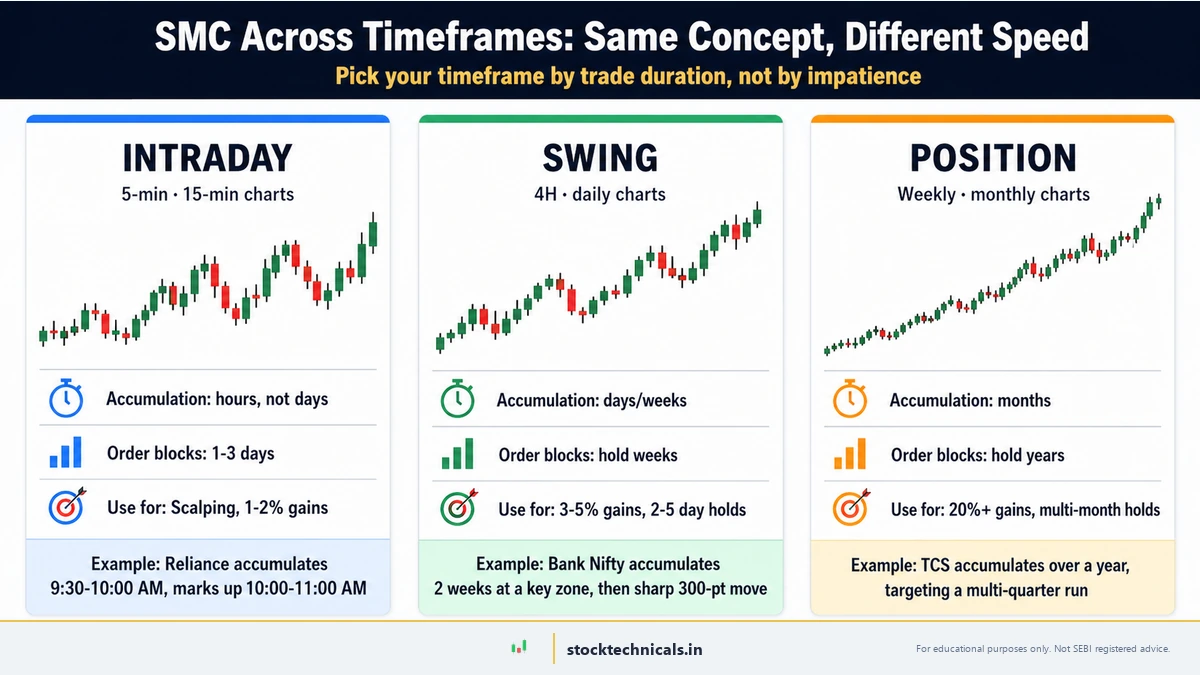
Intraday (5-min, 15-min charts)
- Accumulation/distribution happens in hours, not days
- Order blocks last 1-3 days before being swept
- Used for: Scalping, intraday trading, quick 1-2% profits
- Example: Reliance on a 5-min chart accumulating 9:30-10:00 AM, then markup 10:00-11:00 AM
Swing (4-hour, daily charts)
- Accumulation/distribution happens in days/weeks
- Order blocks hold for weeks
- Used for: Swing trading, 3-5% gains, holding 2-5 days
- Example: Bank Nifty accumulating over 2 weeks at ₹45,000 zone, then a sharp 300-point move up
Position (weekly, monthly charts)
- Accumulation/distribution happens over months
- Order blocks hold for years
- Used for: Long-term investing, 20%+ gains, holding for months**
- Example: TCS accumulating at the ₹3,200-₹3,300 zone in early 2025, targeting ₹4,300+ as the multi-quarter swing target
Tools to Help You Trade SMC
While SMC is about price action, some tools can speed up your analysis:
Free Tools
- TradingView (Free): Chart service, mark your order blocks manually, identify structure
- Zerodha: Built-in technical analysis, volume profile to see where volume clusters
- Screener.in: Daily/weekly structure, track multiple stocks
Paid Tools (Optional)
- TradingView Premium: Advanced order block templates, better drawing tools
- Smart Money Concepts Indicators: Some paid indicator developers have SMC-specific alerts (but remember, the indicator just automates what you should see)
Important: SMC was pioneered by traders using nothing but a clean chart. Don’t become dependent on tools. The real skill is spotting these patterns by eye.
Practical Examples on Indian Stocks
Example 1: Reliance Accumulation (₹2,800 Level)
Setup:
- Reliance fell to ₹2,800 (support)
- Price touched ₹2,800 three times (cluster of stops below)
- Bounced to ₹2,850 with 2x volume
- Consolidated at ₹2,820-₹2,850 for 10 days (low volume = smart money accumulating)
- Broke above ₹2,850 with 3x volume (smart money entering markup phase)
Entry: Buy above ₹2,850, stop below ₹2,800, target ₹2,950
Result: Reliance rallied to ₹2,950 over 3 weeks = +3.6% profit
Example 2: Bank Nifty Distribution (₹46,500 Level)
Setup:
- Bank Nifty rallied to ₹46,500 (resistance)
- Failed to break above ₹46,500 three times
- Each failure had increasing volume (smart money selling)
- Bounces to ₹46,400 had 0.5x volume (weak retail buying)
- Lower low formed at ₹46,200 (structure breaking)
Entry: Short below ₹46,200, stop above ₹46,500, target ₹45,800
Result: Bank Nifty fell to ₹45,800 over 5 days = -1.4% profit on short
SMC Trading Rules for Beginners
- Trade confluence, not single signals. Minimum 3 factors must align.
- Never trade against the daily trend. If daily is downtrend, don’t go long on intraday bounces.
- Wait for the retest. Don’t buy the first breakout; wait for the pullback and retest.
- Use tight stops. With SMC, you know exactly where to stop out (below the low for long, above the high for short).
- Let winners run. Once smart money is in control, let the position fly. Don’t take profits too early.
- Scale into positions. Don’t risk your entire bankroll on one setup. Build positions over 2-3 candles.
- Keep a trading journal. Record every trade, what worked, what didn’t. SMC requires pattern recognition.
How to Practice SMC
Week 1-2: Study Charts
- Look at 50 daily charts of NSE stocks
- Mark the order blocks, accumulation zones, distribution zones
- Don’t trade yet; just practice spotting
Week 3-4: Paper Trade
- Use Zerodha’s free paper trading or TradingView alerts
- Place hypothetical trades based on your SMC analysis
- Track your win rate
Week 5-6: Trade Small
- Start with 1 share of Bank Nifty or mini Nifty options
- Trade your setups with real money
- Track results
Week 7+: Build Consistency
- Aim for 65%+ win rate
- Build position sizing rule: Risk 1% per trade
- Keep refining your pattern recognition
Real-World SMC Trading Examples on Indian Stocks
Let me walk you through some actual setups you might have seen on NSE stocks. Note on prices: some examples below use pre-bonus levels for Reliance and HDFC Bank — the structural lessons are unchanged after the 1:1 bonus issues, but the absolute rupee values are roughly half today. Focus on the structure, not the price tags.
Example 3: Infosys Accumulation + Markup (₹1,680 Zone)
Timeline: January 2025
The Accumulation:
- Infosys fell to ₹1,680 (on tech sector weakness)
- Price touched ₹1,680 on 4 different days
- Each touch had increasing volume (smart money buying the panic)
- Consolidation formed between ₹1,680-₹1,720 for 2 weeks
The Markup:
- Volume on the breakout 15-min bar surged to ~1.5M shares vs the ~800K average for that intraday window — a roughly 2x institutional footprint relative to recent same-window prints
- Price broke above ₹1,720 with a large green candle
- Followed by 5 consecutive up days
- Hit ₹1,850 within 3 weeks = +7.6% from the ₹1,720 breakout entry (or +10.1% from the ₹1,680 accumulation low for swing traders who scaled in inside the consolidation)
How to Trade It:
- Entry: Buy break above ₹1,720 on high volume
- Stop loss: Below ₹1,680 (where accumulation started)
- Initial target: ₹1,800
- If that breaks: Trail stop to breakeven and let it run to ₹1,850+
Example 4: Bank Nifty False Breakout (₹46,800 Level)
Timeline: February 2025
The Setup:
- Bank Nifty rallied to ₹46,800 (new swing high)
- Large bull candle broke above previous resistance
- Retail traders saw “breakout” and bought aggressively
- Next day: Price opened at ₹46,750 but closed at ₹46,400 (large red candle)
- This is a bearish reversal candle—smart money dumping into the panic buying
The Shakeout:
- Retail traders with stops at ₹46,600 got shaken out
- Smart money accumulated all that selling volume
- Price bounced back to ₹47,000 within 2 days
- Those who exited at ₹46,400 missed 600 points
How to Avoid This:
- DON’T buy the first breakout
- Wait for a retest of the broken level (₹46,700)
- Buy the retest with a smaller stop (more precise entry)
- Or use a longer timeframe (4-hour or daily) to confirm breakouts
SMC Psychology: Understanding What Smart Money Wants
Smart Money Concepts isn’t just technical—there’s a psychological component you need to understand:
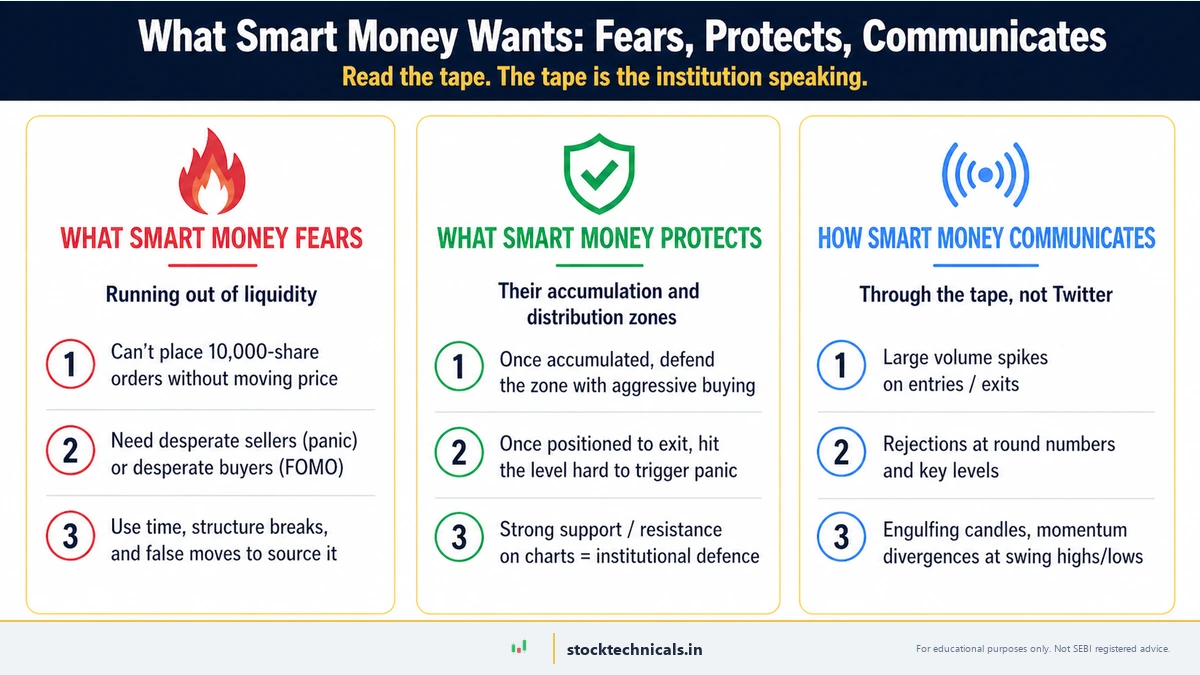
What Smart Money Fears
Running out of liquidity: Smart money’s biggest problem is finding enough volume to accumulate or distribute large positions. They can’t just place a 10,000-share order; the market would immediately move against them.
So they use tricks to find liquidity:
- Create panic (break structure, hit stops) to find desperate sellers
- Create hope (false breakouts, higher highs) to find desperate buyers
- Use time (let people forget old price levels, then accumulate there)
What Smart Money Protects
Their accumulation zones: Once they’ve accumulated at ₹100, they’ll defend that zone aggressively. If price drops back to ₹100, they’ll buy to push it up. This creates strong support.
Their distribution zones: Once they want to exit at ₹120, they’ll hit hard to break that level and cause panic.
How Smart Money Communicates
Smart money doesn’t need to post on Twitter. They communicate through:
- Large volume spikes (entering or exiting)
- Rejections at round numbers (stop at ₹500, ₹1000, etc.)
- Specific candle patterns (engulfing candles, reversals at support/resistance)
- Momentum divergences (price makes new highs, but momentum doesn’t follow)
By learning to read these signals, you’re essentially listening to what smart money is saying.
The Three Biggest SMC Trading Failures and How to Fix Them
Failure 1: Chasing Trades
What happens: You see a stock rallying on an hour-long timeframe. You miss the entry. By the time you decide to buy at ₹500, price has already run to ₹520. You buy at ₹520 hoping for ₹550. Price reverses to ₹490. You panic-sell at ₹495. Loss: ₹25 per share.
Why it happens: FOMO (Fear Of Missing Out). You see the profit others made and want a piece.
The SMC fix: Only trade setups where 3+ factors align AND price gives you a clean entry. If you’re chasing, it’s not a good setup. Wait for the next one. There are 250+ trading days per year—you don’t need to force every trade.
Failure 2: Not Using Proper Position Sizing
What happens: You find a great accumulation setup. You’re excited. You risk 5% of your account on this one trade. The setup fails (false signal). You’re down 5% in one day.
Why it happens: Overconfidence. You think your setup is foolproof.
The SMC fix: Use the 1% rule: Risk only 1% of your account per trade. This means:
- If you have a ₹1,00,000 account, risk only ₹1,000 per trade
- If your stop loss is 50 points away, you can buy 20 shares maximum
- This seems small, but it keeps you in the game when setups fail
Failure 3: Trading Without a Plan
What happens: You see a good setup and buy. Then price drops 1% and you exit early (trying to protect profit). Then it rallies 5% without you. You realize you should have held. Next time, you hold through a legitimate reversal and lose 3%.
Why it happens: No clear plan. You’re making decisions based on emotions, not structure.
The SMC fix: Write your plan before you enter:
- Entry price: ₹X
- Stop loss: ₹Y (if wrong, I exit here)
- Minimum target: ₹Z1
- Maximum target: ₹Z2
- Timeframe: Hold for 2-5 days
Once written, stick to it. No emotions allowed.
SMC vs Candlestick Patterns: What’s the Difference?
You might wonder: “Isn’t SMC the same as learning candlestick patterns?”
No. Here’s why:
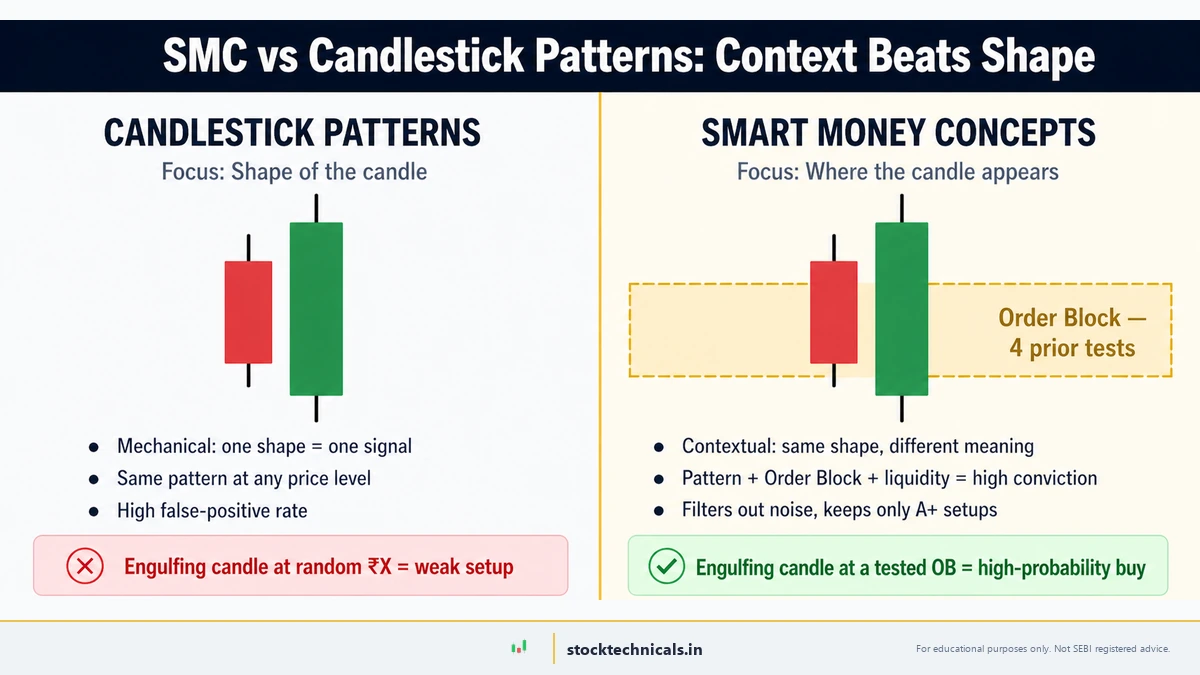
Candlestick Patterns:
- Focus on the shape of candles
- Example: “Engulfing candle = trend reversal”
- Mechanical: one pattern = one signal
- Problem: Same patterns appear at weak levels too
SMC:
- Focus on WHERE the pattern appears
- Example: “Engulfing candle at accumulation zone = strong buy”
- Contextual: The same pattern means different things in different locations
- Advantage: You know which patterns matter
Example: A bullish engulfing candle at ₹1,680 (support zone with multiple prior tests in the prior fortnight) is much more significant than one at ₹1,750 (random price level).
SMC teaches you to value context over shape.
7 Characteristics of Smart Money Traders That You Should Adopt
If you want to trade like smart money, adopt these characteristics:
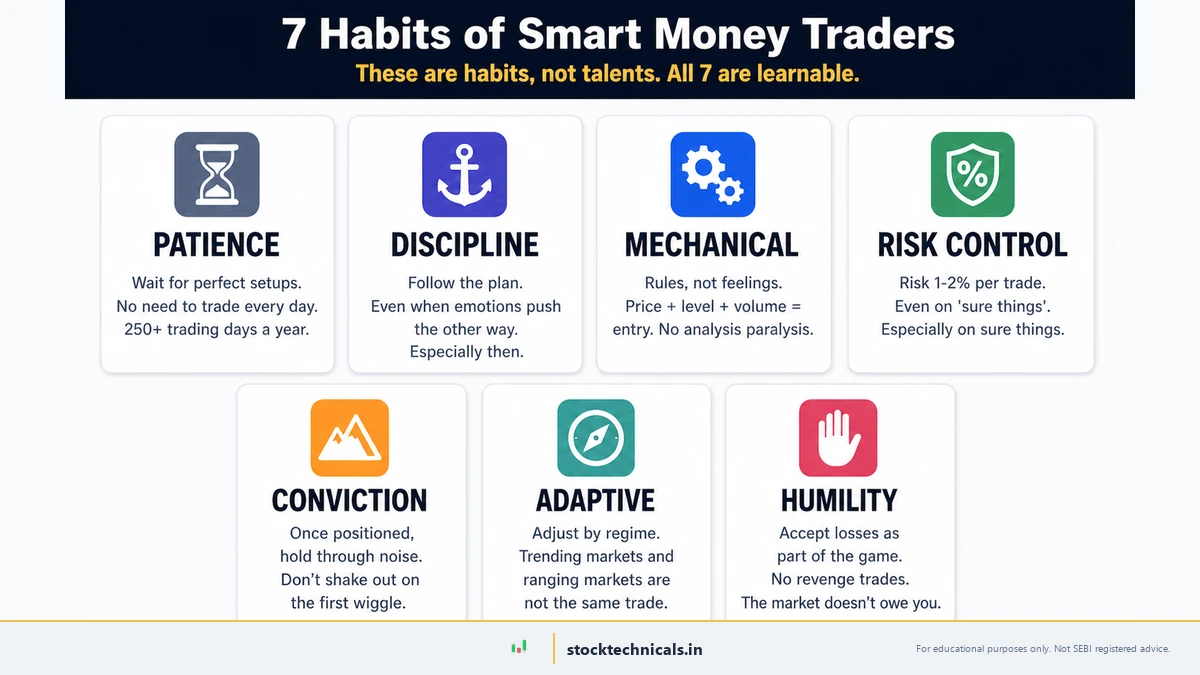
- Patience: They wait for perfect setups. They don’t need to trade every day.
- Discipline: They follow their plan, even when emotions say otherwise.
- Mechanical thinking: They use rules, not feelings. “Price breaks this level + volume is high = I buy” (no analysis paralysis).
- Risk management: They risk 1-2% per trade, even on “sure things.”
- Conviction: Once positioned, they hold through noise and oscillations.
- Adaptive: They adjust their strategy based on market conditions (trending vs ranging).
- Humble: They accept losses as part of the game. No revenge trading.
The good news: These are learnable. You don’t need genius-level intelligence—you just need to adopt these habits.
Mistakes Specific to Indian Markets
If you’re trading on Zerodha, Angel One, or other Indian brokers, here are SMC-specific mistakes unique to Indian markets:
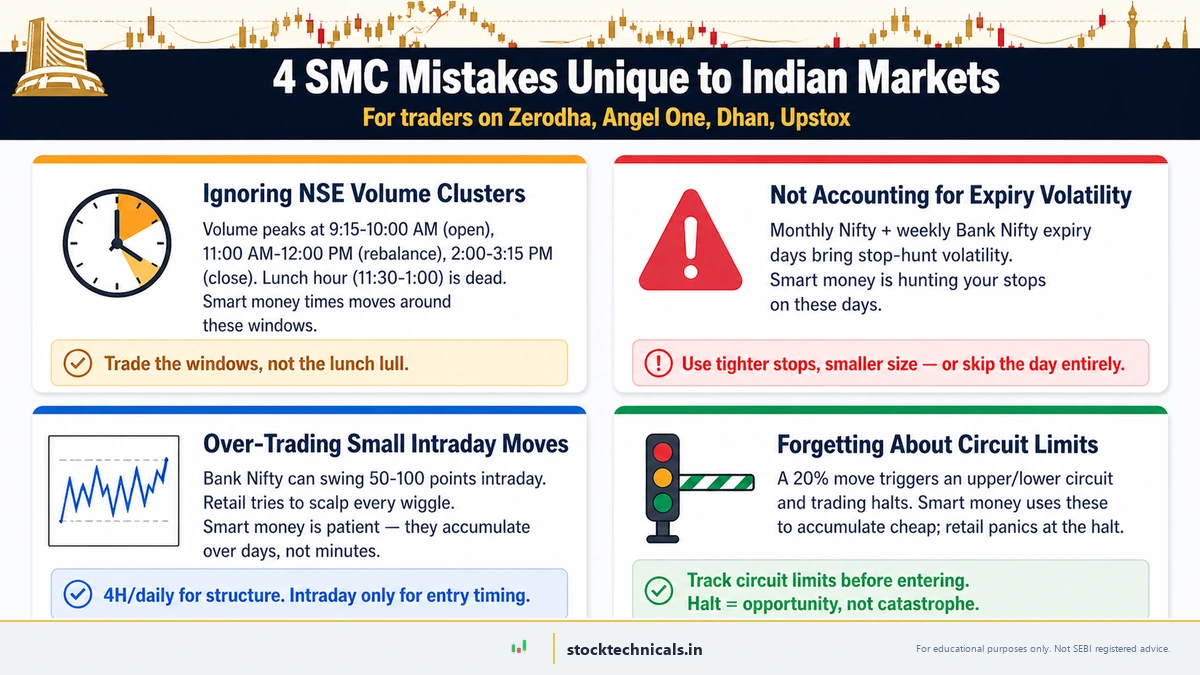
Mistake 1: Ignoring NSE Volume Clusters
NSE stocks often have volume clusters at:
- First 45 minutes (9:15-10:00 AM): Highest volume; cleanest moves; institutional flow most visible
- Midday lull (12:00-1:30 PM): Thinnest volume; wide spreads; avoid forcing SMC entries here
- Final hour (2:30-3:30 PM): Volume rebuilds into the close; expiry-day stop hunts cluster here
NSE intraday volume is U-shaped — heavy at the open, thin midday, heavy into the close. Smart money times entries around the volume peaks; the midday trough punishes small-timeframe SMC setups with weak follow-through.
Mistake 2: Not Accounting for Expiry Day Volatility
Every Tuesday (Nifty weekly options expiry, after the Sep 1, 2025 shift from Thursday) and on monthly expiry dates for Bank Nifty and stock F&O, volatility explodes. Stops get shaken out more aggressively. Smart money is hunting those stops. Note: NSE discontinued the weekly Bank Nifty expiry effective Nov 13, 2024 — only the monthly Bank Nifty expiry remains.
SMC fix: On expiry day, use tighter stops and smaller position sizes. Or skip trading altogether.
Mistake 3: Over-Trading Small Intraday Moves
Bank Nifty can move 50-100 points intraday. Retail traders see this and try to scalp every move. But smart money is patient—they accumulate over days, not minutes.
SMC fix: Use 4-hour and daily charts for your main structure. Use intraday charts only for entry timing (retest confirmation).
Mistake 4: Forgetting About Circuit Breakers
Indian stocks have exchange-assigned circuit bands (2%, 5%, 10%, 20%, or no-limit). When a band is hit, trading does not fully stop — only one-sided orders are accepted (sells at upper band, buys at lower). Index-level breakers (10%/15%/20%) are the ones that trigger market-wide halts of 15-45 minutes. Smart money exploits these mechanics; retail panics.
SMC fix: Track circuit limits before entering. Know that a 20% up move might trigger a circuit.
The Bottom Line
Smart Money Concepts give you a lens for reading market structure the way institutional traders do. Instead of fighting random-looking price action, you start to see the logic: accumulation zones, distribution traps, and the inevitable markdown. SMC is not a magic system — it’s a framework. Combine it with traditional support/resistance, volume analysis, and disciplined risk management. Practice reading charts through the SMC lens for 60 days before trading with real money.
What are Smart Money Concepts (SMC) in trading?
Smart Money Concepts (SMC) is a price-action framework that maps where institutional traders — mutual funds, hedge funds, FIIs, and proprietary desks — likely entered and exited positions. SMC relies on four core structural ideas: Break of Structure (BoS), Change of Character (CHoCH), Order Blocks (OB), and Liquidity Zones. On Indian markets like NSE: NIFTY and NSE: BANKNIFTY, SMC is most reliable on 15-minute and higher timeframes.
What is Break of Structure (BoS) in SMC?
Break of Structure (BoS) happens when price breaks the most recent swing high in an uptrend (or swing low in a downtrend), confirming trend continuation. For example, if NSE: NIFTY makes a swing high at 22,400 and later prints a new high above 22,400, that is a BoS to the upside. It is the single most important confirmation signal in SMC — traders wait for BoS before taking trend-continuation trades.
What is Change of Character (CHoCH)?
Change of Character (CHoCH) marks the first signal of a potential trend reversal. In an uptrend, CHoCH appears when price breaks BELOW the most recent higher-low swing — the structure shifts from higher-highs-and-higher-lows to a new pattern. It is weaker than BoS as a standalone signal but invaluable when paired with an Order Block retest on a 1H or 4H chart.
What is an Order Block in SMC trading?
An Order Block (OB) is the last bullish candle before a strong bearish move (bearish OB), or the last bearish candle before a strong bullish move (bullish OB). The logic: institutions leave unfilled orders behind in that zone. When price retraces to the OB, SMC traders expect a reaction. On NSE: BANKNIFTY 15-minute charts, valid OBs typically lie at intraday swing pivots.
Does Smart Money Concepts work on Indian stock market?
Yes — SMC principles are price-action-based and work on any liquid market including NSE: NIFTY, NSE: BANKNIFTY, and large-cap equities like NSE: HDFCBANK, NSE: RELIANCE, NSE: TCS. The caveat: SMC requires reasonable liquidity and clean structure, so illiquid small-caps and mid-caps may give false signals. Focus on Nifty 50 constituents and major indices for best reliability.
How is SMC different from traditional technical analysis?
Traditional technical analysis uses indicators (RSI, MACD, moving averages) and pattern recognition (head-and-shoulders, triangles). SMC is purely structural — it reads market structure through swing highs/lows, then identifies institutional-activity zones (OBs, liquidity pools, FVGs). Most experienced traders combine both: SMC for entry location, traditional indicators for momentum confirmation.
Which timeframe is best for SMC trading in India?
For beginners, start with the daily and 4-hour timeframes on NSE: NIFTY or NSE: BANKNIFTY — this filters out intraday noise and shows cleaner structure. For intraday SMC trading, the 15-minute chart is the industry default. Always bias your trades with the higher timeframe: if the 4H is bullish, take only bullish setups on the 15-min.
What are the main risks of trading Smart Money Concepts?
SMC is subjective — two traders can identify different Order Blocks on the same chart. Confirmation bias is the #1 risk: traders see OBs that confirm their bias and ignore ones that don’t. Secondary risks: low-liquidity stocks give false BoS signals, SMC works poorly during earnings or news-driven gaps, and over-reliance on SMC without stop-loss discipline compounds losses quickly. Always use a position-sizing framework and pre-trade checklist.
Test Your Knowledge
Q1: What does Break of Structure (BoS) confirm in Smart Money Concepts?
Q2: An Order Block (OB) is typically:
Q3: A Liquidity Grab (stop hunt) most often looks like:
Q4: When a Change of Character (CHoCH) appears in an uptrend on NSE: NIFTY:
Q5: Which timeframe combination is most recommended for Smart Money Concepts trading in Indian markets?
RISK NOTICE
Smart Money Concepts (SMC) is a framework for interpreting market structure — not a trading system with guaranteed outcomes. All trading involves risk of loss. The SEBI study shows 93% of intraday traders lose money. SMC analysis requires practice, backtesting, and risk management. Never trade based on a single concept without confirmation from price action and volume. This content is for educational purposes only and is not investment advice.