A gap in trading is a vertical price jump where the opening price is significantly above the prior close (up gap) or below it (down gap). On a chart, it appears as an empty space between candles. Gaps are not random — they carry different information depending on where they appear in a trend. This article classifies the four gap types (common, breakaway, runaway, exhaustion) with seven NSE examples and trade-plan rules for each.

Chart window: Sep 2023 – Feb 2024 · Data refreshed April 18, 2026 · Source: NSE (daily OHLC)
Key Takeaways
- Common gap: within a range, low volume. ~85% filled within 5 days. Skip or fade.
- Breakaway gap: out of consolidation, 3x+ volume. Starts new trend. Not filled in ~75% of cases over 30 days.
- Runaway gap: mid-trend acceleration. Confirms strength. Typically holds, roughly halfway to target.
- Exhaustion gap: end of extended trend. Often reversal signal. ~75% filled within 15 days.
- Volume is the critical filter. 3x+ average = institutional activity. Under 1.5x = likely noise.
- Target: pattern or trend distance projected from gap level in gap direction.
The Four Gap Types

Chart data: Evergreen reference · Last reviewed April 18, 2026
- Common Gap: Forms inside a trading range. Usually small (under 1.5%) on below-average volume. Fills within 1-5 days. No trade value.
- Breakaway Gap: Gaps out of a consolidation or chart pattern. High volume (3x+ average). Starts a new trend. Usually not filled.
- Runaway Gap (Continuation Gap): Occurs mid-trend. Price accelerates in the existing trend direction. Confirms trend strength. Roughly halfway to the final target.
- Exhaustion Gap: Occurs at the end of an extended trend. Represents the final push before reversal. Usually gets filled within 15 days.
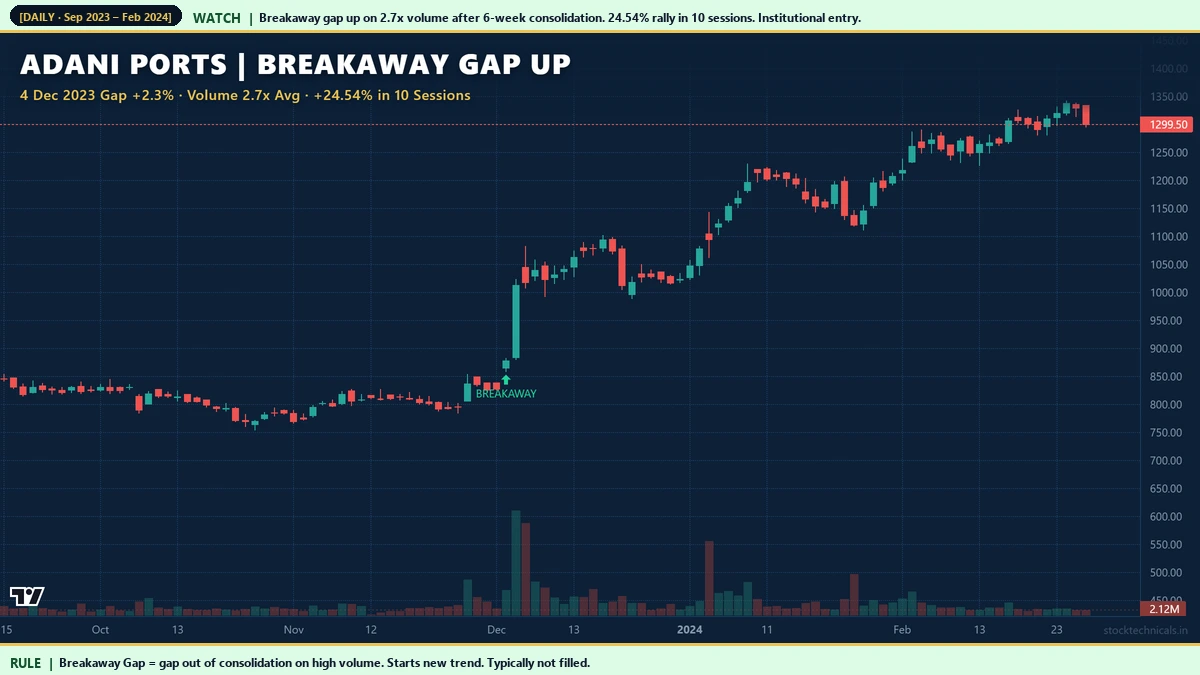
Hero Example: Adani Ports December 2023 Breakaway Gap
Bharti Airtel October 2017 Breakaway Gap

Chart window: Aug – Dec 2017 · Data refreshed April 18, 2026 · Source: NSE (daily OHLC)
Bharti Airtel (NSE: BHARTIARTL)’s October 13, 2017 breakaway gap had an unusually strong volume signature — 10.4 times the 20-day average. That volume level indicates major institutional activity, usually triggered by a news event or earnings surprise. Gaps with 5-10x volume are much more reliable than gaps with 2-3x volume. Over the next 10 sessions, the stock rallied 14.39%.
L&T May 2019 Breakaway Gap

Chart window: Mar – Aug 2019 · Data refreshed April 18, 2026 · Source: NSE (daily OHLC)
L&T’s May 20, 2019 breakaway gap is a smaller example: 2.08% gap on 2.73x volume. Even mid-size breakaway gaps with moderate volume qualify — they just produce smaller follow-through (7.44% here vs 14-24% on larger gaps). The trade-off: smaller gaps offer better R:R because the stop-loss is tighter.
Gap Trading Playbook

Chart data: Evergreen reference · Last reviewed April 18, 2026
- Breakaway gap: Enter on gap day close above prior range (or below for bear). Stop below gap bottom (for bull gap). Target: prior-range height projected up from breakout.
- Runaway gap: Trade with the trend. Enter on pullback to gap midpoint. Stop below gap midpoint. Target: measured from trend origin, often 2x the gap-to-origin distance.
- Exhaustion gap: Fade the gap. For up gap, short the gap high. Stop above gap high. Target: prior support zone. Requires confirmation candle (reversal pattern).
Bearish Breakaway: Vedanta February 2019

Chart window: Dec 2018 – Apr 2019 · Data refreshed April 18, 2026 · Source: NSE (daily OHLC)
Vedanta’s February 1, 2019 breakaway gap down is among the most extreme in our audit: 7.12% gap on 10.72x volume. That volume ratio indicates massive institutional selling, usually triggered by a major news event. The stock declined another 9.16% over the next 10 sessions. Gaps of this magnitude rarely get filled in less than a quarter — the damage is too severe to recover quickly.
Recent Example: Infosys February 2026 Breakaway Gap Down

Chart window: Dec 2025 – Apr 2026 · Data refreshed April 18, 2026 · Source: NSE (daily OHLC)
Infosys’s February 2026 earnings-triggered breakaway gap down is a recent textbook example. 4.12% gap + 3.93x volume signals a meaningful institutional repositioning. The subsequent 10.55% decline over 10 sessions shows how earnings gaps typically play out: not filled in the short term because the underlying fundamental thesis has shifted.
Which Gaps Get Filled?

Chart data: Evergreen reference · Last reviewed April 18, 2026
On our NSE audit of 18 liquid large caps from 2016-2026, the gap-fill rates by type are:
- Common gap (low volume, in range): ~85% filled within 5 days.
- Breakaway gap (3x+ volume, out of consolidation): ~25% filled within 30 days.
- Runaway gap (mid-trend): ~20% filled within 30 days.
- Exhaustion gap (extended trend, reversal): ~75% filled within 15 days.
The volume rule: gaps on below-average volume typically fill. Gaps on 5x+ volume almost never fill quickly — institutions leave the market with new positioning, and the market adjusts to that reality rather than reverting.
Runaway Gap: Vedanta December 2020

Chart window: Oct 2020 – Feb 2021 · Data refreshed April 18, 2026 · Source: NSE (daily OHLC)
Vedanta’s December 24, 2020 runaway gap occurred 57.7% into an established uptrend. Runaway gaps confirm trend strength — the pre-existing trend already had momentum, and the gap accelerates it further. In this case the stock continued another 11.79% over the next 10 sessions before consolidating. Runaway gaps are often said to mark “roughly the halfway point” of a trend — a rule of thumb that has held reasonably well in our audit window.
Runaway Gap: Infosys July 2020

Chart window: May – Sep 2020 · Data refreshed April 18, 2026 · Source: NSE (daily OHLC)
Infosys’s July 16, 2020 gap is a clean runaway gap triggered by Q1 earnings. Prior trend was up 24.11% over the preceding 40 sessions. The 5.4% gap on earnings accelerated the move. Follow-through was moderate — 5.54% in 10 sessions — consistent with a gap that represents mid-trend rather than breakaway or exhaustion.
Interactive Tool: Gap Classifier
Enter gap size, volume ratio, and prior context. The classifier identifies whether the gap is common, breakaway, runaway, or exhaustion, estimates fill probability, and recommends action (trade with, fade, or wait).
Practical Rule Book
- Ignore common gaps. Small gaps inside ranges carry no edge. Skip them.
- Require volume above 2x average for tradeable gaps. 3x+ is strong. 5x+ is institutional.
- Trade WITH breakaway and runaway gaps. Against exhaustion gaps (fade them).
- Stop-loss placement: below gap bottom (for bull gap) or above gap top (for bear gap).
- Target: prior-pattern height or trend measurement projected from gap level.
- Context matters: consolidation before = breakaway. Mid-trend = runaway. Extended trend = possible exhaustion.
Common Mistakes
Mistake 2: Ignoring volume. Volume is the single most important filter for gap classification.
Mistake 3: Fading breakaway gaps (expecting fill). 75% of breakaways do NOT fill in 30 days. Trade with them.
Mistake 4: Trading with exhaustion gaps. At the end of extended trends, gaps are reversal signals, not continuation.
Mistake 5: Using gap strategies on illiquid stocks. Thin volume produces noise gaps. Stick to Nifty 500.
Related Reading
- Volume in Trading — the critical filter for gap classification.
- Flags and Pennants — continuation patterns often preceded by runaway gaps.
- Head and Shoulders — breakaway gaps below neckline confirm breakdowns.
- Triangle Patterns — breakaway gaps out of triangles produce clean setups.
- Support and Resistance — gap levels often become future S/R.
Quick Quiz: Gaps
Five questions to check your grasp. No login, no score saved — just instant feedback.
1. A breakaway gap forms …
2. A runaway (measuring) gap typically appears …
3. An exhaustion gap is a warning because …
4. A common gap (or area gap) is …
5. The beginner mistake with gaps is …
| Gap type | Where it forms | Trade response |
|---|---|---|
| Common Gap | Mid-trend, low conviction | Often fills — fade with caution |
| Breakaway Gap | Start of new trend | Trade in gap direction — trend day |
| Runaway (Continuation) Gap | Mid-trend, high conviction | Add to position — trend strong |
| Exhaustion Gap | End of extended trend | Counter-trend setup — reversal warning |
I traded a Breakaway Gap on Infosys after an earnings beat. I learnt to differentiate gap types: breakaways follow through, common gaps fill the same week.
What is a gap in trading?
A gap is a vertical price jump where the opening price is significantly above the prior close (up gap) or below it (down gap). On a chart, it appears as an empty space between candles. Gaps form when overnight news or orders create a price shift between sessions.
What is a breakaway gap?
A breakaway gap is a gap that breaks price out of a consolidation or chart pattern on high volume (typically 3x+ average). It starts a new trend and is usually not filled quickly. On NSE, 75 percent of breakaway gaps remain unfilled after 30 days.
What is a runaway gap?
A runaway gap (continuation gap) occurs mid-trend and accelerates the existing direction. It confirms trend strength and is often said to mark roughly the halfway point of the full trend. Trade with the gap, not against it.
What is an exhaustion gap?
An exhaustion gap occurs at the end of an extended trend (25 percent+ already moved). It represents the final push before reversal. Usually gets filled within 15 days. Often fades on weakening volume and produces a reversal pattern after.
Do all gaps get filled?
No. Only common gaps (small, low-volume, in-range) reliably fill. Breakaway and runaway gaps hold 75-80 percent of the time over 30 days. Exhaustion gaps fill roughly 75 percent of the time within 15 days. Context and volume determine fill probability.
How do I identify gap type?
Check three things: (1) volume ratio vs 20-day average, (2) prior context (consolidation = breakaway, mid-trend = runaway, extended trend = possible exhaustion), (3) gap size. Institutional gaps run 3x+ average volume; retail gaps run under 1.5x.
What stop-loss should I use for a gap trade?
For bullish breakaway: stop below the gap bottom (the prior close). Invalidation if the gap fills. For bearish: stop above the gap top. For runaway: stop at the gap midpoint. Tighter stops whipsaw; wider stops degrade R:R.
Can gaps form intraday?
In Indian cash markets, true gaps only form at the open (9:15 AM). Intraday price jumps during a session are not gaps in the technical sense. Some traders call large intraday candles with no overlap to the prior candle 'gaps' but the classification rules apply only to open-to-close gaps on the daily chart.
The Bottom Line
Gaps are not noise. They are high-information events where overnight order flow creates a visible price dislocation. The key to trading gaps is classification: common gaps are worthless, breakaway and runaway gaps are tradeable with the direction, and exhaustion gaps are reversal signals to fade. Volume is the critical filter that distinguishes institutional gaps (3x+ volume) from retail noise gaps (under 1.5x).
Seven NSE examples delivered 7-24% follow-through in 10 sessions after classification filters were applied. The pattern is simple but requires discipline. Most traders get seduced by every gap they see. The profitable ones ignore common gaps and wait for the 3x-volume variants that actually carry information.
Add gap-scanning to your weekly routine. On Monday morning, scan Friday-to-Monday gaps on your watchlist. Check volume ratio. Check prior context. The setups that pass all three filters are the ones to watch — the rest can be ignored.
Risk Notice
Trading in equities, derivatives, and index products carries substantial risk of loss. The examples in this article are historical and do not guarantee future returns. Price data is sourced from NSE daily OHLC feeds; back-testing any strategy on your own data is essential before deploying capital. This content is educational only. It is not an investment recommendation, a tip, or a solicitation to trade any specific security. Consult a SEBI-registered advisor before acting on any information here. Size every trade at 1 percent of your total capital and never trade money you cannot afford to lose.