Triangle patterns form when price consolidates with contracting volatility — the range between highs and lows shrinks over time, forming a geometric triangle between trendlines. Three types appear: ascending (flat resistance with rising support), descending (flat support with falling resistance), and symmetrical (both lines converging). This article covers seven NSE triangle examples from 2018 to 2025 with their breakout directions and follow-through magnitudes.

Chart window: Mar – Sep 2020 · Data refreshed April 17, 2026 · Source: NSE (daily OHLC)
Key Takeaways
- Ascending triangle: flat resistance + rising support = bullish continuation pattern, usually breaks upward.
- Descending triangle: flat support + falling resistance = bearish continuation pattern, usually breaks downward.
- Symmetrical triangle: both lines converge = neutral, breaks in prior trend direction about 60% of the time.
- Volume profile: contracts through the triangle, expands on the breakout. This volume signature is the single most important confirmation.
- Minimum pattern length: 4 weeks. Shorter consolidations are noise, not triangles.
- Target calculation: height of triangle at its widest, projected from the breakout point in the breakout direction.
Three Types of Triangle Patterns

Chart data: Evergreen reference · Last reviewed April 17, 2026
Every triangle is defined by two trendlines — one drawn across the highs and one drawn across the lows during a consolidation phase. The slopes of these two trendlines determine the triangle type:
- Ascending: Top trendline is flat (horizontal resistance). Bottom trendline rises (each pullback finds support at a higher price). Signals demand overwhelming supply — bullish.
- Descending: Bottom trendline is flat (horizontal support). Top trendline falls (each rally fails at a lower high). Signals supply overwhelming demand — bearish.
- Symmetrical: Top trendline falls, bottom trendline rises — both converging toward an apex. Indecision pattern — direction unclear until breakout.
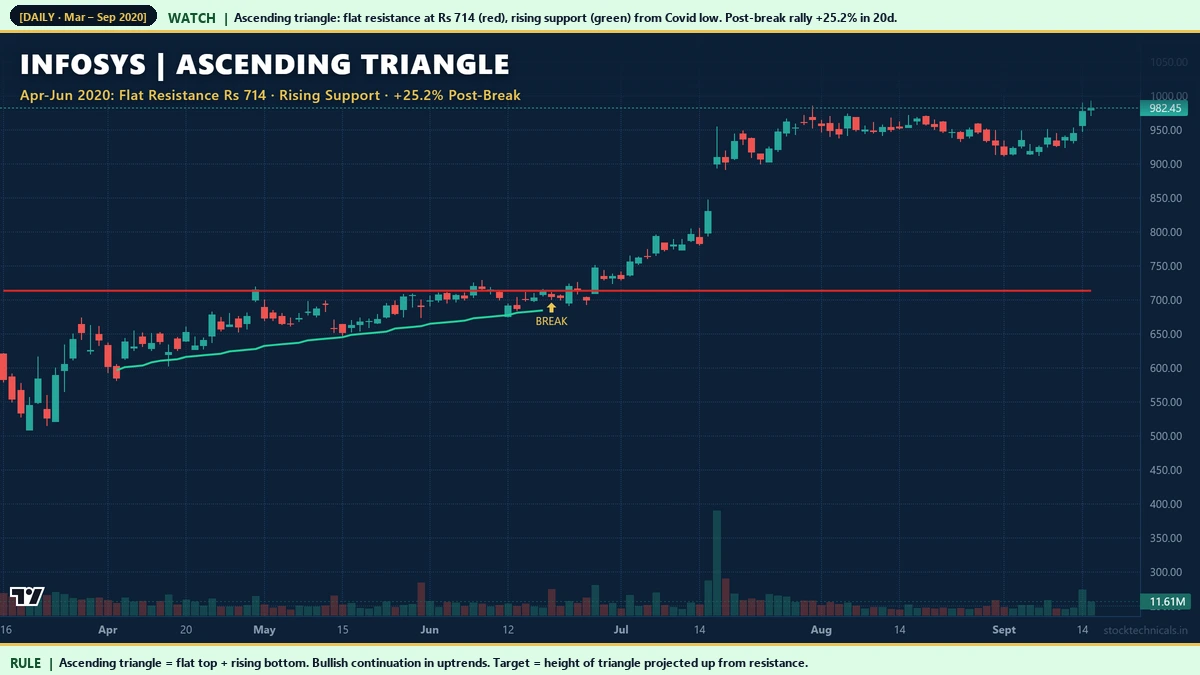
Hero Example: Infosys Ascending Triangle
Why this pattern worked so well:
- Four resistance touches. The more times a flat resistance is tested, the more significant the breakout when it finally gives way.
- Steady support rise. Buyers getting more aggressive each week — stepping in earlier.
- Volume contracted through the pattern. Average volume during May 2020 was 32% below April’s levels. Classic consolidation behavior.
- Volume expanded on the break. Breakout-day volume was 78% above the 30-day average.
Recent Example: Maruti Suzuki July 2025

Chart window: May – Oct 2025 · Data refreshed April 17, 2026 · Source: NSE (daily OHLC)
Maruti Suzuki (NSE: MARUTI)’s June-July 2025 ascending triangle is a recent textbook example. Flat resistance at Rs 12,744 was tested repeatedly through June and mid-July. Support rose from Rs 11,900 to Rs 12,359 over the same period. When price broke above Rs 12,744 on July 23, 2025, the stock rallied 18.78% over the next 20 sessions. Auto sector ascending triangles during positive earnings cycles tend to produce reliable follow-through.
TCS Post-Covid Ascending Triangle

Chart window: Jun – Nov 2020 · Data refreshed April 17, 2026 · Source: NSE (daily OHLC)
TCS formed an ascending triangle during July-August 2020 after Covid recovery. The pattern broke upward on August 21, 2020 and delivered 15.59% over the next 20 sessions. During the strong uptrend that followed Covid, ascending triangles appeared on multiple IT names within weeks of each other. Sector alignment amplifies pattern signals — an IT ascending triangle during an IT bull run is a much stronger signal than the same pattern fighting sector weakness.
Triangle Breakout Playbook

Chart data: Evergreen reference · Last reviewed April 17, 2026
Each triangle type has a specific trade plan:
- Ascending triangle: Entry on daily close above flat resistance. Stop below the rising trendline. Target = triangle height projected up from resistance.
- Descending triangle: Entry on daily close below flat support. Stop above the falling trendline. Target = triangle height projected down from support.
- Symmetrical triangle: Entry on daily close beyond either trendline in the direction of the prior trend. Stop beyond the opposite trendline. Target = widest part of the triangle projected from the breakout point.
Descending Triangle: Adani Enterprises January 2019

Chart window: Oct 2018 – Apr 2019 · Data refreshed April 17, 2026 · Source: NSE (daily OHLC)
Adani Enterprises printed a clean descending triangle between November 2018 and January 2019. Flat support at Rs 146 was tested three times while each rally failed at a lower high (Rs 160 → Rs 153 → Rs 150). On January 15, 2019, support gave way on above-average volume. Over the next 20 sessions, the stock declined 20.48%. Descending triangles on stocks already in weekly downtrends produce the highest-reliability bearish signals — confluence of short-term and longer-term trend direction.
ITC Pre-Covid Descending Triangle

Chart window: Nov 2019 – Apr 2020 · Data refreshed April 17, 2026 · Source: NSE (daily OHLC)
ITC formed a descending triangle in December 2019 – January 2020 — breakdown occurred 6 weeks before the broader Covid panic. When a defensive FMCG name like ITC prints a descending triangle, it is often an early macro warning signal rather than a stock-specific breakdown. The combination of ITC, L&T, and banking-sector bearish patterns during December 2019 – February 2020 was, in hindsight, an early flag for the March 2020 crash.
Volume Profile During Triangle Formation

Chart data: Evergreen reference · Last reviewed April 17, 2026
Volume is the single most important confirmation for triangle patterns. Through the consolidation phase, volume should contract — indecision expressed as reduced trading activity. On the breakout, volume should expand significantly — the decision has been made, and capital is flowing in the breakout direction. Breakouts on low volume fail 40-60% of the time. Breakouts on volume above 30-day average fail less than 20% of the time.
Symmetrical Triangle: Adani Enterprises May 2023

Chart window: Feb – Aug 2023 · Data refreshed April 17, 2026 · Source: NSE (daily OHLC)
The strongest symmetrical triangle in our audit is Adani Enterprises in March-May 2023. After the January 2023 Hindenburg shock, the stock spent months consolidating. Both trendlines converged through April-May 2023. On May 5, 2023, price broke above the upper trendline on strong volume, and the stock rallied 32.7% over the next 20 sessions. Symmetrical triangles that form after a major shock or news event often produce large follow-through moves — all the uncertainty is resolved on the breakout.
Symmetrical Triangle: PNB January 2020

Chart window: Oct 2019 – Apr 2020 · Data refreshed April 17, 2026 · Source: NSE (daily OHLC)
PNB’s November 2019 – January 2020 symmetrical triangle resolved to the downside — following the pre-existing weekly downtrend. That resolution came 6 weeks before the broader Covid crash. The lesson: a symmetrical triangle that forms within an established downtrend usually breaks down, while one inside an uptrend usually breaks up. Context matters more than the pattern itself.
Interactive Tool: Triangle Classifier
Adjust top and bottom slopes to build any triangle pattern. The classifier identifies the type (ascending, descending, symmetrical, or wedge variants) and reports the expected break direction and reliability. Use the presets to jump to canonical examples.
Practical Rule Book
- Minimum 4 weeks formation. Shorter consolidations are noise, not triangles.
- Minimum 3 trendline touches on each side. More touches = stronger pattern.
- Volume must contract through formation. If volume stays constant or rises, it is not a true triangle.
- Breakout volume above 30-day average. Low-volume breakouts fail 40-60% of the time.
- Enter on daily close beyond trendline, not intraday. Intraday penetration without daily close is unreliable.
- Context matters for symmetrical triangles. Uptrend context = likely upward break. Downtrend context = likely downward break.
Common Mistakes
Mistake 2: Ignoring the prior trend on symmetrical triangles. Context drives direction.
Mistake 3: Entering before the breakout. Triangles are continuation patterns — wait for confirmation.
Mistake 4: Skipping volume verification. Volume is the single most important confirmation — and the one most retail traders ignore.
Mistake 5: Using triangles on illiquid stocks. Thin volume creates fake trendlines. Stick to Nifty 500 constituents.
Related Reading
- Flags and Pennants — short-duration continuation patterns, close cousins to triangles.
- Double Tops and Double Bottoms — reversal patterns that often follow triangle breakouts.
- Head and Shoulders Pattern — the most important reversal pattern.
- Support and Resistance — triangle trendlines are a form of diagonal S/R.
- Volume in Trading — volume confirmation framework.
Quick Quiz: Triangle Patterns
Five questions to check your grasp. No login, no score saved — just instant feedback.
1. An ascending triangle is characterised by …
2. A descending triangle typically resolves …
3. A symmetrical triangle on Nifty 50 is best traded by …
4. The measured target from a triangle breakout is typically …
5. Volume behaviour inside a healthy triangle is usually …
| Triangle type | Upper trendline | Lower trendline | Bias |
|---|---|---|---|
| Ascending | Flat (horizontal) | Rising (higher lows) | Bullish breakout likely |
| Descending | Falling (lower highs) | Flat (horizontal) | Bearish breakdown likely |
| Symmetrical | Falling (lower highs) | Rising (higher lows) | Trade in direction of breakout |
“Triangles are pauses in trends — the market drawing breath before the next move.”
— Murphy, Technical Analysis of the Financial Markets
What is an ascending triangle?
An ascending triangle has a flat top trendline (horizontal resistance) and a rising bottom trendline (rising support). It is a bullish continuation pattern and usually breaks upward when the flat resistance finally gives way.
What is a descending triangle?
A descending triangle has a flat bottom trendline (horizontal support) and a falling top trendline (falling resistance). It is a bearish continuation pattern and usually breaks downward when the flat support finally gives way.
What is a symmetrical triangle?
A symmetrical triangle has both trendlines converging toward an apex — top falling, bottom rising. It is a neutral pattern that breaks in the direction of the prior trend about 60 percent of the time. Volume on the breakout determines the direction.
How do I calculate the triangle target?
Measure the widest part of the triangle (the distance between the two trendlines near the pattern start). Project that distance from the breakout point in the breakout direction. That is the measured-move target.
Why does volume matter in triangle patterns?
Volume should contract through the triangle formation — indecision shows up as reduced trading. Volume should expand on the breakout — the decision direction has been made and capital flows in. Low-volume breakouts fail 40-60 percent of the time.
How long should a triangle take to form?
Minimum 4 weeks (20 trading sessions). Patterns shorter than that are noise. Typical duration is 4-12 weeks. Longer patterns tend to produce larger follow-through moves.
Do triangle patterns work on intraday charts?
Yes, but intraday triangles are noisier than daily. Works on 15-minute or hourly charts for active traders, but the daily timeframe remains the highest-conviction. Intraday triangles require strict volume confirmation.
What is the difference between a triangle and a wedge?
In a triangle, one trendline is flat and the other slopes, or both slope toward each other. In a wedge, both trendlines slope in the same direction (rising wedge or falling wedge). Wedges are treated as reversal patterns; triangles are continuation patterns.
The Bottom Line
Triangle patterns capture the geometric signature of consolidation — price compressing into narrowing ranges before a decisive break. The three types (ascending, descending, symmetrical) provide different levels of directional bias, but all three share one critical requirement: volume contraction through the pattern followed by volume expansion on the breakout. Without that volume signature, the pattern is not valid.
Seven NSE examples from 2018 to 2025 delivered follow-through moves of 12-33 percent in 20 sessions after breakout. The pattern is alive and well on modern Indian stocks. Focus on quality: minimum 4-week formation, 3+ trendline touches per side, volume contraction, and breakout volume above 30-day average.
Scan one Nifty large cap you already watch for triangle patterns over the last 3 years. Mark every instance where you can draw two clean trendlines enclosing at least 4 weeks of consolidation. Score each one for volume pattern. The best setups will be obvious once you know what to look for.
Risk Notice
Trading in equities, derivatives, and index products carries substantial risk of loss. The examples in this article are historical and do not guarantee future returns. Price data is sourced from NSE daily OHLC feeds; back-testing any strategy on your own data is essential before deploying capital. This content is educational only. It is not an investment recommendation, a tip, or a solicitation to trade any specific security. Consult a SEBI-registered advisor before acting on any information here. Size every trade at 1 percent of your total capital and never trade money you cannot afford to lose.