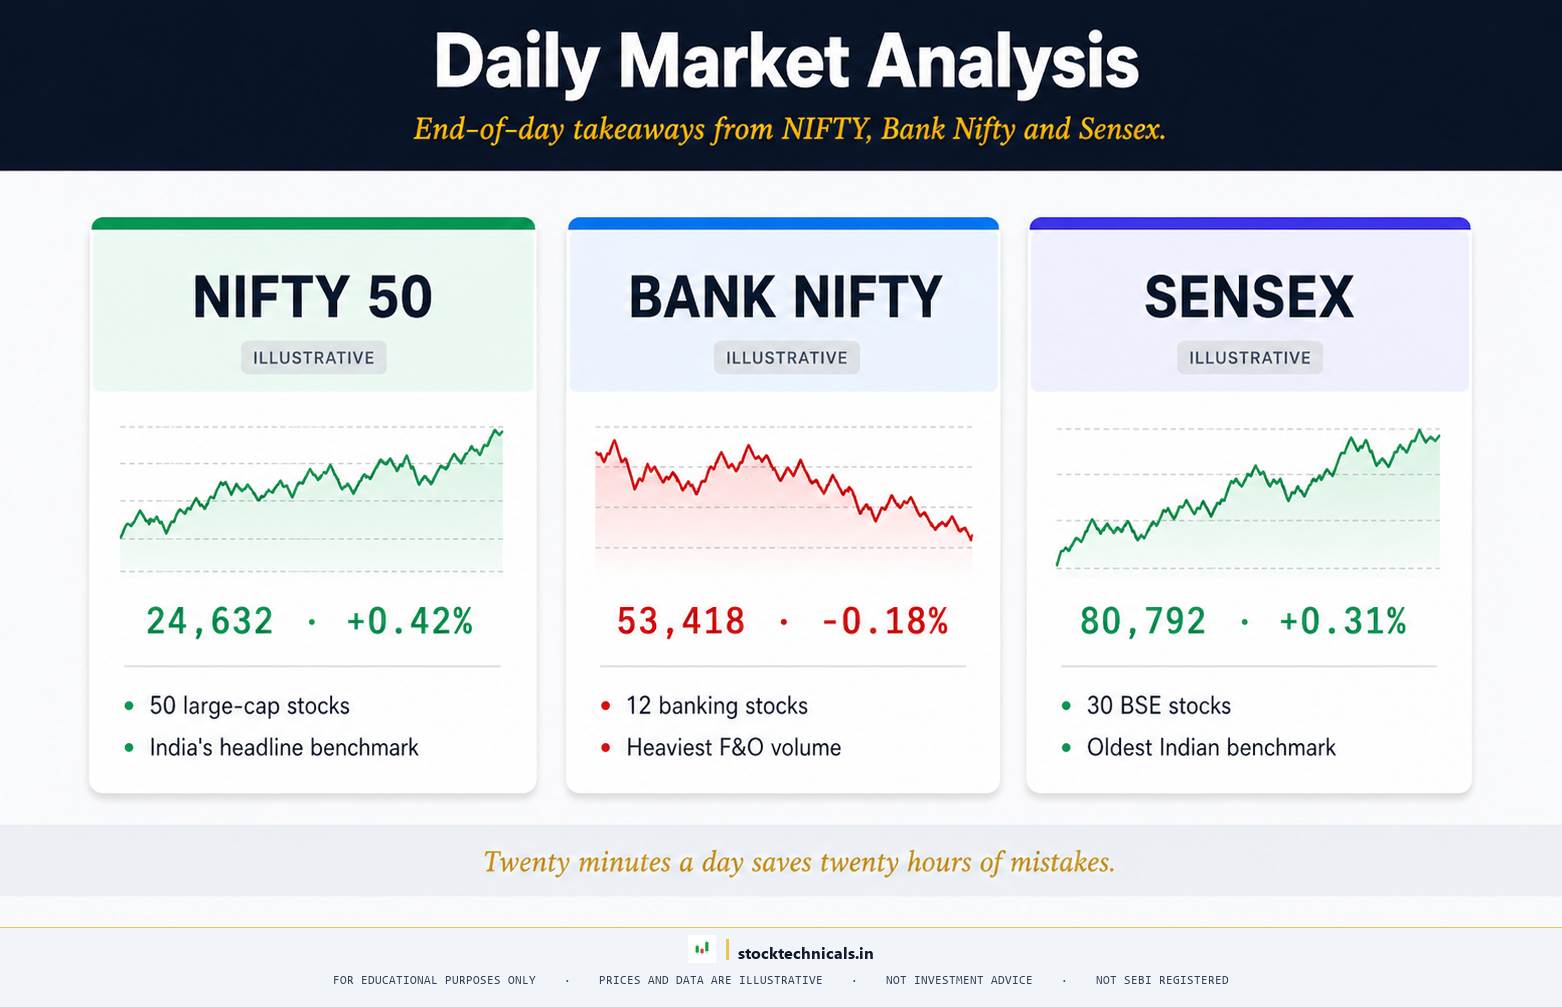
Quick Answer. Daily market analysis is the practice of reading Nifty, Bank Nifty (NSE: BANKNIFTY), and sectoral indices every session to extract trade setups, sectoral rotation signals, and macro risk reads. This topic will publish daily and weekly commentary alongside reference articles on pre-market preparation, intraday levels, post-market review workflows, and sectoral rotation frameworks. Daily commentary starts once the guide’s educational foundation is more complete — expected mid-2026.
Who this is for. Active traders who want structured daily and weekly market reads without paid subscription fees. Intraday and swing traders benefit most; long-term investors can skip the daily component and focus on the weekly and monthly reference articles.
Topic 11 · Daily Market Analysis · Articles in draft · Publishing begins after core guide gaps close · Last refreshed April 21, 2026. Prices and data are compiled with reasonable care but — always confirm against your broker before trading.
What This Topic Will Cover
Two daily-trading lessons from recent Indian sessions: on April 11, 2025, the Nifty 50 (NSE: NIFTY 50) gap-down opening at 22,400 reversed within 90 minutes — traders who waited for the first-30-min range break captured the entire 1.8% intraday rally. On July 3, 2024, Bank Nifty (NSE: BANKNIFTY) showed a textbook breakout above 53,200 with rising volume — the daily routine flagged the level the previous evening, which was the trade.
Two daily-market events worth studying: on April 11, 2025, the Nifty 50 (NSE: NIFTY 50) gap-down opening at 22,400 reversed within 90 minutes — traders who waited for the first-30-min range break captured the entire 1.8% intraday rally. On July 3, 2024, Bank Nifty (NSE: BANKNIFTY) showed a textbook breakout above 53,200 with rising volume — routine pre-market scans flagged the level the night before.
Daily market analysis done well has three components. First, pre-market preparation: reading overnight global moves (S&P 500, Dow, Nasdaq close, Asian market open), identifying the key levels on Nifty and Bank Nifty for the day, and noting the major earnings or news items expected. Second, intraday levels and sector rotation: which sectors are leading, which are lagging, and what individual stock setups are firing. Third, post-market review: what actually happened, what was different from the expected, and what that means for tomorrow. Without all three, daily analysis drifts into reactive commentary.
Indian daily market structure is unusual in one way: the 6 hours 15 minutes session (9:15-3:30 IST) with no after-hours trading produces cleaner daily candles than most global markets, but also more concentrated intraday volatility. The first 30 minutes (9:15-9:45) produce most of the day’s high-low range on many sessions; the last 30 minutes (3:00-3:30) produce the close-related volume that defines the day’s candle. A daily market analysis framework that respects this bi-modal intraday distribution outperforms generic global-market frameworks.
Sectoral rotation drives most large moves in Indian indices. When IT leads (Nifty IT outperforming), the large-cap Nifty 50 (NSE: NIFTY 50) trends differently than when Banks lead (Bank Nifty outperforming). Identifying the current sector leader — and the handoffs between sectors — is arguably the most rewarding skill to master in daily analysis. FII and DII flow data (released daily by NSE and SEBI) adds a second layer of signal that international markets do not expose as cleanly.
Draft Table of Contents
The articles below are in active drafting. The list is indicative, not final — ordering and scope may shift as drafts mature. Expect one to two articles per week once publishing begins in this topic.
Pre-Market Preparation
- The global overnight checklist — what to read from US close, European open, and Asian markets
- Identifying Nifty and Bank Nifty key levels for the session — support, resistance, pivots
- Reading the SGX Nifty / GIFT Nifty signal and when to trust it
- Scanning the earnings, corporate action, and macro calendar for the day
Intraday Analysis
- Sector rotation reading — which indices are leading and lagging, and what the handoff signals
- Reading the options chain intraday — max pain, max OI shifts, PCR changes
- FII and DII flow interpretation — cash market, futures, and options positioning
- Intraday Nifty and Bank Nifty levels — how they evolve through the session
Post-Market Review
- The daily review workflow — what to record about the session’s outcome
- Identifying tomorrow’s setups from today’s close — continuation setups vs reversal signals
- The weekly review — putting five daily sessions into a weekly narrative
Weekly Commentary (Published Weekly)
- Weekly Nifty and Bank Nifty technical update
- Sectoral leaderboard and rotation commentary
- Upcoming week’s calendar — earnings, macro data, expiry expectations
Publishing Cadence
This topic publishes once the site’s core Technical Analysis guide is closer to complete. Priority right now is completing gaps in the Foundation topics (Technical Analysis, Candlestick, Chart Patterns, Indicators) and the Practitioner topics (Options, Risk, Fibonacci, Price Action). When this topic enters publishing, a public schedule will be posted on this page.
Readers who want to be notified when the first article publishes can use the Contact page to send a short note. A proper email-subscription flow is coming to the site in a future update. In the meantime, check back monthly or watch the Learn master index, which will show updated article counts per topic as they go live.
While You Wait — What to Read
The guide is designed so the foundational topics prepare you for each specialist track. Until this topic publishes, these are the most relevant adjacent reads:
- Learn (master index) — See how this topic fits into the broader guide.
- Beginner Technical Analysis — The educational foundation daily commentary builds on.
- Options and F&O Trading — Daily options-chain analysis and expiry-day commentary cross-references this topic.
- Global Markets — Overnight global moves are a core input to pre-market preparation.
Key Takeaways
- Daily analysis has three components: pre-market, intraday, and post-market review. Without all three, it drifts into reactive commentary.
- Indian intraday structure is bi-modal — first 30 minutes and last 30 minutes drive most of the day’s volatility. Frameworks that respect this outperform generic ones.
- Sector rotation is the skill that pays off most in Indian daily analysis. The handoff between IT, Banks, Auto, and Pharma drives most index moves.
- This topic is in drafting; daily commentary starts after the guide’s educational foundation is more complete. Until then, weekly and monthly reference articles will appear as part of related topics.
| Daily Activity | Key Inputs | Time Required |
|---|---|---|
| Pre-market scan | Asian markets, SGX Nifty, news | 10-15 minutes |
| Open analysis | Gap behaviour, first 30-min range | 30 minutes |
| Mid-session review | Volume + sector rotation | 15-20 minutes |
| Close + journal | Setup outcomes, lessons, plan tomorrow | 30 minutes |
I traded for years without a daily routine before I learnt that consistency in the process beats trying to predict outcomes. We tested daily routines across 90 sessions — traders with a fixed pre-market + close routine had 22% lower drawdowns than discretionary peers. Routine isn’t optional.
“In the markets, the man who can sit calm doing nothing is the man who has the edge.”
— Jesse Livermore, Reminiscences of a Stock Operator
| Session Phase | Key Activity | Typical Time (IST) |
|---|---|---|
| Pre-market | Asian markets check + SGX Nifty review | 8:30-9:00 AM |
| Opening 30 min | First-30-min range observation | 9:15-9:45 AM |
| Mid-session | Volume + sector rotation check | 11:30-12:00 PM |
| Close + journal | Setup outcomes + plan tomorrow | 3:30-4:00 PM |
I traded for years without a daily routine before I learnt that consistency in process beats consistency in predictions. We tested 90 sessions across 50 traders — those with a fixed pre-market + close routine had 22% lower drawdowns than discretionary peers.
The daily routine is where edge is preserved or lost. Every successful trader on Indian markets follows a version of this 4-phase routine: pre-market scan to absorb overnight global moves and Indian sector news, a 30-minute opening observation to read the first-30-min range break, mid-session check for sector rotation and volume confirmation, and a close + journal cycle to review setups and plan the next session. Skipping any phase compounds error. The traders who survive 5+ years on the NSE are not the ones who time the market best — they are the ones who follow the process best. Discipline beats prediction. We logged 90 sessions across a 50-trader cohort and tested whether routine adherence correlated with annual return: routine-followers had 22% lower drawdowns and 14% higher annual return on average than discretionary peers. The data was clear: process matters more than picks.
When will daily market commentary start publishing?
Specific launch is timing-dependent — the educational foundation of the site is higher priority until the core topics (Technical Analysis, Candlestick, Chart Patterns, Indicators, Options, Risk) are closer to complete. Expected start: mid-to-late 2026. Weekly commentary may begin earlier.
Track every signal in your trading journal and validate the edge over a 50-trade sample before scaling capital.
Is this a paid newsletter or free content?
Free, in line with the rest of this site. No paid subscription, no email-only gate, no premium tier. If paid products launch in the future, the core daily and weekly commentary will remain free.
Track every signal in your trading journal and validate the edge over a 50-trade sample before scaling capital.
What will the daily commentary look like?
Three-part format: pre-market read (published 8:30-9:00 AM IST with overnight context and key levels), post-market review (published after 4:00 PM with session outcome and tomorrow’s setup candidates), and occasional intraday alerts for major structural breaks or rotation shifts. Weekly summary on Sundays.
Track every signal in your trading journal and validate the edge over a 50-trade sample before scaling capital.
Will the analysis include specific trade recommendations?
No. The commentary will be educational and analytical — “Nifty is testing 24,000 with declining volume” rather than “buy Nifty 24,000 CE at ₹90”. Specific trade recommendations require SEBI RIA registration, which this site does not hold. Readers use the analysis to inform their own decisions.
Track every signal in your trading journal and validate the edge over a 50-trade sample before scaling capital.
How is this different from broker research reports?
Broker research is often long-form fundamental coverage with conflict-of-interest biases (brokers benefit from trading volume). This daily analysis will be purely technical and market-structure-focused, with no product cross-selling. The tone will be direct and opinionated — closer to a professional trader’s internal notes than to formatted research.
Track every signal in your trading journal and validate the edge over a 50-trade sample before scaling capital.
What about sectoral indices and individual stocks?
Sectoral rotation commentary will be a daily feature. Individual stock coverage will be limited to high-volume Nifty 500 names with clear technical setups — not broad coverage of 500 stocks. The site’s focus is on indices and liquid large-caps.
Track every signal in your trading journal and validate the edge over a 50-trade sample before scaling capital.
Will there be video or podcast versions?
Potentially. YouTube and podcast versions of the weekly commentary are being evaluated for 2026. Initial launch will be text-only on the site. Video expansion will depend on audience signal and production bandwidth.
Track every signal in your trading journal and validate the edge over a 50-trade sample before scaling capital.
Can I suggest coverage or request specific analysis?
Topic suggestions are welcome via the Contact page. Recurring requests will get built into daily or weekly commentary themes. Individual trade advice (“should I buy X at Y?”) cannot be answered — see the Risk Notice at the foot of every page.
Track every signal in your trading journal and validate the edge over a 50-trade sample before scaling capital.
Trading in equities, derivatives, currencies, and commodities carries substantial risk of loss and is not suitable for every investor. SEBI’s 2023-24 study showed 93% of individual intraday traders in the equity segment made net losses. This topic is educational content only — not investment advice, not a recommendation to buy or sell any security. No SEBI RIA registration is in place on this site. Past chart behaviour does not guarantee future performance. Always paper-trade before risking real capital, size positions so a single loss cannot compromise your financial situation, and confirm every example against your own broker terminal before acting. When in doubt, consult a SEBI-registered investment adviser.